Meteorology Solutions Ltd. is a pioneering company that leverages meteorological insights to optimize engineering solutions across various industries. The company collaborates with geologists, engineers, and architects to provide valuable context to account for weather impacts on projects. The mission of Meteorology Solutions is to comprehensively address weather factors to enable clients to make informed decisions around designs and weather-related risks.
Mike Green, Managing Director and Engineering Meteorologist at Meteorology Solutions, is a Class 1 meteorologist with past experience in aviation forecasting, marine forecasting, hurricane prediction, and other severe weather forecasting. Over the past 18 years, Mike has developed an engineering meteorology career that applies meteorology to engineering contexts such as for weather simulation using the mesoscale model Weather Forecasting and Research (WRF) for assessing wind farm potential and for extreme weather forecasting, designing TARPs (Trigger Action Response Plans) for high-risk road and rail networks, designing AI-based river flood forecasting models, conducting extreme wind assessment for towers and other structures, using computational fluid dynamics (CFD) for wind impact assessments in urban areas, and for thermal plume dispersion. Mike is also an expert witness for newly introduced wind studies on the impact of wind in the city of Christchurch, New Zealand.
Meteorology Solutions has been using the SimScale lattice Boltzmann method (LBM) integrated solver, Pacefish®, to undertake transient wind studies in New Zealand and Australia. Meteorology Solutions undertakes a range of studies involving wind modeling and comfort studies for various building types including hospitals, residential developments, shopping malls, and complex semi-open spaces. The company showcased its versatility by undertaking diverse projects such as forensic meteorology. The company provided expert witness services for insurance claims, police, and accident investigators for weather-related incidents, caused by flooding, ice, and strong wind gusts.
We have recently helped in the design of a data center in Australasia. We used SimScale to ensure that the natural cooling systems were not going to be compromised by heat from backup generator exhaust. SimScale was versatile software to evaluate different background wind and temperature scenarios to ensure that the risk of heated air entrainment was minimized.

Mike Green
Managing Director and Engineering Meteorologist at Meteorology Solutions Ltd.
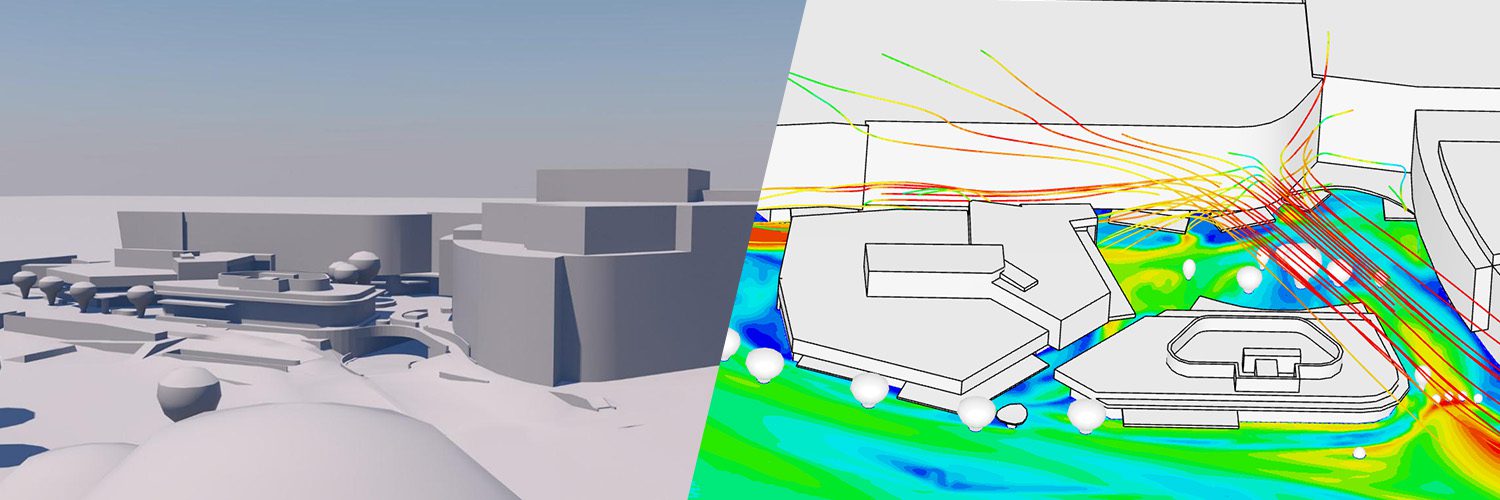
Following an earthquake in February 2011, much of the Christchurch central business district (CBD) was demolished due to unsafe or unrepairable buildings. Over recent years there has been much redevelopment of the CBD and the city has become vibrant again and includes many outdoor spaces. As part of the ongoing development and evolution of the city, the city council is considering changing planning rules for increased densification, including increased building heights in the CBD. One concern about having taller buildings is that it could increase wind impacts on pedestrians and in outdoor areas.
A recent project used SimScale modeling to test how increasing building heights affected wind impacts at ground level, and this showed that wind impacts increased with taller buildings. As part of changing the city plans to allow tall buildings in the CBD, the council has requested that wind impact assessments be completed to ensure public spaces are not significantly impacted and that suitable mitigation is implemented, if possible. Note the plan change negotiations were ongoing at the time of writing (Sept. 2023).
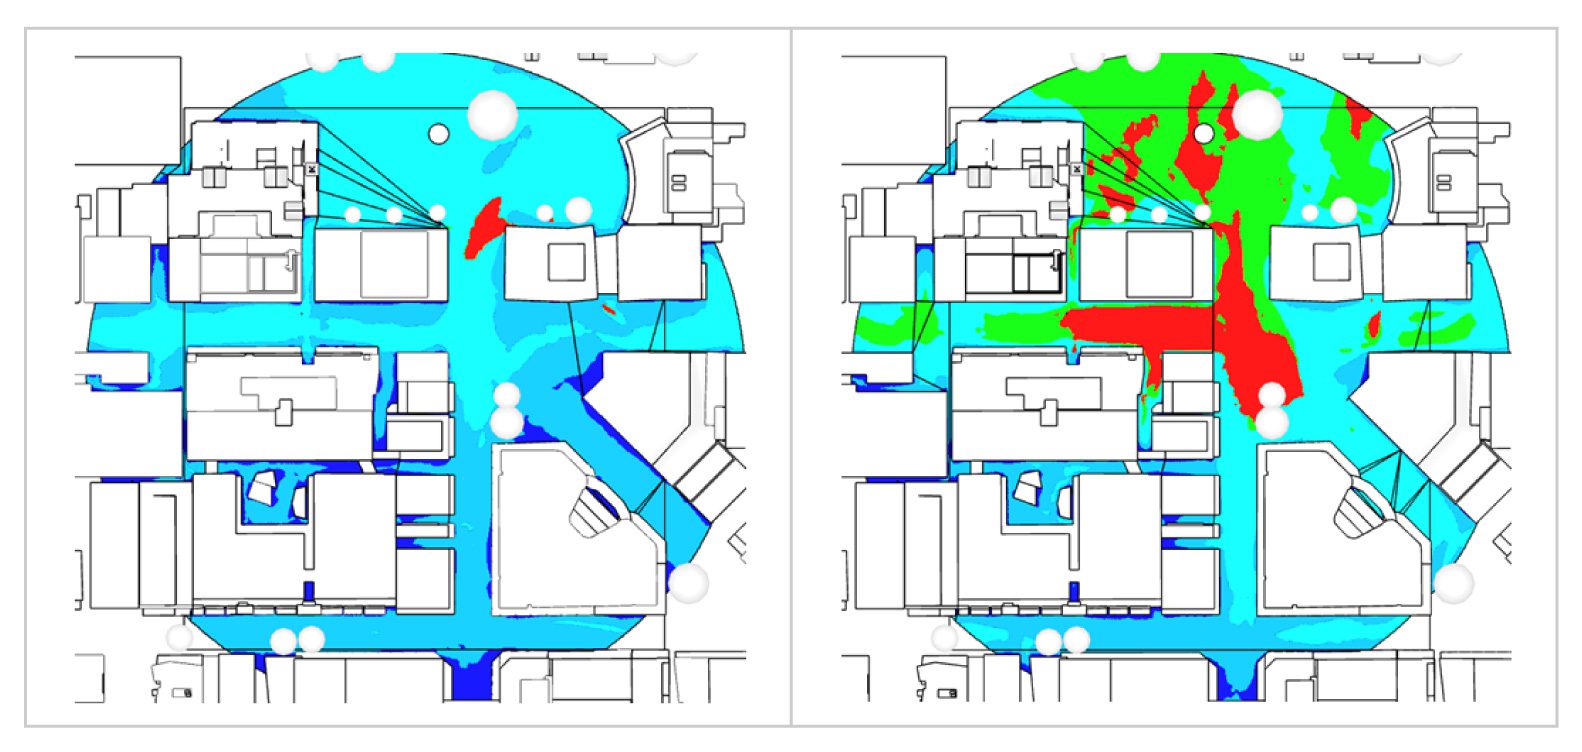
The results below illustrate how wind impacts changed when considering a scenario of added 30 m (left) and 90 m (right) height buildings. This result uses the London LDDC standard and shows increased wind impacts resulting from taller buildings.
Meteorology Solutions employed advanced technical workflows to achieve their goals. The team utilized CAD models, often optimizing them for simulation purposes from the earliest stages. They incorporated low-poly models, 3D modeling tools, and simulation solvers like PWC/LBM to ensure efficient analysis.
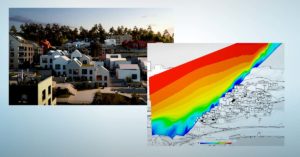
Meteorology Solutions was part of the project team to mitigate the impact of strong winds in a recently built outdoor mall area in Perth, Australia. Perth has one of the strongest daytime sea breeze regimes in the world which results from the significant difference between the land and ocean temperatures during summer months. The mall was located close to the coast.
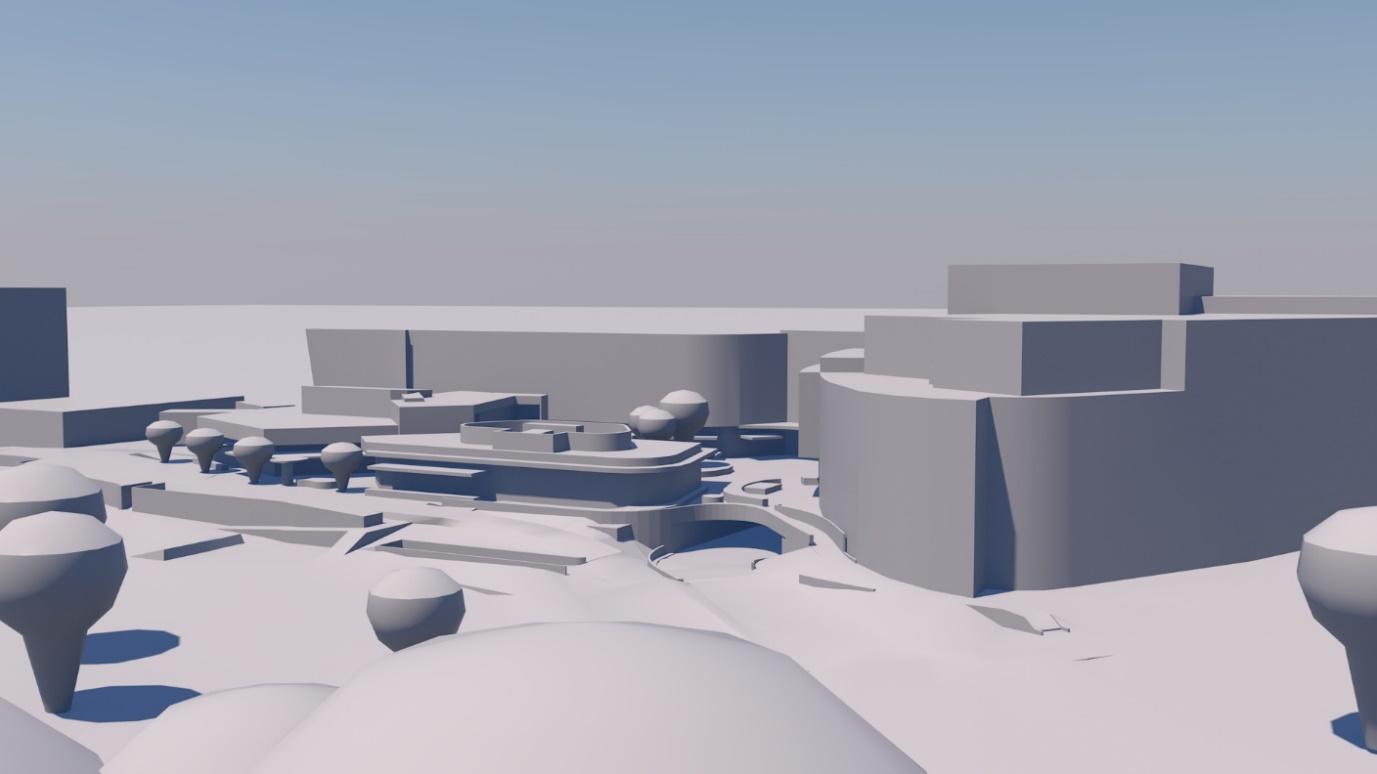
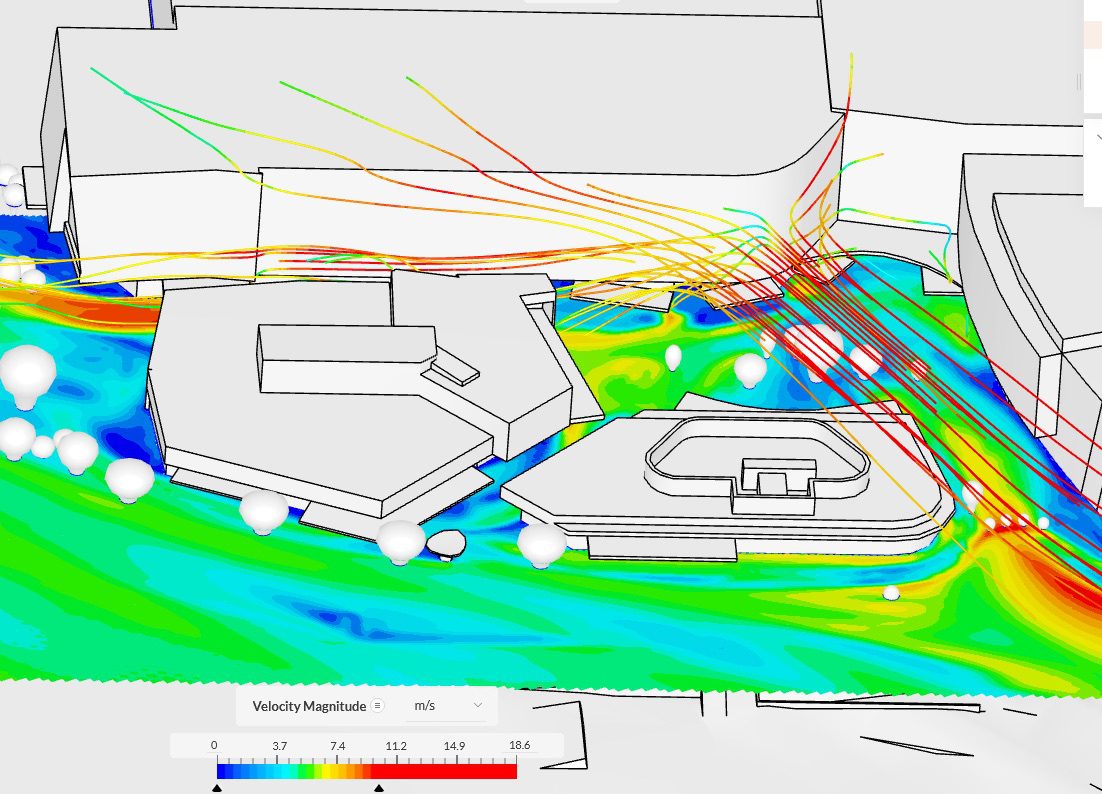
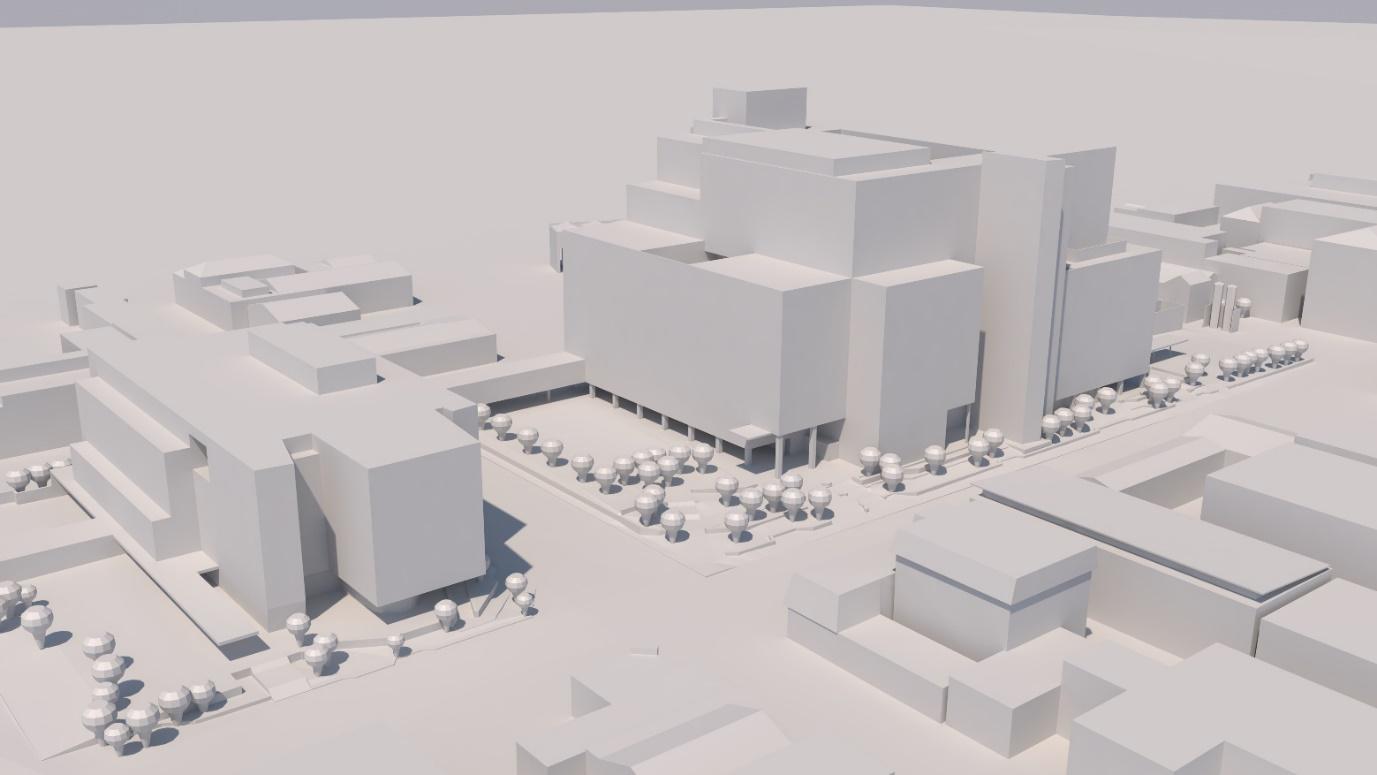
The results of the modeling informed the mall owner of possible design changes that could be used to mitigate problematic winds, such as using canopies, mesh barriers, and increased vegetation volume, height, and density. The images below show the 3D models of the shopping mall. Mike Green and his team were able to easily import the models into SimScale and use the lattice Boltzmann method (LBM) integrated solver to perform transient wind studies using local weather data from the climate database available in SimScale, augmented with some local wind data available close to the site.
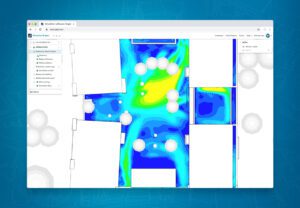
Meteorology Solutions was contracted to undertake a wind comfort and safety study in the design stage of a new city hospital. The focus of the project was to ensure safety for people accessing the hospital from car parking entrances, and also ensuring the outdoor gathering areas were protected from impacting winds.
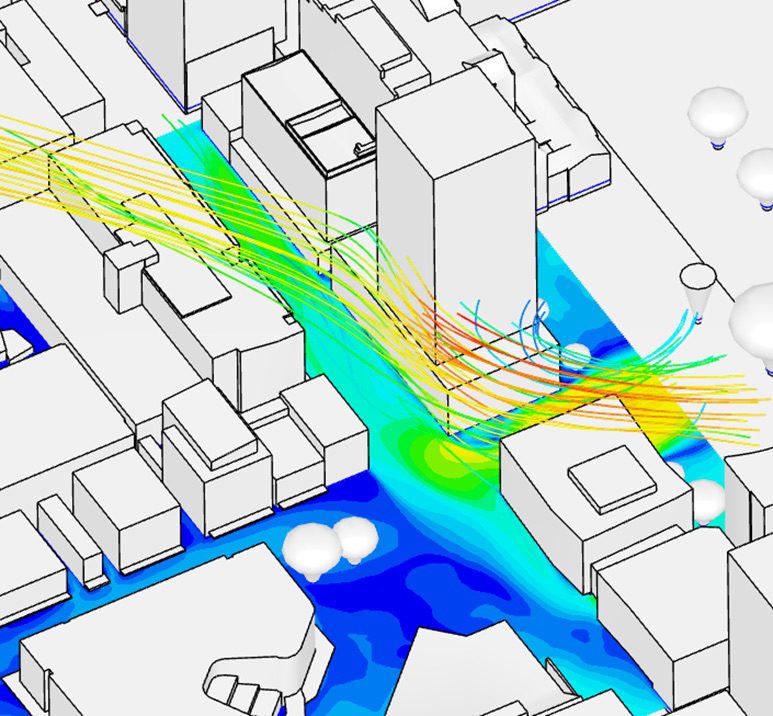
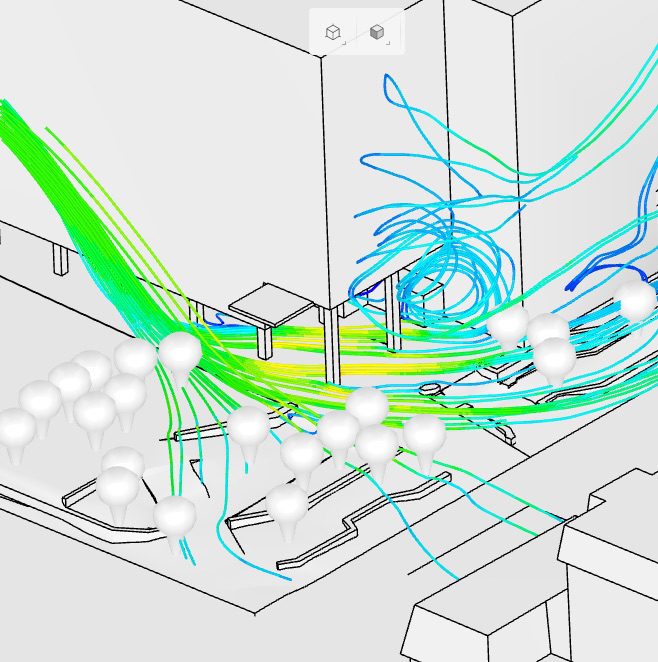
SimScale results below illustrate turbulence and downwash affecting the main entrance (which occurs about 5% of the time). The modeling included testing various vegetation, canopy, and porous screen options to mitigate the impacting wind situations that were resulting from downwash from a large smooth facade.
In the same project, Meteorology Solutions tested scenarios for emergency helicopter downwash to ensure it would not significantly impact an outdoor area between buildings and below the helipad. See the figure below for an example.

We are very satisfied with SimScale, it is a great product and fun and rewarding to use. SimScale has allowed us to apply our meteorology expertise to engineering contexts. We are no longer dependent on costly wind tunnel studies and can easily investigate wind impacts for building owners, planners, architects, and engineers.
Mike Green
Managing Director and Engineering Meteorologist at Meteorology Solutions Ltd.
On February 22, 2011, an earthquake affected Christchurch city. The earthquake was an aftershock from an earlier, larger earthquake (magnitude 7.1) on September 4, 2010, which was centered about 40 km west of the city, but only caused minor damage. The February earthquake (which was just one of thousands of aftershocks) was shallow (5 km depth) and was centered 5 km southeast of the city center. The earthquake magnitude was 6.3 but was associated with extreme shaking and with peak ground acceleration (PGA) measured at 2.2G (2.2 times the acceleration of gravity). With such intense shaking and ground acceleration, the east and south parts of the city suffered significant damage, including the CBD (central business district). Sadly, 185 people died and many hundreds were injured as a result of the earthquake.
The center of Christchurch is located within 10 km of the Pacific Ocean. The prevailing wind is from the ocean (from the northeast direction), and hills on the south side of the city help reinforce these winds. Meteorology Solutions thought it would be an interesting study to compare the pedestrian level winds prior to the earthquake to how it is in September 2023, especially considering the buildings and layout have changed significantly.
The current 3D model had already been built for an earlier project for assessing the wind impacts resulting from taller buildings in the CDB. It was challenging to find a model for the pre-earthquake scenario and this had to be built from past aerial photography, Google Earth, etc. Both models included trees and vegetation.
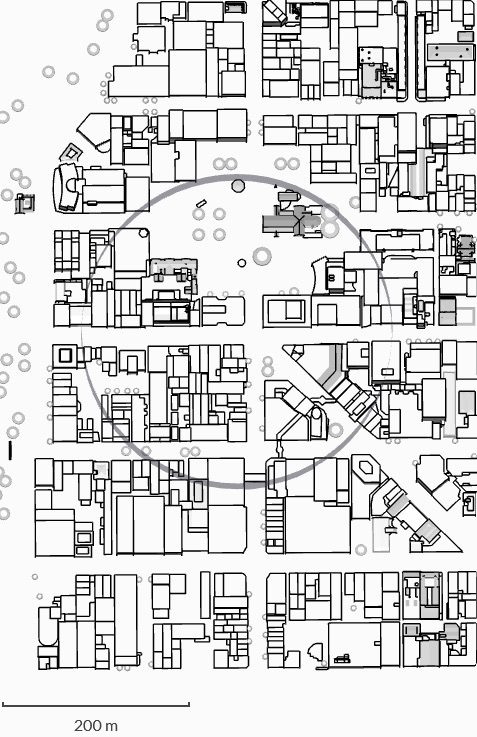
The model used the Pedestrian Wind Comfort simulation option to compare the wind climates pre- and post-earthquake. The assessment area (shown below on the pre-earthquake 3D model) covered three areas including:
The study wanted to know how the wind impacts have changed in these three areas.
Pre-earthquake perceptions were that the Christchurch CBD was often cold and windy, especially east-west orientated streets such as Hereford and Cashel. This perception was likely true in many cases with such streets acting as wind tunnels for the prevailing northeast winds and with shading from the buildings lining the streets making it feel colder.
Using the SimScale pedestrian wind comfort simulations, we were able to assess that The Square, Hereford Street, and east parts of Cashel Street experienced stronger northeast winds pre-earthquake than with the current building scenario as a result of winds being channeled down the streets. East parts of Cashel Street, including the street mall area did not indicate significant changes in wind conditions. This is shown in the statistical average image below (which is the pre-earthquake scenario).

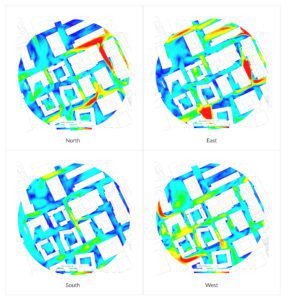
The transient northeast wind graphics below for the pre and post-earthquake illustrate how wind conditions have changed across the CBD. Such studies can be used to inform policymakers and urban planners.
Below are transient diagrams for the secondary prevailing wind direction for Christchurch which is from the southwest. These images show similar wind conditions in The Square, less wind post-earthquake for Hereford St, and more wind post-earthquake for the west end of Cashel Street, which is due to openings to the street area at the southwest end of the street allowing wind to channel into this area.
Meteorology Solutions Ltd. has consistently demonstrated its commitment to integrating meteorological insights into engineering solutions. Experts like Mike Green who utilize sophisticated simulation tools such as SimScale, provide valuable contributions to projects ranging from urban design to natural cooling systems. Meteorology Solutions’ innovative approach bridges the gap for utilizing weather analysis in practical engineering solutions, ultimately delivering safer and more comfortable urban environments. Looking forward, Mike and his team want to expand the use of many integrations that SimScale offers including using the NVIDIA Omniverse plugin to create compelling visualizations.

Subscribe to our newsletter
By subscribing you agree to with our Privacy Policy
Product
Solutions
Resources
Sign up for SimScale
and start simulating now