Nowadays, the growing awareness for sustainable, safe, and comfortable urban microclimate associated with the rapid development of accessible flow simulation tools enables civil engineers, urban development project managers, and architects to easily implement wind simulation studies to predict and assess wind conditions early in the design phase, before validation.
The recent feature addition of a multi-direction wind comfort analysis tool by SimScale comes as a significant asset in the flow analysis toolbox for wind comfort studies. This analysis tool, in addition to having a very simple workflow, incorporates the visualization of standardized wind comfort zones computed, allowing up to 36 wind rose-driven directions simultaneously simulated. In order to demonstrate this capability, SimScale hosted a recent webinar where it was explained how to analyze pedestrian wind comfort with CFD simulation autonomously.
This paper addresses the topic of pedestrian wind comfort, from origin and
definition to wind comfort analysis, criteria, and example case studies; all meant to
form an in-depth understanding of the field.
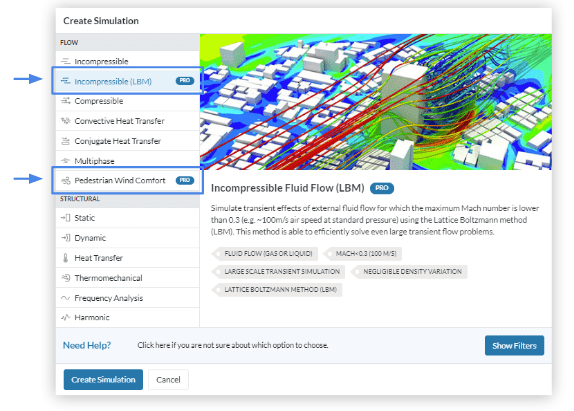
Using SimScale’s Lattice Boltzmann Method (LBM) Solver to Assess Pedestrian Wind Comfort
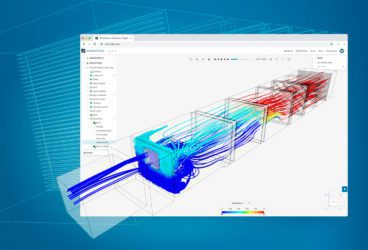
In order to run a pedestrian wind comfort simulation, a solver based on the Lattice Boltzmann method is used. SimScale partnered with Numeric Systems GmbH to give access to this innovative feature through their tool Pacefish®, making it possible to reduce running times for transient simulations from weeks and days to hours and minutes. In addition to giving faster results, the solver works for particle-based ‘mesh-less’ simulations, runs purely on GPUs, and can simulate large-scale models with hundreds of millions of elements. As seen below, the LBM analysis type exists on its own, but in order to run accurate pedestrian wind comfort simulations, SimScale offers a specialized ‘Pedestrian Wind Comfort’ simulation option that utilizes the LBM solver.
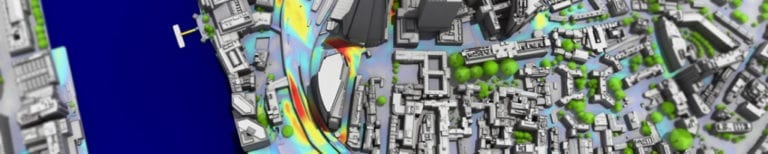
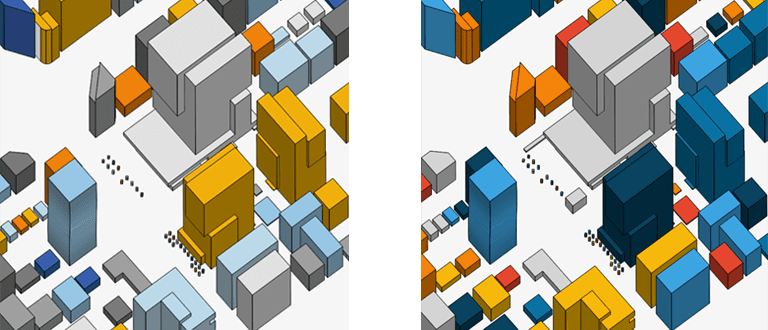
Our Case: Pedestrian Wind Comfort in South Korea
This wind comfort simulation of the Gangnam district of Seoul, South Korea aims at highlighting zones where pedestrian comfort might be at an unacceptable level. For this project, two different models were imported and compared under the same wind conditions. The second model (Design 2) includes two additional blocks structures, as shown in the comparison picture below. The wind comfort maps of the two models can then be compared so that the effect of certain topologies can be understood and consequently, design decisions can be made.
Download our ‘Wind Engineering’ white paper to learn about building design, wind loading implications, pedestrian wind comfort, natural and mechanical ventilation, pollution mitigation, and more!

Simulation Setup
Setting up this type of simulation to analyze pedestrian wind comfort can be done in 3 easy steps once the above CAD models are uploaded.
- First, define the region of interest, namely by positioning and size the cylindrical region of interest. Along with this, define which direction is North.
- Next, import wind rose or select a global location (a feature that will be added soon) and use SimScale’s third-party weather data supplier. Then, choose your engineering standard for the wind comfort criteria definition (Eurocode or Australia/New Zealand standard), and define your wind exposure (or atmospheric boundary layer). The number of wind directions, from 4 to 36 is defined in the wind rose data. For each of these wind directions, you can select a type of wind exposure; open terrain, city center, suburban area, flat terrain, etc. These will influence the profile of the velocity and the turbulence intensity from the ground upward.
- Finally, define the pedestrian region; which is essentially where the location for the wind comfort criteria is to be computed. You can add the location of this map in two different ways. One is to set the height from the ground absolute, defined in the region of interest panel. The other way is to set this height from an existing surface from the geometry usually the terrain surface or a terrace on a rooftop or a balcony.
Simulation Results
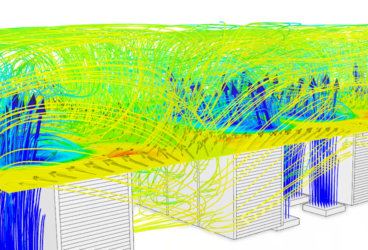
Once the run has gone through, we can access different types of results. The first type is the wind comfort criteria map showing the different levels/categories of comfort for each comfort criteria; Lawson, Davenport, and NEN 8100.
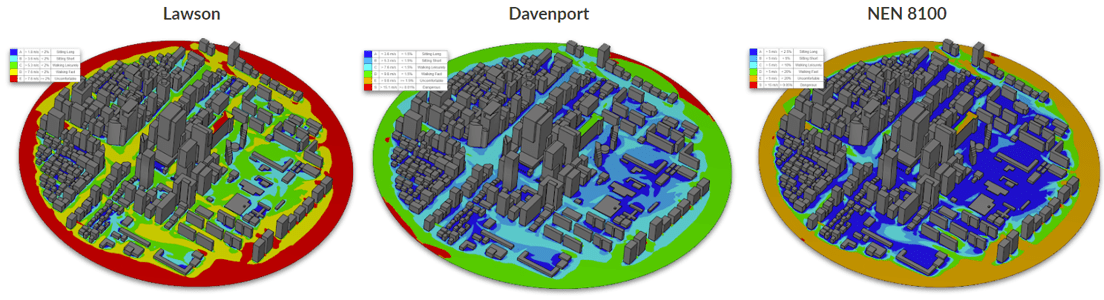
These criteria will take the frequency at which each point the wind is above a certain threshold, and this for all wind directions combined. Other results that can be obtained include the other type of results, consisting of transient velocity, pressure, and turbulence intensity.
For more information, watch the webinar below!
Additional Wind Comfort Resources from SimScale
- SimScale Feature Release: Multi-Direction Pedestrian Wind Comfort Analysis
- How to Assess Pedestrian Wind Comfort in 2019
- Boston Waterfront Weather & Pedestrian Wind Comfort
- Sustainable Wind Engineering: The Stockholm Royal Seaport Project