5 Ready-to-Use Templates for AEC Simulation
The architecture, engineering, and construction (AEC) industry continues to rapidly evolve into a predominantly digital sector. Today, building information modeling (BIM) is becoming a more or less standard practice and allows for much easier collaboration between professionals across all main industries. Computational fluid dynamics (CFD) simulation plays a major role in this.
How Is CFD Simulation Disrupting the AEC Industry?
With a rise in digital twin technology in AEC, the widespread adoption and use of CFD simulation is also moving in the same upward trajectory. Online simulations deliver recurring opportunities to analyze the design of a building along with the internal or external environments in a much easier and more cost-effective way than physical testing. Along with the ability to simulate airflow within an indoor space or HVAC system, CFD offers great advantages for urban planning. For instance, architects, engineers, and urban planners can use fluid flow analysis to visualize wind patterns surrounding a structure and evaluate pedestrian wind comfort in order to adjust its design accordingly.
In order to improve accessibility for architects and engineers of all calibers, SimScale’s platform allows you to sample existing public projects as a basis for your own design. Here, we’ve singled out five excellent examples of fluid flow simulation for AEC which all SimScale users can use templates to copy for their own simulation projects:
1. Pedestrian Wind Comfort Evaluation with CFD Simulation
Case:
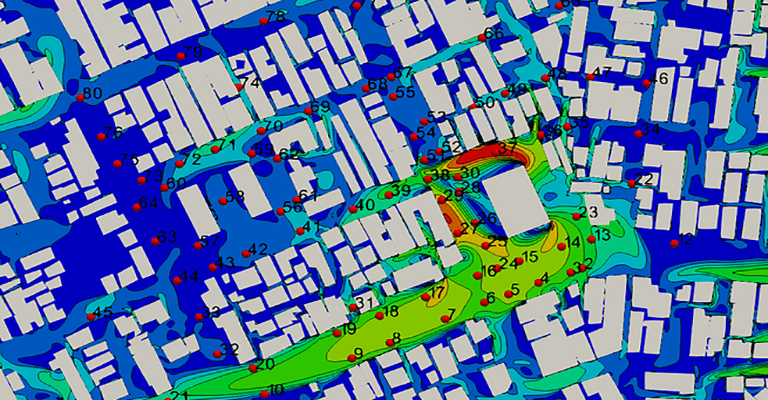
Inner-city landscapes usually include irregular combinations of high-rise structures, condensed low-level architecture, and open spaces. This presents a challenge to any urban planner or architect who must consider pedestrian wind comfort. In this project, a district of Niigata, Japan, is modelled for a wind simulation, to better understand pedestrian wind comfort and detect areas of discomfort in the vicinity. Factors such as velocity, wind load, and wind direction are included in the simulation to reveal valuable insights on wind behavior and the likelihood of vortex shedding or wind tunnels occurring on a pedestrian level.
Simulation:
The original scanned model was converted externally into a valid solid format and the computational fluid domain was then obtained by subtraction. After generating a parametric hex-dominant mesh with manual refinements, both in the surface and surroundings of the buildings, the CFD simulation began. A steady state simulation using a k-epsilon turbulence model was run with a detailed velocity profile at the inlet for velocity, turbulent kinetic energy and dissipation rate. The inlet and outlet conditions were changed as each wind direction was simulated. This case was, in fact, a validation test where the CFD results were compared to experimental results delivered by the Architectural Institute of Japan (AIJ). Take a look at further technical details on the simulation here.
Results:
The results of the simulation correlate well with the AIJ data, and show a low velocity in a variety of velocity “slices” (vertical and horizontal cross-sections of the area). There are however some areas where velocity reaches a fairly high relative velocity ratio when exposed to strong westerly winds. These areas should not pose too much of a problem for pedestrians as they exist in zones where building wakes are low. Overall, the results of this case reveal much about wind patterns and pedestrian wind comfort in Niigata, and demonstrate the benefits of online simulation for urban planning.
2. Urban Development CFD
Case:
When a new urban development is proposed, the comfort and safety of residents and pedestrians are paramount, and wind is a huge consideration in this. CFD can be advantageous in the design stage of urban planning to examine and adjust the master plan. If high wind velocities or the Venturi effect is detected in areas intended for recreation and high foot traffic, urban planners need to find ways to reduce the impact on pedestrian comfort. In this urban development project, the objective is to use CFD wind analysis to inform the initial stages of design in order to maximize pedestrian wind comfort.
Simulation:
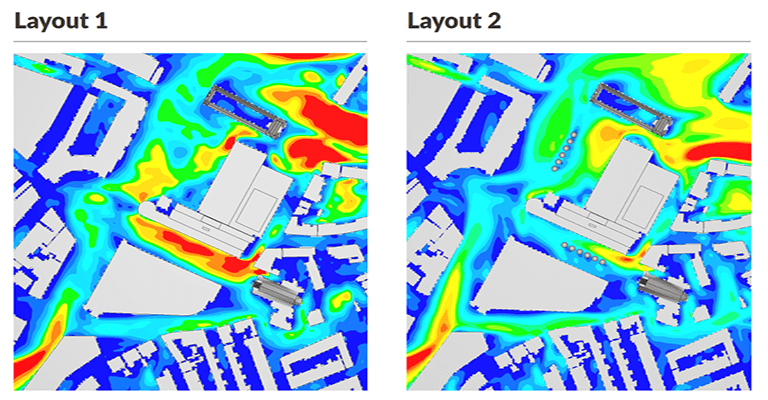
There were two key areas in the design scenario that would be used for recreational use. For a clear and precise analysis, these zones were mapped out in the simulation. The velocity fields were analyzed at 1.75m height; an average height of the pedestrians in the area. Initial results depicted a clear presence of the Venturi effect, with velocities dramatically increasing to around 15m/s in the channels between the buildings. These results signaled a need to adapt the design to lessen the blow on pedestrian comfort.
Results:
A simple inclusion of vegetation in the area is an ideal solution. By including a row of trees in the two zones of interest, velocities caused by the Venturi effect are greatly reduced. The new simulation featuring the rows of trees shows a positive influence on pedestrian wind comfort which can be seen in a comparison with the initial design.
Download our ‘Tips for Architecture, Engineering & Construction (AEC)’ white paper to learn how to optimize your designs!

3. Seaport Boston: Wind Analysis for Pedestrian Wind Comfort
Case:
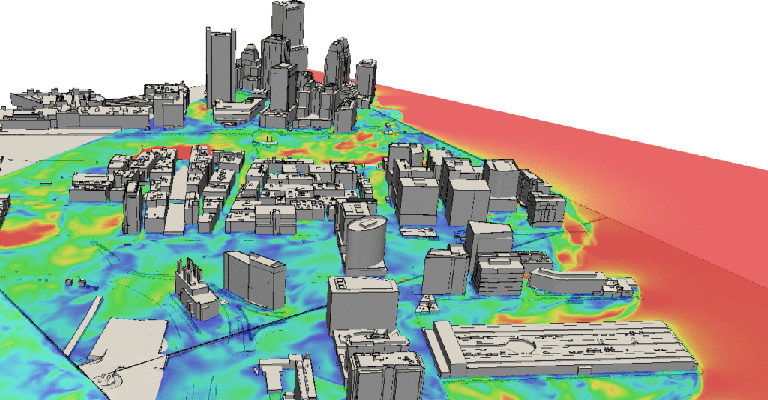
Pedestrian wind comfort is an issue for just about any port town as ocean winds blow directly onto buildings, structures, and pedestrians on the seafront. As wind rushes into the city, poor structural design and urban layout can even increase wind velocity and turbulence as a result of the Venturi effect. This simulation evaluates wind patterns in Boston, Massachusetts, to detect problem areas such as where wind velocity reaches uncomfortable highs or wind tunneling occurs. In addition, three bridges in the test area receive heavy foot traffic on a daily basis. Simulating wind patterns and could show whether the city’s architectural composition is affecting pedestrian wind comfort on these bridges.
Simulation:
For this simulation, an architectural sketch of the area from SketchUp was transformed into STL format. Geographical information system (GIS) data including wind speed and wind direction were obtained from Boston Logan Airport and combined with assumed wind height and aerodynamic roughness to calculate the atmospheric boundary layer. This was inputted into the simulation and slip boundary conditions were applied to surfaces. For this simulation, a lattice Boltzmann method (LBM) provided sufficient meshing over the entire region, eliminating the need to mesh and refine each structure individually. Minimal mesh refinement was required which was entered as a 2m target resolution in a vertical region of between ground level and 8m.
Results:
The simulation run reveals how the wind enters into the seaport in a uniform way, but channels of high turbulence occur as soon as it hits the buildings on the seafront. In some areas, wind velocity fluctuates between around 7 and 14m/s, a huge range which would greatly impact on pedestrian wind comfort. Unsteady flow as the wind rushes up past buildings and through alleyways demonstrates the clear presence of the Venturi effect.
For a detailed explanation of this project and the benefits of using an LBM solver make sure to check out this SimScale webinar recording.
4. Gangnam District: Pedestrian Wind Comfort
Case:
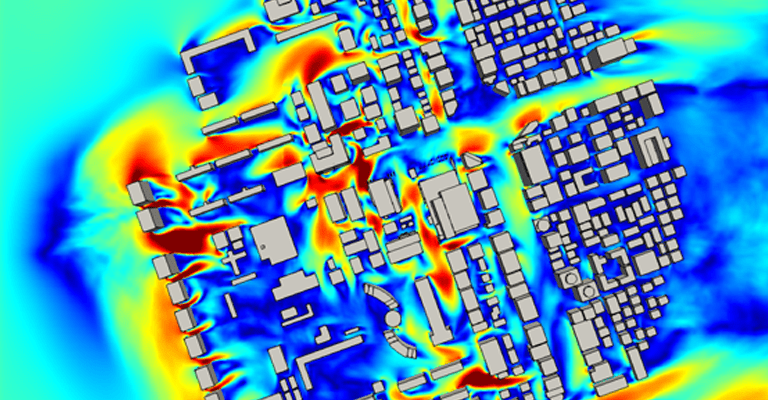
In this wind comfort study of the Gangnam District in South Korea, the key aim is to assess how two new buildings will impact wind patterns in the surrounding area. By simulating the flow surrounding the structures, conclusions will be drawn regarding pedestrian comfort levels. An impressive factor of this case is its sheer size, as it includes a 1600 x 2000 x 800 m3 computational domain with a grid of 97.5 million cells.
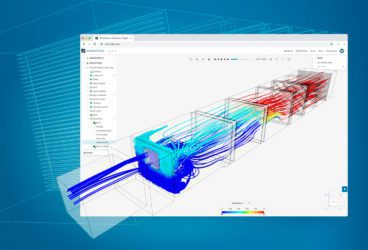
Simulation:
One wind direction was chosen for this project, coming in at 180 degrees (from the South). The LBM solver makes life easier when it comes to meshing. This is because only a mesh lattice is required, rather than a well-resolved conformal mesh used in conventional CFD methods. SimScale provides an intuitive workflow for setting up a quick lattice mesh. Using SimScale’s LBM solver made it easier to quickly generate a lattice mesh for the domain. Refinements are needed to only be applied at the pedestrian level and to specified regions of interest relevant to this case. As a transient analysis, time-dependent variables such as velocity, pressure, and turbulence quantities were necessary inputs. A no-slip wall boundary was applied to the building surfaces and ground, and the terrain was considered to be flat.
Results:
CFD contouring reveals increased velocity and accelerated flows at all building wakes. As the wind passes through channels and interacts with buildings, periodical gusts of wind occur. Passage jets between parallel buildings and corner acceleration escalate wind speeds to 20m/s at knee level. Overall the simulation reveals that the buildings in this area negatively impact on wind comfort for pedestrians.
5. CFD Simulation of Mountain City
Case:
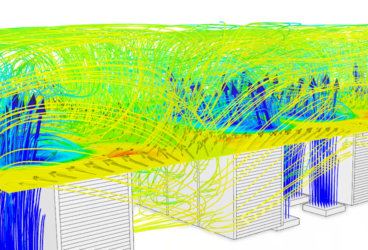
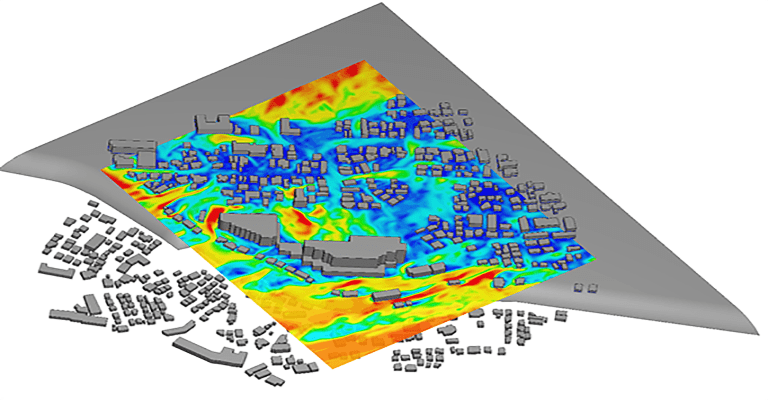
The geographical properties of this urban area pose a few challenges to pedestrian wind comfort. In addition to its location on the coast, where strong ocean winds enter from one direction, the terrain is uneven and one section of the urban area is raised above ground level. There is also a large building situated on the edge of the raised ground level. Each of these factors has the potential to negatively affect wind comfort which should be seen in the results of the simulation.
Simulation:
For this simulation, two directional flows were tested, representing winds entering from the seaside and landside of the city. For the landside wind, a fixed magnitude of 10m/s was chosen, but for the seaside analysis, this figure was increased to 20m/s as ocean winds are generally stronger in this area. Wind height was inputted as 2m to give an overall indication of wind comfort at a pedestrian level. The LBM solver with an incompressible LBM was a key benefit to this wind experiment, saving the project engineer a huge amount of time.
Results:
While the results of the landside wind test show low velocity and therefore a generally good level of pedestrian wind comfort, stronger wind forces entering from the seaside cause some concerns. As predicted, the large building, modeled in blue in the simulation, does cause channeling as a result of the Venturi effect. As wind enters the urban development from the ocean and comes into contact with the building, increased velocities can be seen as wind passes through and around the structure. The simulation results show that as stronger winds enter from a seaside direction, the large building disrupts airflow causing pedestrian wind comfort to be relatively poor in certain areas, with velocity reaching 24m/s or more.
We hope this article has inspired you to get going with your own AEC-related CFD project, which you can easily do using SimScale’s public project templates.