Air is a high-speed transportation agent, making airborne infectious diseases like tuberculosis fast-spreading and dangerous. In a stagnant environment, droplets produced by various respiratory activities can travel vast distances of up to 6 meters at a velocity of 50 m/s (sneezing), 2 meters at a velocity of 10 m/s (coughing), and 1 meter at a velocity of 1m/s (breathing). This distance can be increased or distorted if the surrounding air is in motion.
In the event of a tuberculosis patient needing hospitalization, the person is placed in a controlled facility called an isolation room. Unlike other isolation rooms, an airborne infection isolation room (AIIR)—also referred to as a negative pressure room—needs to be negatively pressurized. This is where computational fluid dynamics (CFD) tools play an essential role. Experimentally assessing room pressurization and airflow patterns can be difficult at the early stages of the hospital layout design. Employing CFD allows HVAC engineers to virtually investigate the airflow patterns and use them to inform subsequent design optimizations, which are necessary to comply with ASHRAE Standard-170 guidelines.
Air Pressure Simulation Negative Pressure Room Ventilation Design Optimization with CFD Simulation
The performance of a negative pressure room (or an AIIR) is determined by the concentration of infectious droplet nuclei in the air. Achieving a lower concentration of pollutants means a safer environment for healthcare workers and other patients in the facility. When it comes to the overall performance of a naturally ventilated isolation room, multiple factors such as geographical location, wind speed, room layout are all significant factors at play.
For the purpose of this study, let’s consider an isolation room located relatively at moor position. The sloppy terrain forces the wind to flow downstream from the mountains, at a mean wind velocity of 1.8 m/s.
The negative pressure room would face the wind direction, which would allow the wind to enter the isolation room through the windows. The surroundings, densely populated with trees and buildings, would create a porous medium, reducing the wind velocity to 0.12 m/s near the window of the negative pressure room. This will have a major impact on the airflow pattern in the room and is an important consideration for the designer.
This project with SimScale illustrates the benefits of using CFD simulation to investigate the overall performance of the AIIR facility and the transmission of infection from the patient throughout the negative pressure room. It will also help us identify the critical pollutant concentration and visualize the flow path that the infection follows by using the wind entering the window as a carrying agent.
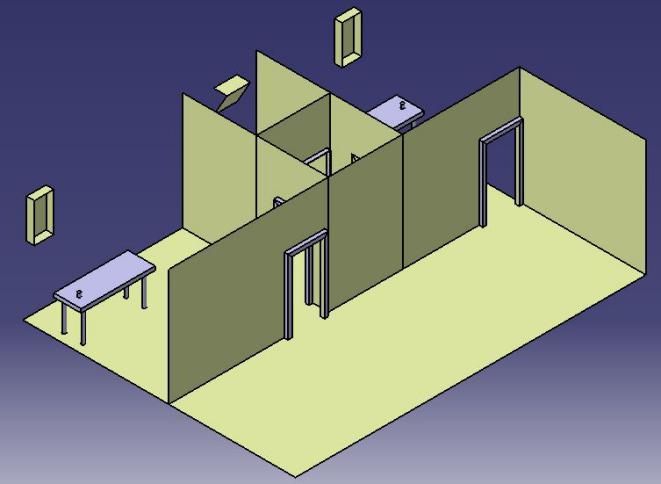
Air Pressure Simulation Geometry Modeling
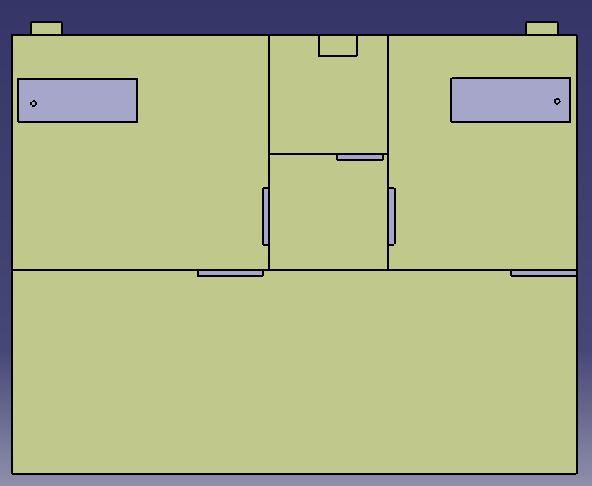
The multiple-bed patient room and the negative pressure isolation room are separated by a three-meter-wide corridor. The airborne infection isolation room (AIIR) is paired with another isolation room of a different size. This configuration allows a shared bathroom for the two isolation rooms. The first isolation room has the dimensions of 4.08m* 3.7m *3m, while the second one is 2.95m *3.7m *3m. The AIIR should maintain its negative pressure as if the door is open. This is why, for the purpose of this analysis, the doors were considered to be open. Using this data, the 3D geometry for the analysis was modeled. For a quicker and more robust simulation, the model was simplified.
Air Pressure Simulation Entrance Airflow Measurements
The main windows in the first and second airborne infection isolation room always remain open, providing a source of natural ventilation. The TESTO-435 digital airflow meter was used to measure the outdoor air supply from each window. The velocity measurements were recorded every second for a period of 30 minutes, measuring a mean velocity of 0.12 m/s. The time-averaged values of the obtained measurements are used as initial conditions in the simulations.
Air Pressure Simulation Numerical Analysis
Since this project investigates the mass transportation of the infection, the passive scalar transportation analysis type was used. The concept behind this analysis is that the particles transported within the incompressible flow do not affect the flow.
Air Pressure Simulation Boundary Condition
To construct a numerical grid and carry out the analysis, the 3D model of the isolation room was imported into the SimScale platform in .step format. The 3D model discretizes using a parametric Hex dominant mesh creator. The mesh contains over four million 3D elements measuring 0.002 m × 0.002 m ×0.002 m each. It also contains a local refinement at the boundary condition.
The boundary condition is used in the simulation to represent the phenomenon under investigation, such as a large fresh-air inlet and infection mixture outlet found in the airborne infection isolation room. The outdoor air was assumed to enter through the main windows (W1) and (W2) into each isolation room at a mean velocity of 0.12 m/s. This fresh-air inlet is considered to be free from airborne infection pathogens. The infection mixture was assumed to travel through the corridor via the outlet.
Air Pressure Simulation Modeling Infection
In this project, a person with tuberculosis exhaled air modeled as infection. The total lung capacity (TLC) is the maximum amount of air in the lung after a full inhalation. For men, the average TLC is 6000 ml, whereas for women it’s 4200 ml. The functional residual capacity (FRC) is the amount of air left in the lungs after a normal exhalation. Men retain about 2400 ml on average, while women retain 1800 ml. Residual volume (RV) is the amount of air left in the lungs after a forced exhale—the average RV for men is 1200 ml and 1100 ml for women. The vital capacity (VC) is the maximum amount of air that can be exhaled after a maximum inhalation. Men tend to average 4800 ml and women 3100 ml. The amount of VC was modeled as infection for this numerical analysis.
Air Pressure Simulation Simulation Results
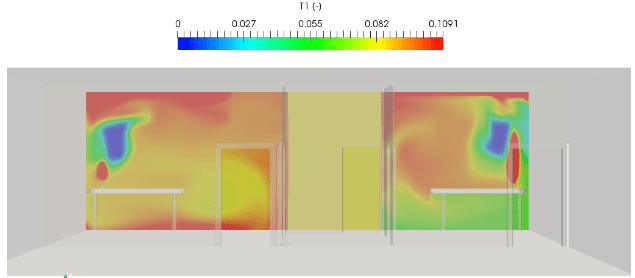
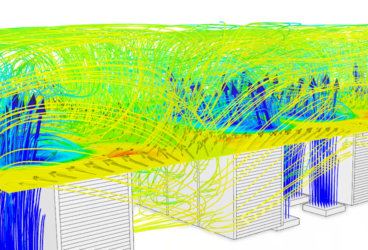
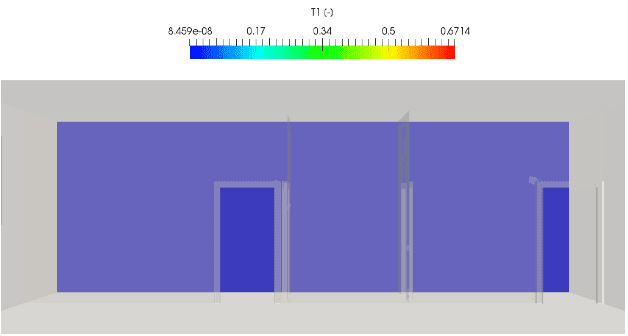
Slice filter scalar field 1 meter away from the window
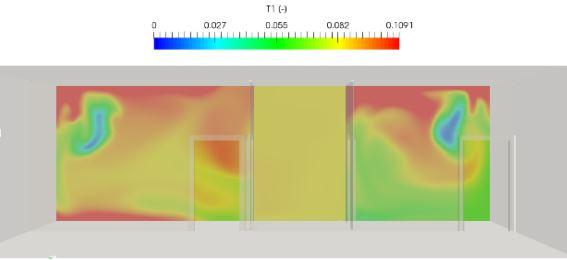
The CFD simulation results reveal that the airborne infection isolation room becomes positively pressurized relative to the corridor due to the entrance of air from the window. This air behaves as an active carrying medium that carries the infected air from the room to the corridor. There is still over 10% infection concentration two meters away from the patient. This would make the design unsafe for healthcare workers and patients in other spaces. We can conclude that the design requires a modification.
Air Pressure Simulation System Design Improvement
In the previous section, we discovered that using wind for ventilation would not be the best strategy. Just having a potential wind velocity deems it unreliable ventilation use, and other factors must also be taken into consideration.
To solve this problem, a mechanical system has to be introduced. The proposed solution is to integrate a mechanical system into to the isolation room with an exhaust fan that is sized to achieve a minimum of 12 air changes per hour, as recommended by ASHRAE’s healthcare facility ventilation standard. Using the room volume, the suitable exhaust fan capacity was calculated to be 317 CFM (cubic feet per minute) and 233 CFM for the airborne infection isolation room 1 and 2 respectively. A 550 CFM supply fan is introduced to the corridor. To avoid the impact of wind on the new system, the windows will be sealed. After modifying the geometry to incorporate these adjustments, it was uploaded to the SimScale platform and the simulation was carried out.
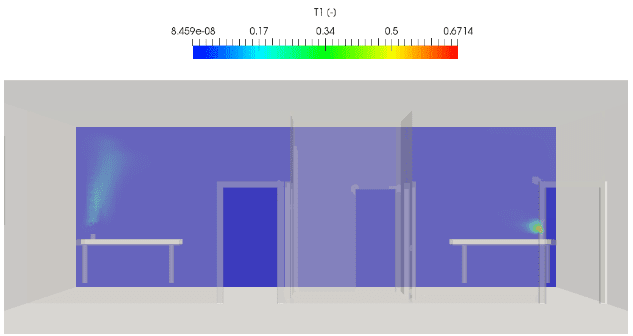
As we can see from the newly obtained results above, we were able to reduce the infection concentration to almost zero with the configuration, making it safe for healthcare workers to tend to the patients.
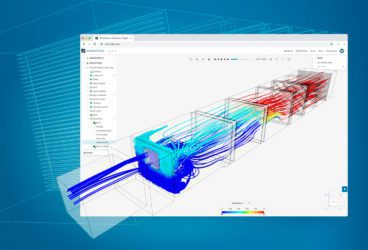
Download this free case study to learn how the SimScale cloud-based CFD platform was used to investigate a ducting system and optimize its performance.

Conclusions
Healthcare-associated infections (HAIs)—the infections that patients can get while receiving treatment in a medical facility—are a major threat to patient safety, yet they are often preventable. On any given day, about 1 in 25 hospital patients in the United States has at least one healthcare-associated infection [1]. A properly designed negative pressure room (or airborne infection isolation room) is one of the most effective ways of minimizing the risk of an epidemic.
Since the consequences of a poorly designed isolation room ventilation system can be dire, relying on intuition or hand calculations alone is not enough. CFD simulation is emerging as the go-to tool for HVAC engineers, helping them comply with the ASHRAE guidelines on ventilation requirements for healthcare industry facilities and ensuring their safety through online air pressure simulation. The above project created with SimScale was a simple illustration of how CFD can be applied to the design process of a negative pressure room, helping identify a design flaw early in the process.
Learn how to set up your own simulation in a webinar about cleanroom design optimization. Just fill out this form and the recording will play automatically.
References
- Magill SS, Edwards JR, Bamberg W, et al. Multistate Point-Prevalence Survey of Health Care-Associated Infections. New England Journal of Medicine 2014