We spend a large part of our time in indoor environments; our home, work, social activities, and errands are mostly inside. This was true even before the pandemic we are currently facing, which, of course, has undesirably pushed this time to the maximum.
Spending so much of our lives in buildings has made it necessary that the thermal environment and indoor air meet certain occupants’ standards. And actual official standards, i.e., ASHRAE 55, EN 15251, EN 16798-1:2019, ISO 7730, ASHRAE 62.1, have been put in place for architecture and engineering projects.
Comfort and air quality are the main topics for building designers, as they have a direct impact on wellbeing, productivity, and even more importantly, health and safety. From residential buildings, commercial spaces, schools, and offices where thermal comfort is a top priority, to factories, clean rooms, and underground parking garages where indoor air quality, contaminant removal, fire safety, and smoke management are obligatory, building designers know that heating, ventilation, and air conditioning (HVAC) is their best friend.
A recent news story about how important an HVAC system is that the Internet community found it hard to believe at first is that of a Malaysian cinema and luxury leather goods found covered in mold after a two-month lockdown due to the COVID-19 pandemic. The significant financial loss that resulted would have been avoided if the air conditioning hadn’t been turned off.
As unfortunate as this incident was, however, the negative effects on comfort and health that poor ventilation has are much more common and concerning.
What Influences the Thermal Environment?
The thermal environment is affected by temperature (of air as well as surrounding surfaces), humidity, and airflow rate. A satisfactory indoor air is characterized by comfortable room temperature, proper humidity, cleanliness, and freshness.
As defined by ASHRAE 55 and ISO 7730, thermal comfort is “a condition of mind which expresses satisfaction with the thermal environment and is assessed by subjective evaluation”. In HVAC design, thermal comfort is measurable via predicted mean vote (PMV) and predicted percentage of dissatisfied (PPD) calculated for a given space. More about them you can read in this blog post: What Is PMV? What Is PPD? The Basics of Thermal Comfort.
The following simulation project aims to serve as both an example case and a guide for investigating the thermal environment and indoor air quality for a building.
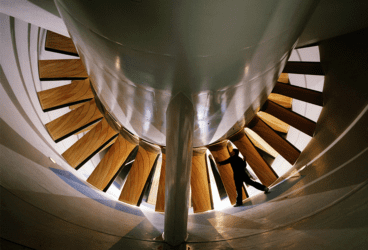
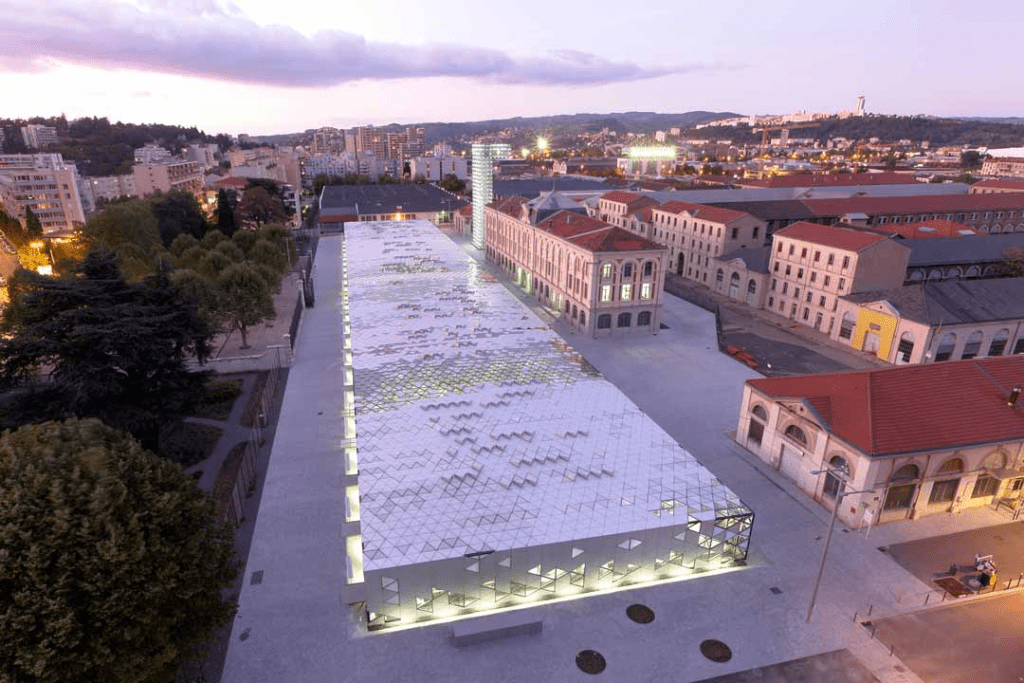
HVAC Case Inspired by Cité du Design in Saint-Étienne
This project is an example of how useful computational fluid dynamics (CFD) simulation can be for early-stage HVAC design. The CAD model used is an exhibition hall, inspired by the Cité du Design building located in Saint-Étienne, France.
The building comes with several challenges that HVAC engineers had to overcome in order to ensure proper indoor air. Its walls and the main part’s ceiling are entirely made of glass and steel tiles. In the absence of a suspended ceiling, the classic approach of placing diffusers couldn’t be undertaken. Hence, the engineers had to come up with a bespoke solution in order to guarantee an acceptable indoor air quality and a suitable level of thermal comfort for the occupants.
This also means that the amount of solar radiation that the exhibition hall is exposed to is significantly higher than a classic space surrounded by opaque walls and ceiling. This radiation effect will play a strong part in the amount of heat that is introduced to the HVAC system, and, in a room filled with many objects and complex shapes, it is generally a very difficult task to quantify with traditional methods.
Traditionally, HVAC design processes include selecting an air change rate (ACR) corresponding to the type of room, defining a number of diffusers, and calculating the spacing between them so that their throw and drop values would suffice to cover the specified areas. The air intakes would also have to be conveniently located to prevent stagnation of air, excessive recirculation, and hot spots.
While defining an ACR is still relevant in the present case, the classic approach of selecting and locating diffusers from a generic manufacturer couldn’t be applied here and therefore a unique design approach had to be undertaken.
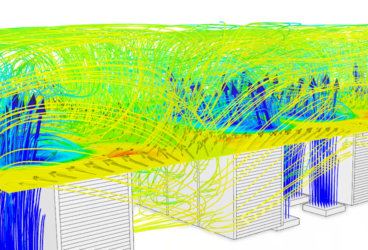
The exhibition hall is thus equipped with floor diffusers, and air intakes have the form of 3.8 meters-high chimneys, located on the four corners of the rectangular room. In the summer conditions scenario presented below, the cold air stream would be inserted from the diffusers, and then the intakes chimney would collect the heated air.
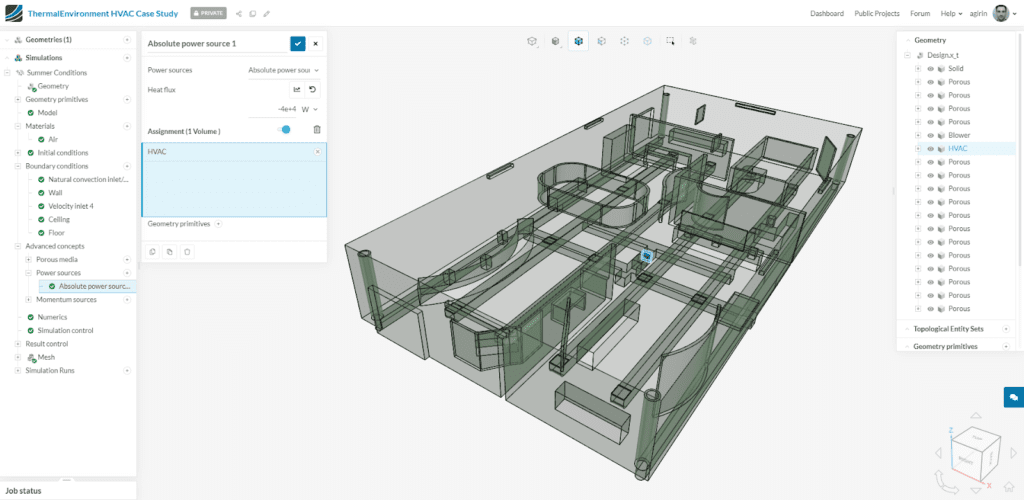
The CAD model simulated also includes a simplified representation of the ducting system placed between the air intakes and the floor diffusers. A cooling unit and a blower effect can be simulated by simply assigning certain zones of this ducting system to a momentum source (a fixed velocity) and a power source.
This simulation strategy brings several advantages when assessing the thermal environment and indoor air quality. Firstly, the cooling requirement for the whole system could easily be defined, including the power required to cool down the outdoor air introduced in the exhibition hall. This cooling power requirement, coupled with the mechanical ventilation power, is important when qualifying a building for green certifications such as LEED or BREEAM. Secondly, simulating the entire duct network would give interesting clues on the utilization of the different diffusers and air intakes. In other words, how even is the flow distributed among the diffusers and the air intakes, and does this impact the temperature distribution and therefore the thermal comfort of the exhibition hall’s visitors? Lastly, the closed-loop airflow will highlight with a pressure drop that is essential to quantify when assessing the power requirement for such a cooling system.
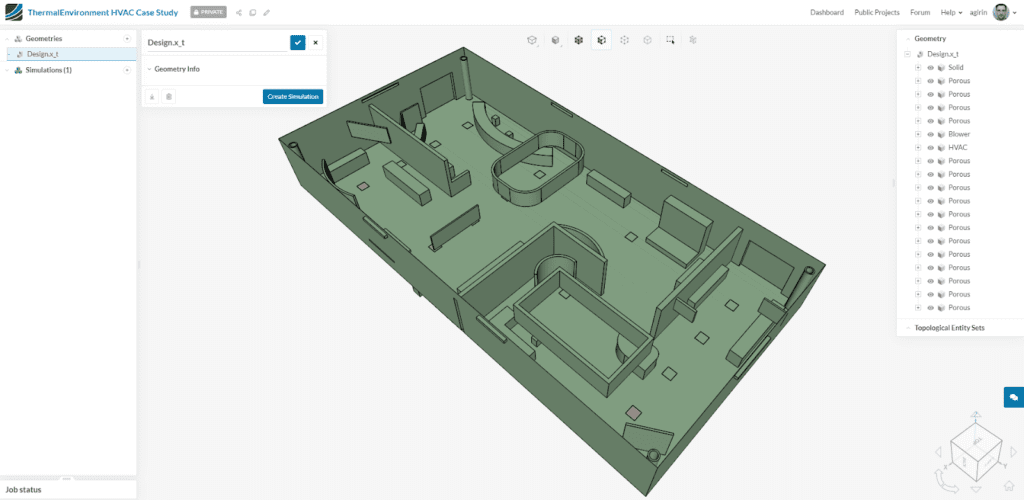
CFD Simulation Steps
The simulation starts with importing the 3D model of the exhibition hall and its ducting system. The model also includes the major furniture pieces that an exhibition hall can host—podiums, signposts, desks, chairs, separation walls, and freestanding posters.
The hall is 15x30x4m, and the ACR is selected to be 5, which defines the amount of air to be blown into the room to about 9500m3/h, with 500m3/h of outdoor air introduced. As with many HVAC designs, the excess air will escape through various openings, typically through the doors or smaller gaps in the ceiling joints.
The diffusers located on the floor are imported as simple block volumes and the simulation setup will enable us to assign these volumes as perforated plates, with a specific free area ratio.
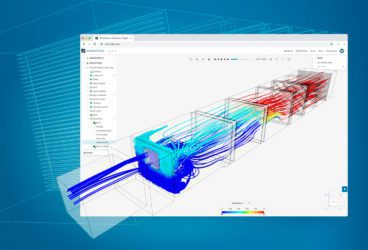
This is a very useful feature brought by the online CFD platform used in this project (SimScale), allowing it to work with simple geometries without compromising on accuracy and relevance. The number of diffusers is 16 (four rows of four diffusers ) so that, for the given overall flow rate, the velocity at each individual diffuser is not higher than 0.8m/s, as recommended by the ASHRAE 55 standard.
The walls, ceiling, and floor of the exhibition halls are defined for the simulation so that they take into account a certain value for thermal insulation, called the transmittance value (or U-value), the outdoor air temperature (30°C/ 86°F) and the external convective heat transfer coefficient (how much heat can be transferred at this surface). Last but not least, a value for diffuse solar radiation is assigned for the ceiling only, as the simulation replicates a worst-case scenario of a summer day at noon, with a typical value of 713W/m2.
The presence of large transparent surface areas in the model will make the radiation component a very strong heat transfer mechanism, a factor very challenging to approximate without CFD simulation.
To evaluate the cooling requirements for this hall, a starting value of -6800W (negative because heat is removed from the system) is set. This is an analytically calculated value, without the radiation component. This cooling value can be then readjusted for a new simulation run after consulting the temperature and thermal comfort results. The thermal comfort metric used for this project is the predicted mean vote (PMV), which gives scales from -3 (occupants feeling cold) to 3 (occupants feeling warm). It is a sensation value based on several factors including the temperature, airspeed, humidity, mean radiant temperature, metabolic rate, and clothing of occupants.
Lastly, some quantities such as temperature and velocity at particular locations (center of the room, inlet ducts, and air intake chimneys) can be recorded throughout the simulation iterations so that the convergence of the computation can be confirmed, ensuring that the results are accurate and the numerical stability of the solution is reached.
Results
The right amount of cooling power necessary to maintain an acceptable thermal comfort value was found to be -40000W, and the PMV contour maps are shown below.
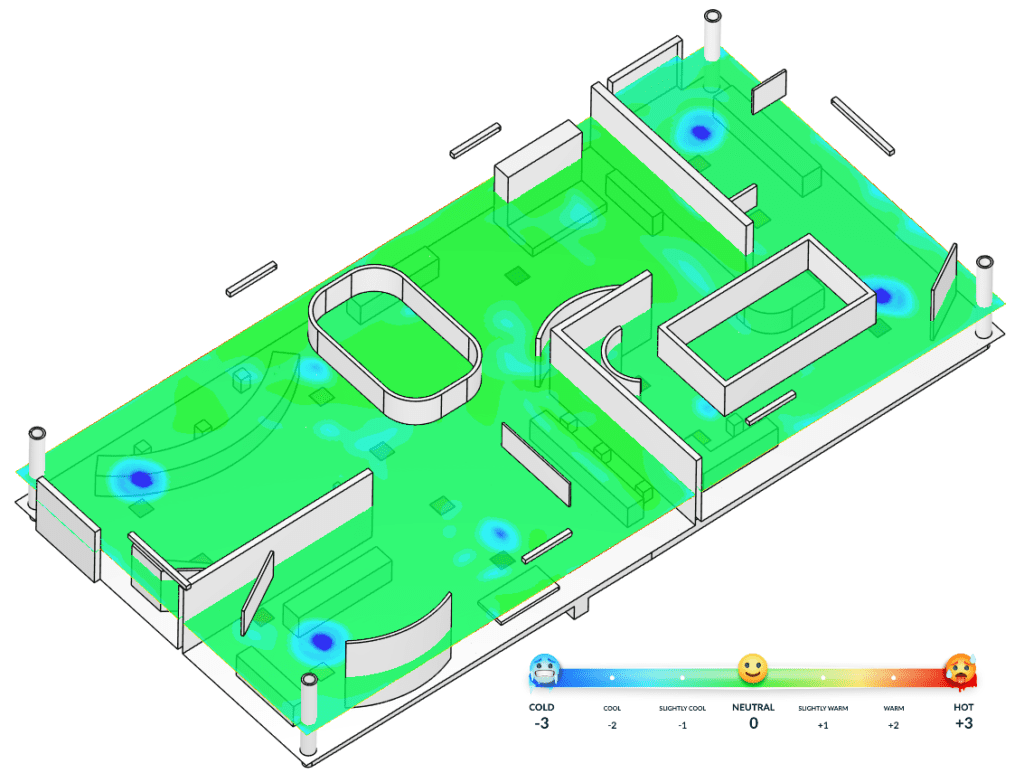
Due to the specific arrangement of furniture and diffusers, one can observe lower PMV values above the diffuser locations because of the higher velocities at the diffusers impact the PMV values negatively. Overall, the PMV values are within the recommended range specified by ASHRAE 55.
The temperature contour map at 1.5m height indicates hotspots in the center of the hall with regions about 1°C above the average temperature of 21.65°C at this height. Cold spots corresponding to the location of the most utilized diffusers are mainly located in the corners of the exhibition hall, close to the air intake chimneys.
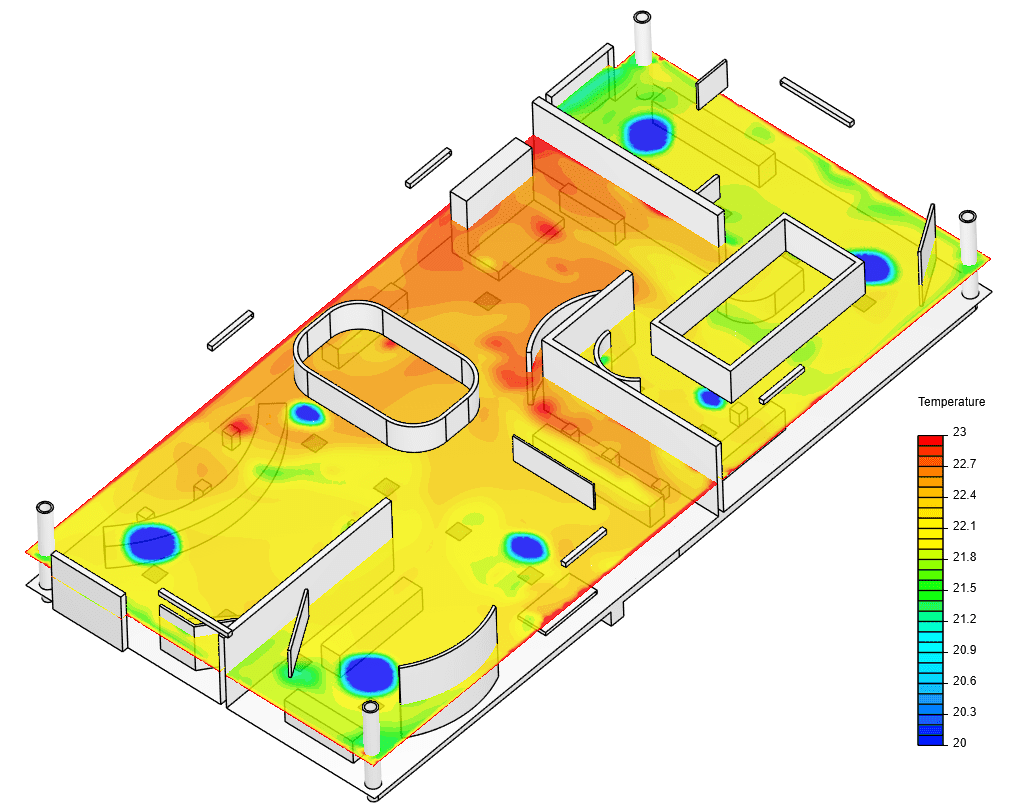
In practice, the opening of diffusers can be individually changed in order to achieve higher temperature homogeneity.

The mechanical power required to maintain the previously defined air change rate can be quantified through the pressure drop across the blower zone shown below and the velocity assigned to this same zone.
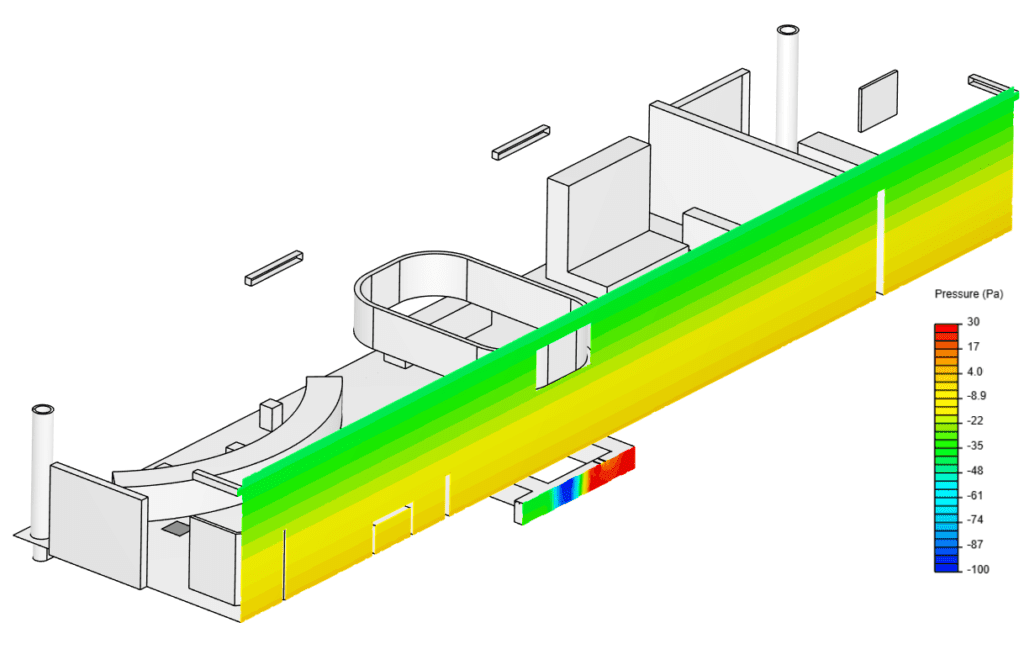
The pressure drop observed is about 130Pa and the flowrate is 2.64m3/s which gives a mechanical power for the blower of about 243Watts.
Conclusion
Testing the thermal environment and assessing the performance of an HVAC system through CFD simulation brings many valuable insights into the design process, especially with bespoke designs, where the configuration of a space is unique and therefore traditional HVAC design methods cannot be employed.
One can easily quantify the cooling and mechanical energy expenditure of the building under specific conditions, an essential metric to select the right HVAC equipment and qualify any new construction for a green building label.
The project described in this article demonstrates that such CFD tools contribute not only to determining this value, but also confirming that an acceptable thermal comfort of occupants is met. The complexity brought by furniture and other obstacles in the room resulted in uneven temperature distribution, even if the PMV values for thermal comfort were within range according to ASHRAE 55.