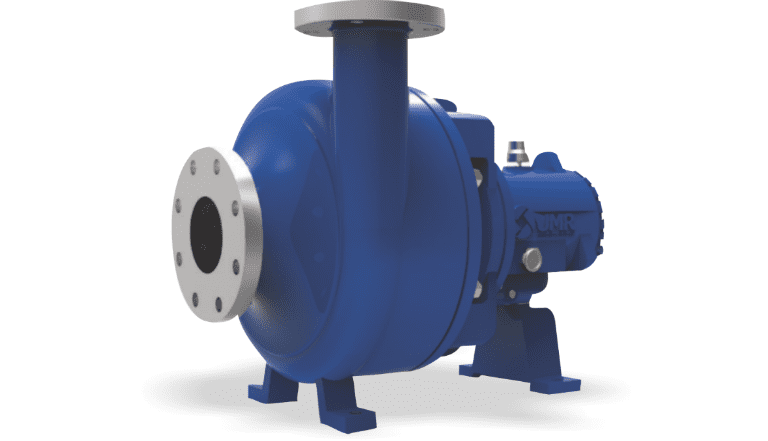
A centrifugal pump is a very simple device, mechanically. Reading the centrifugal pump curve, however, is a different story. It consists of an impeller that is attached to a shaft which is rotated by a driver, most often by an electric motor. With the exception of the shaft and bearings, there is essentially one moving part. The behavior of the liquid under the influence of the impeller can get complicated, so once the pump design is finished and a prototype is built, it goes to the test pit to gather the data needed to plot a pump performance curve.
Each pump is as unique as a fingerprint, each with its own unique properties. The designer has a specific mission for each unit he/she creates. Years ago, at a major pump factory, one such designer was putting the finishing touches on his drawings for a very large unit. He sat for two days staring at his design before finally deciding to add a slight curve to the trailing edge of the impeller vane.
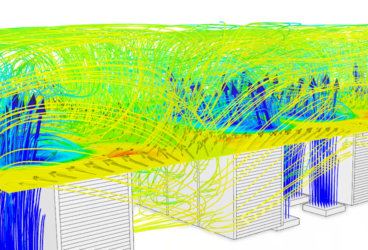
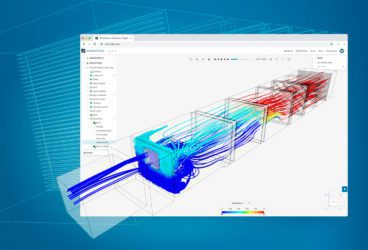
Today, he might have used SimScale—a powerful simulation software that works 100% in the browser—to evaluate his choices.
The pump performance curve contains a wealth of information which when properly read, can ensure a successful operation. In addition to confirming that the selected pump is capable of producing the specified duty point, the centrifugal pump curve discloses a lot of information about its suitability for the application, which is reviewed below.
- Efficiency
- Horsepower requirement over the full range of the application
- Suction requirements
- Safe operating range
- Effect of speed
The image below illustrates a typical centrifugal pump curve out of a pump catalog. This has been selected to meet a 350 gallons per minute design requirement.
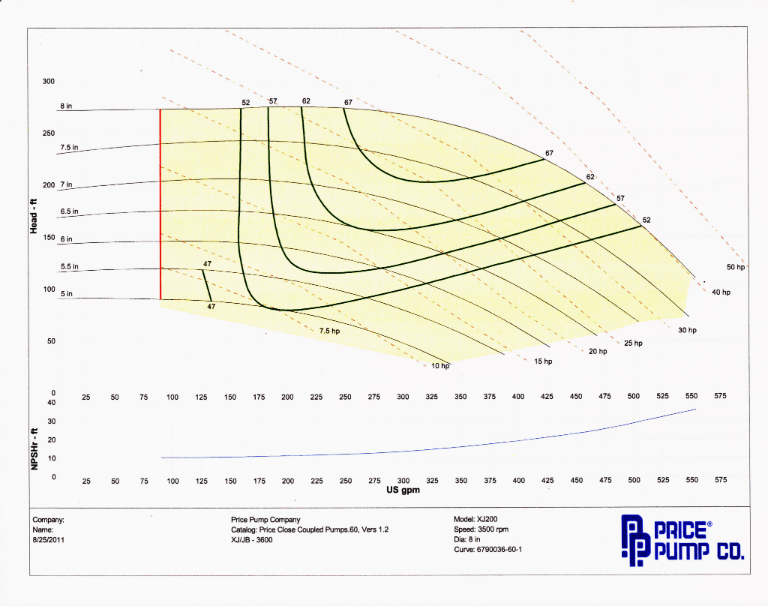
Centrifugal Pump Curve Pumping Head
We will begin with head calculation, referring to Figure 2 below.
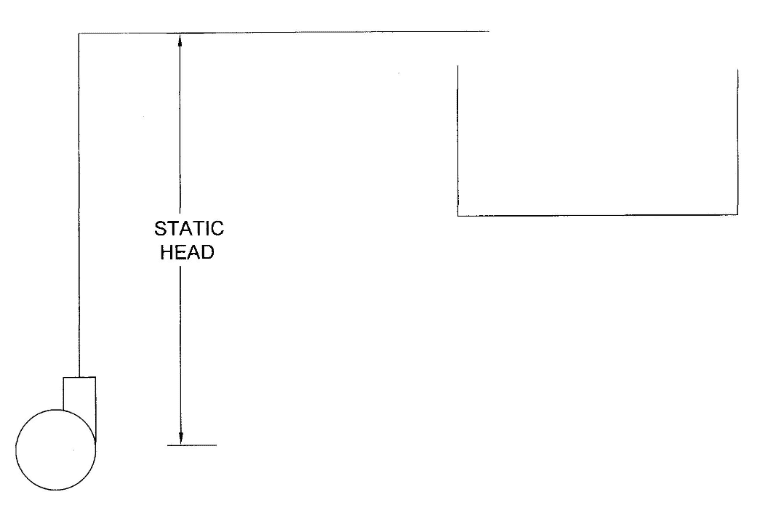
The total pumping head, which is usually stated in feet of liquid pumped, is a combination of static and dynamic components, with the former being the total elevation through which the liquid must be raised and the latter being back pressure generated by the system. Dynamic losses would be pipe friction plus any fittings through which the discharge passes, such as spray nozzles.
If the pump is acting as a system booster or has a flooded suction, then any positive suction pressure would be subtracted from the static head. Velocity head, V2/2g, which would be factored into axial flow pump head calculations with high flow rates and very low heads, is neglected as insignificant in these kinds of applications.
SimScale’s CEO David Heiny tests the capabilities of the platform to solve a real-life engineering problem. Fill in the form and watch this free webinar to learn more!
Pump Efficiency Centrifugal Pump Curve: System Head Curve
For illustration purposes, we will assume a static head of 100 feet and a 200-foot length of 3-inch diameter pipe. We will calculate head and horsepower over a range that surrounds our duty point. The values for friction loss come from tables readily available from any pump vendor.
| GPM | STATIC HEAD | FRICTION LOSS NEW PIPE | FRICTION LOSS OLD PIPE | TOTAL HEAD NEW | TOTAL HEAD OLD | PUMP EFFICIENCY | HP |
| 0 | 100 | 0 | 0 | 100 | 100 | ||
| 50 | 100 | 1 | 2 | 101 | 102 | ||
| 100 | 100 | 5 | 10 | 105 | 110 | ||
| 150 | 100 | 10 | 20 | 110 | 120 | 0.5 | 8.3 |
| 200 | 100 | 18 | 36 | 118 | 136 | 0.6 | 9.9 |
| 300 | 100 | 38 | 76 | 138 | 176 | 0.67 | 15.6 |
| 350 | 100 | 52 | 104 | 152 | 204 | 0.67 | 20.1 |
| 400 | 100 | 68 | 136 | 168 | 236 | 0.67 | 25.3 |
| 450 | 100 | 86 | 172 | 186 | 272 | 0.53 | 39.9 |
| 500 | 100 | 105 | 210 | 205 | 310 | ||
| 550 | 100 | 126 | 252 | 226 | 352 | ||
| 600 | 100 | 150 | 300 | 250 | 400 |
Pump Range Determine Pumping Range
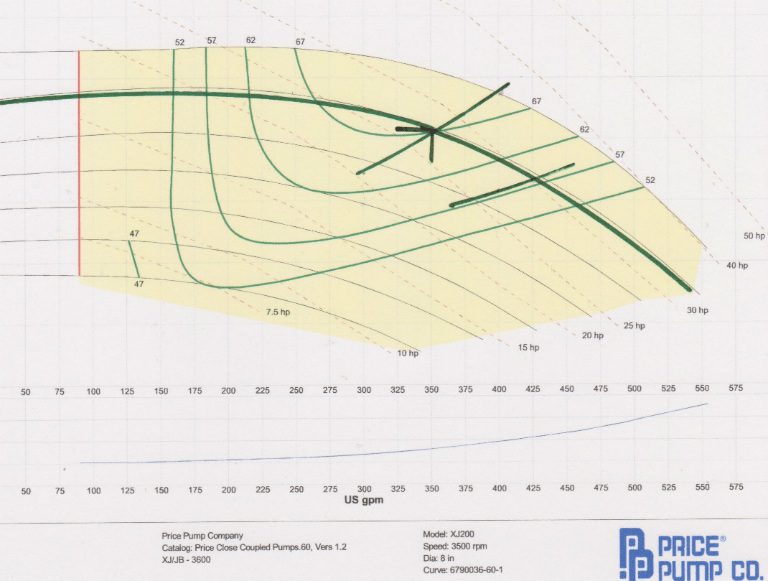
Referring to Figure 3, plotting the old pipe/new pipe intersection points on the centrifugal pump curve shows that we can expect a range of 350 gpm to 425 gpm. Heads at the two points will be 204’ and 175’ respectively. In order to make a driver selection, HP calculation at 350 gpm @204’ TH @ 67% efficiency = 26.9 HP. For the 425 gpm @ 175’ TH @ 57% efficiency = 33 HP.
Even though the 350 gpm at 204’ TH may have been specified as a conservative measure, further examination of the centrifugal pump curve has disclosed a range of possible operating points so that selection of a 40 HP driver would be consistent with a conservative approach.
Centrifugal Pump Suction Conditions
Referring back to Figure 1, the curve at the bottom is an NPSH required curve, referring to Net Positive Suction Head, which is a property for this particular pump design. It is stated as absolute pressure in feet of liquid pumped. The centrifugal pump curve tells us that the NPSH required at 425 gpm = 20’. If the vapor pressure of the liquid is less than 1 atmosphere minus the NPSH required, it will be a suitable application. Using 30’ = 1 atmosphere to be conservative, this pump will handle any liquid at 425 gpm which has a vapor pressure less than 10’. With regard to water, that would be any temperature less than 193 degrees F.
A centrifugal pump operating in a range with insufficient suction head, perhaps due to high liquid vapor pressure or a unit with an NPSH required greater than the system can support will experience cavitation. Under these conditions, vapor bubbles form at the pump suction and implode when the pressure builds as it moves out through the impeller.
This implosion generates enough force that, when left in continuous operation, will erode the impeller to the extent that a hole will be gouged out of the impeller vane. Cavitation is easy to detect because the pump sounds like it is pumping gravel.
Centrifugal Pump Operations Operation At or Near Shut-Off
Zero flow on the centrifugal pump curve is called “shut-off”. Under low-flow and high-head conditions, the centrifugal pump selection is limited, and some care must be taken when operating in this range. This particular pump has a “drooping” curve which means that as it goes back toward shut-off, the head decreases slightly and the vertical red line drawn on the centrifugal pump curve is the recommended minimum flow rate for this unit.
Operating to the left of the red line may cause vibration. As operation moves in the direction of the shut-off point, radial thrust on the shaft increases, shaft deflection increases, and this can cause damage to mechanical seals. Operation in this range may produce a sound like cavitation which is, in fact, cutwater cavitation. The cutwater is an internal point in the volute where liquid pumped either goes out the discharge of is recirculated within the volute.
In low-flow conditions—when the liquid has no place to go—input power to the pump will result in a heat build, which over a long enough period of time, will cause the liquid to vaporize.
Speed Centrifugal Pump Speed
Catalog centrifugal pump curves are plotted for synchronous motor speeds (minus slip). If performance at another speed—such as 50 cycle vs. 60 cycle or variable speed applications—is required, a simple relationship is available for making a special curve plot. Head varies with the square of the speed and capacity varies in direct proportion to the speed. The pump performance curve used in this example illustrates a 50-cycle curve plot derived from 60-cycle performance.
| 3600 RPM PERFORMANCE | 3000 RPM PERFORMANCE | ||||||
| GPM | HEAD | % EFF | HP | GPM | HEAD | %EFF | HP |
| 0 | 249 | 0 | 173 | ||||
| 89 | 255 | 10 | 74 | 177 | |||
| 155 | 255.5 | 52 | 19 | 129 | 177 | 52 | 11 |
| 200 | 245 | 60 | 21 | 167 | 170 | 60 | 12 |
| 250 | 236 | 67 | 22 | 208 | 164 | 67 | 13 |
| 325 | 216 | 67 | 26 | 271 | 150 | 67 | 15 |
| 425 | 174 | 59 | 32 | 354 | 121 | 59 | 18 |
| 512 | 133 | 52 | 33 | 427 | 92 | 52 | 19 |
| 550 | 74 | 458 | 51 | ||||
Applications Non-Aqueous Applications
Most, if not all, published centrifugal pump curves are based upon water with a specific gravity of 1.0. Because these curves are plotted in feet of liquid pumped as opposed to psi, the shape of the centrifugal pump curve and the head and capacity values are valid for the liquid of any specific gravity. Obviously, HP values must be adjusted for the specific gravity and vapor pressures examined to be consistent with NPSH requirement of the pump.
Viscous liquids and material, such as paper stock, can significantly modify pump performance. In these situations, the pump manufacturer should be consulted.
Centrifugal Pump Curve Conclusion
Predicting the behavior of fluids in motion involves reliance on a number of assumptions. Pipe friction loss, for example, relies on an estimate of piping conditions. A conservative system designer will provide flow rates that are, at least, enough.
With a thorough reading of all the information available from a pump performance curve, successful operation throughout the system generated a range of heads and capacities that can be safely predicted. Having checked all the boxes, a system designer who needs to buy a pump can do so with confidence that their selection will perform just as they have planned.
Download this case study for free to learn how the SimScale CFD platform was used to investigate a ducting system and optimize its performance.