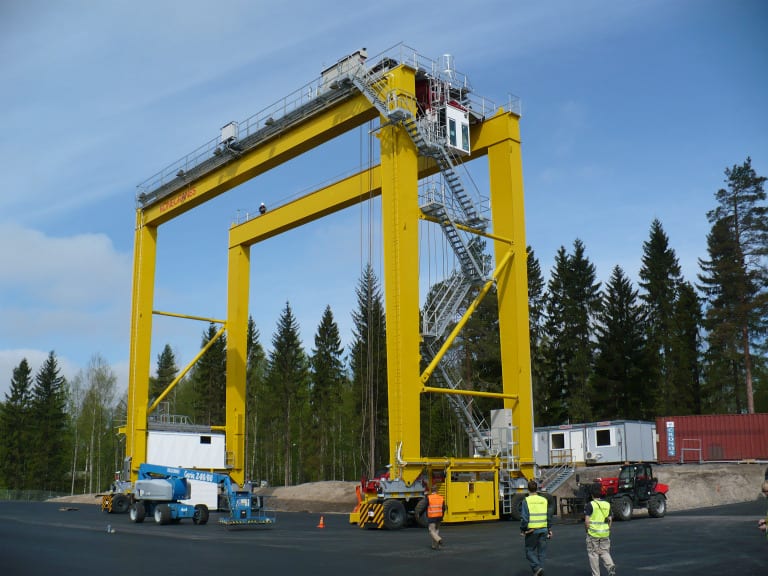
The RTG Crane (Rubber Tyred Gantry Crane, pictured in Figure 1) is a fundamental piece of equipment in any cargo port company. These cranes allow fast stacking, unstacking and movement of containers and similar objects in the port yard. As such, the efficiency and reliability of the RTG crane are critical to meet the port’s performance goals. This is directly related to factors such as lightness, fuel consumption, structural integrity, equipment lifespan, maneuverability and safety of workers, cargo and the equipment itself.
As structural designers, our gold standard is to draft and specify the lightest possible load-carrying structure, while also meeting all safety and performance requirements. The search for lighter structures often drives us to try out new techniques, such as using thin-wall members in skeletal configurations (beam and column) and non-uniform cross-sectional areas of the members, as can be seen in the pictured RTG crane. But this approach makes the structure prone to failure modes other than the basic local or global yielding. One of these failure modes is buckling, which can occur in any of its various forms, which are often described as “sudden and catastrophic”.
For a given RTG crane concept design, our task at hand was to investigate the safety factor against buckling occurrence at the main load-carrying structure.
Brief Theoretical Background
Buckling of load-carrying structures is a phenomenon that has been known and studied for a very long time by physicists and engineers. It is a failure mode related to thin structures loaded in compression. Interest in the study and analysis of long, slender columns in skeletal structural systems arose when they started to fail in strange, sudden and catastrophic ways.
The first approach to the problem comes from the Euler formula, which relates the slenderness of a column with its load-carrying capacity. But for cases with complicated end-conditions, non-uniform cross-sections, and intermediate slenderness, the method loses its accuracy. Other methods—such as the secant formula—circumvent some limitations, but not all of them. Additionally, further failure modes exist, such as lateral torsional, flexural torsional and localized buckling, which are not covered by the classical analysis methods.
So how can the structural engineer have confidence that the structure at hand is safe? Enter the world of finite element analysis (FEA), which is a very powerful technology that helps predict failure modes and safety factors against those modes of failure.
To create a picture of the overall theory, we will make use of a very common example: a guitar string. Think for a moment of the relation between the tension in the string and its stiffness against a lateral load. The more tension there is, the more rigid it becomes—and correspondingly, the more lateral load-carrying capacity. But remove the tension and the string quickly loses its capacity, failing to carry the load. Note that buckling not only occurs in columns but also in any thin structure subjected to compression. Examples of this include pressure vessels subject to vacuum or compression sections of ship structures.
We identify that there is an effect on the rigidity of the body that is related to its stress state. In fact, we assume that this rigidity is proportional to the stress in the member (we will call it geometric stiffness), and that we can add it to the material elastic stiffness, thus finding a total stiffness of the stressed body. But, if the load is compressive, the geometric term starts to subtract from the elastic term until the point where the total stiffness is zero. At this point, sudden failure occurs in the form of a large deformation or, in other words, buckling.
In a finite element model, stiffness is modeled by a rigidity matrix K, and the buckling problem can be stated as an eigenvalue problem:
![]()
Where Ke is the elastic stiffness matrix, Kg is the geometric stiffness (dependent on the stress state), x is a deformation vector and lambda is an unknown scalar factor. We can take the left-hand side term as the reaction force of the body in response to the deformation mode x, and we make it zero so the structure is in a state where it cannot exert any such force. The numerical problem is to search for the factor(s) lambda which satisfies this condition. Note that this factor should be negative and that it corresponds to the safety factor of the structure in relation to the stress state, multiplying the geometric stiffness to reveal the non-trivial x modes.
Typically, the finite elements solver will first solve a linear statics problem to find the stress state. it will then calculate the geometric stiffness and then finally solve the eigenvalue problem for the lambda values and corresponding deformation modes. The user asks the solver either for the lesser n lambda values or for all the values in a given range, if any.
Case Study: Buckling Analysis of a RTG Crane
With all our background knowledge straight, we proceed to analyze the problem at hand. The concept of the RTG crane main structure is depicted as follows:
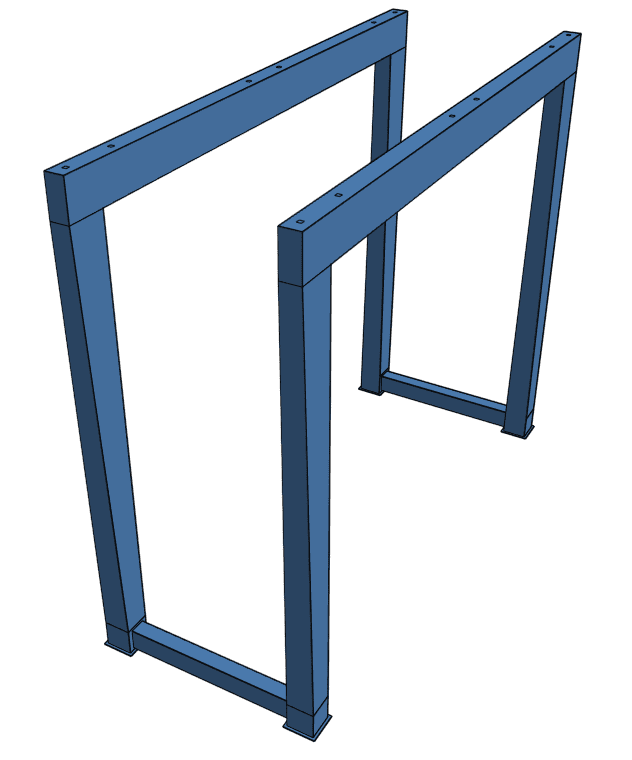
Note the tapering of the column members, which goes in both perpendicular directions. Also, note that the base of the columns is welded, so we cannot assume a pining connection nor a completely rigid one. Thus, classical formulas cannot be applied, meaning we must turn to finite element analysis.
The structure is required to support a nominal load of 50 ton, transmitted through the running beam and its equipment, so we need to also take into account the weight of the running beam. Also, we must consider that the running beam supports over wheels and a rail, the weight of the structure, the different positions of the load, and any lateral load inducing eccentricity.
With these factors in mind, we state the following load analysis:
| ITEM | DESCRIPTION | TYPE | VALUE | CASE 1 | CASE 2 |
| 1 | Own weight | Dead load, constant | 7800 kg/m3 @ 9.81 m/s2 | X | X |
| 2 | Load on middle | Live load, variable | 600 kN | X | |
| 3 | Load on extreme | Live load, variable | 600 kN | X |
As we are dealing in this instance with a mixture of constant and varying loads, we would have to take into account that our lambda factor (explained above) should only apply to the variable loads. Our method of analysis and solver has to be capable of handling this case; otherwise, the safety factor would be incongruent. For the sake of simplicity, we will consider the factor as applying to the whole load. Given that live loads are much greater than self-weight, we determine that it is a good first approach.
Finite Element Model
We model half of the structure to take advantage of symmetry and reduce simulation cost. We also select a shell elements model with a planar quadrangle dominant mesh. The mesh pictured in Figure 3 has 27,943 bi-quadratic elements (112 are triangles).
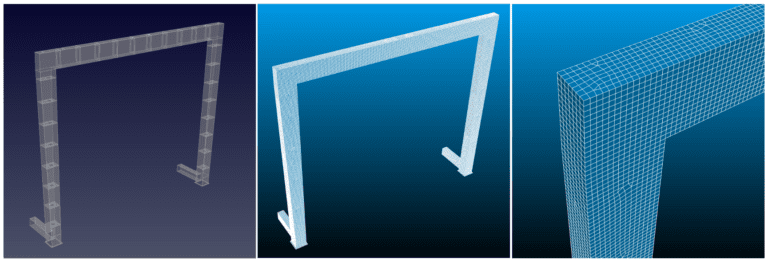
As we will make use of the Code_Aster solver (the same that powers SimScale), we need to check that our element types are able to model buckling. The selected model is ‘Coque_3D’ or 3D Shell. This is a curved, bi-quadratic shell element, and the only shell element capable of buckling analysis (these features will be available on the SimScale Platform in the near future). As discussed, two simulations were carried out to take into account the different load cases.
Simulation Results
Let’s first take a look at the stress state resulting from our two load cases:
Load Case 1: live load at midspan
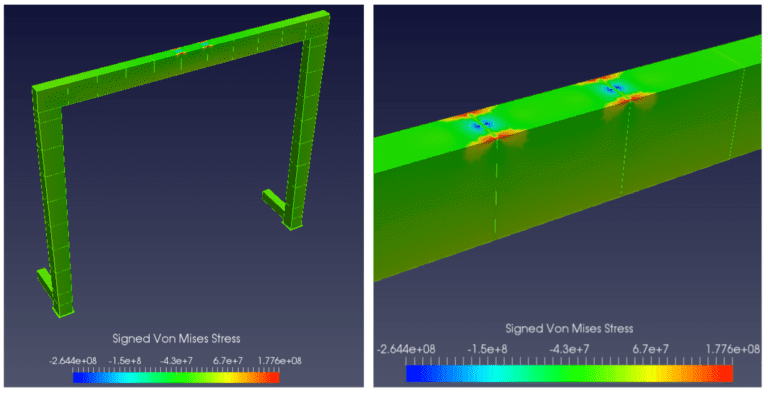
Load Case 2: live load at extreme
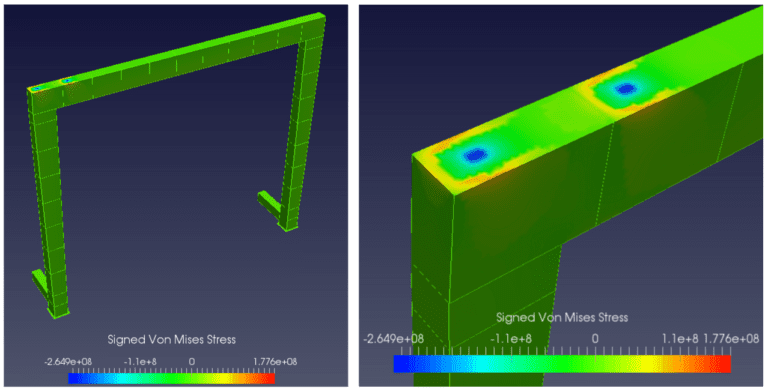
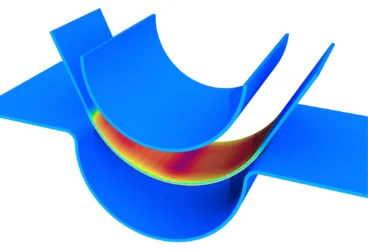
We can observe that the structure of the RTG crane has achieved stress levels near yield point for structural steel (or even above, depending on the chosen material), located in the vicinity of the load application area. But our goal in this instance is to assess the buckling resistance. Carrying out the buckling mode analysis, we find the following modes:
| TABLE 1. BUCKLING MODES FOR LOAD CASE 1 (LIVE LOAD AT MIDSPAN) | ||
| # | CRITICAL LOAD | ERROR MAGNITUDE |
| 1 | -35.22 | 2.11e-9 |
| 2 | -34.27 | 1.60e-11 |
| 3 | -33.51 | 7.23e-12 |
| 4 | 35.88 | 3.35e-7 |
| TABLE 2. BUCKLING MODES FOR LOAD CASE 2 (LIVE LOAD AT EXTREME) | ||
| # | CRITICAL LOAD | ERROR MAGNITUDE |
| 1 | -75.25 | 7.13e-7 |
| 2 | -67.87 | 1.85e-9 |
| 3 | -65.55 | 2.36e-11 |
| 4 | -63.07 | 4.16e-11 |
Analysis Results
From Tables 1 and 2, we can see that the solver returns negative values for the critical load as was expected, but there is a positive value present also. How do we interpret the critical load values?
As already explained in the theoretical section, the lambda factors should be negative numbers so the instability could occur. But remember that these are factors multiplying the effect of the load on the structure, so the results are load factors. In this sense, a negative value means that if we augment our load proportionally to this factor, failure would occur. In contrast, a positive value means that we would have to reverse the direction of the load. In other words, it is not a load but a safety factor.
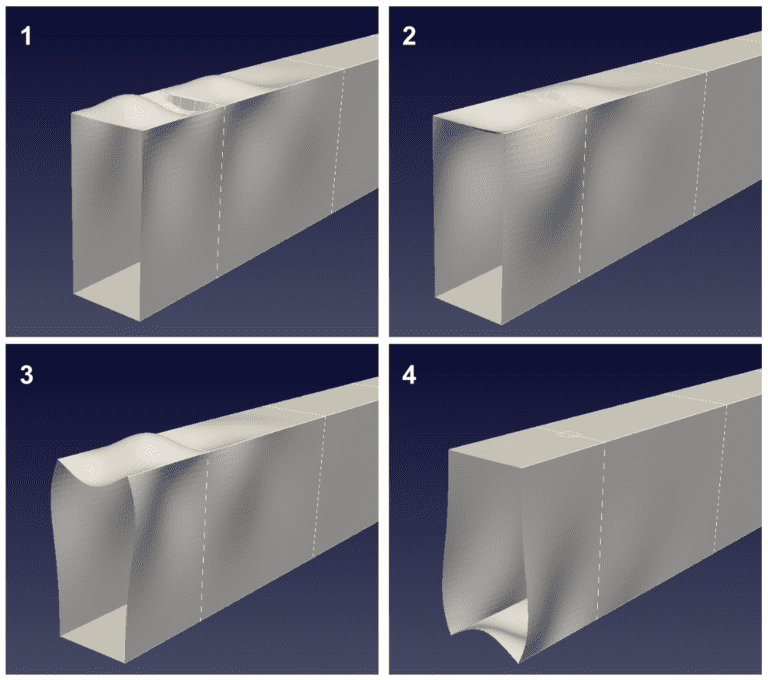
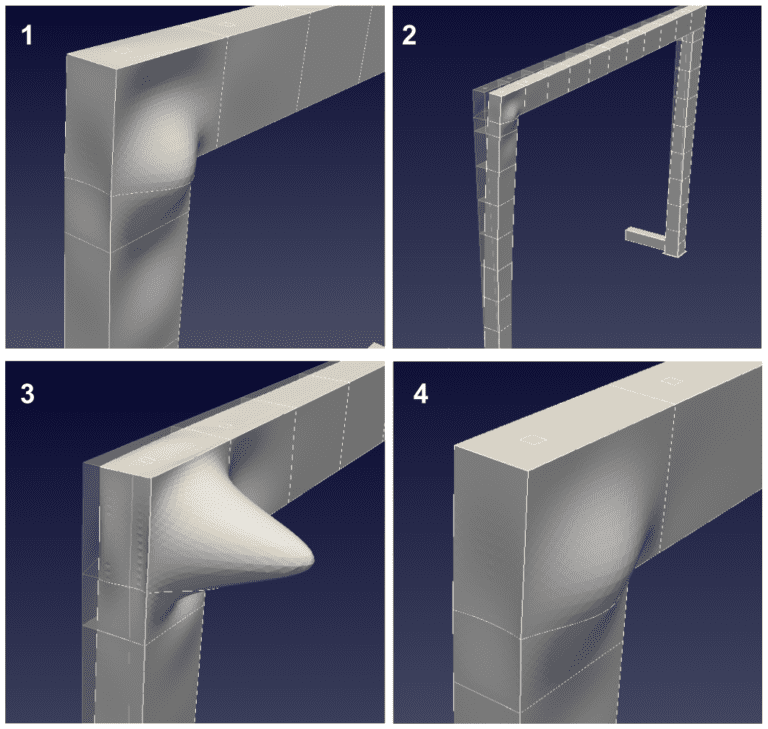
For the Load Case 1 (live load at midspan), the first three modes represent local buckling of the box beam members, and all safety factors are very close, in the range 33~35. The fourth mode is very interesting; the critical load factor is positive and the mode indicates buckling in the lower flange of the beam. So we can clearly notice that for this mode to occur, we would need to reverse the load so that the bottom flange turns out to be in compression.
For Load Case 2 (live load at the extreme), modes 1 and 4 again show local buckling of the plates. But modes 2 and 3 show a very interesting combination of local buckling and global buckling of the column member. The overall safety factors are in the range 63~75.
So as a final general assessment, we identified that the analyzed structure is closer to fail because of local yielding than from buckling. As designers, we could then make choices such as changing dimensions or thickness to bring safety factors closer. To further investigate the design, we would detail the local reinforcements and take the linear stresses to the desired levels. This would be completed with a detailed local model, or possibly with solid 3D elements (already available in SimScale). Then, when this is sorted out, we would repeat the buckling analysis to find the new modes.
Further Comments
The linear buckling analysis presented here is very useful to estimate safety factors against this failure mode. It also illustrates the deformation for each mode. But the actual deformation magnitudes calculated in this way are inexpressive (note that we didn’t make any references to this values) and consequently the stress levels are too. In a more realistic scenario, when buckling occurs, there is a sudden deformation which deviates from the regular linear elastic mode, and stress redistribution occurs due to plasticity. To model this more accurately, we would have to resort to nonlinear analysis.
Technology corollary
- CAD modeling: Onshape
- Geometry preparation and meshing: Salomé
- Finite Element solver: Code_Aster
- Post-processing: Salomé and ParaView
About Senid
Guillermo Giraldo is Founder of Servicios en Ingeniería Dinámica S.A.S. – (Dynamic Engineering Services), a company dedicated to engineering services in design and consultancy. The firm was started by young talent and has demonstrated a great commitment to responsibility, experience, and knowledge of the best practices for analysis and engineering design. Read more about its projects and see how you can collaborate on the company’s partner page.


