Hello Harish,
First off: Welcome to SimScale! It looks like you have a good handle of most of the simulation setup with the platform which is great to see!
Regarding the modeling of porous media using the Porous Media Advanced Concept within SimScale (or other simulation tools), it’s important to note that it is only well suited for certain applications.
Since the physical 3D shape of the screen/porous media isn’t modeled, the assumption with using the porous media modeling from the Advanced Concept panel is that the flow along the plane of the porous media (left/right/into & out of the page in reference to your screenshots) is insignificant/near zero compared to the flow across the porous media (up and down).
When defining the Cartesian components of the Darcy-Forcheimer coefficients, this is to define the direction of flow, and therefore, the direction of pressure loss. This is necessary as the porous media model is being applied to a basic box body with no information as to how the pressure loss is modeled spatially. So the pressure loss in the x & z components for your specific porous media is meant to be insignificant to the problem; those x & z coefficients should be zero.
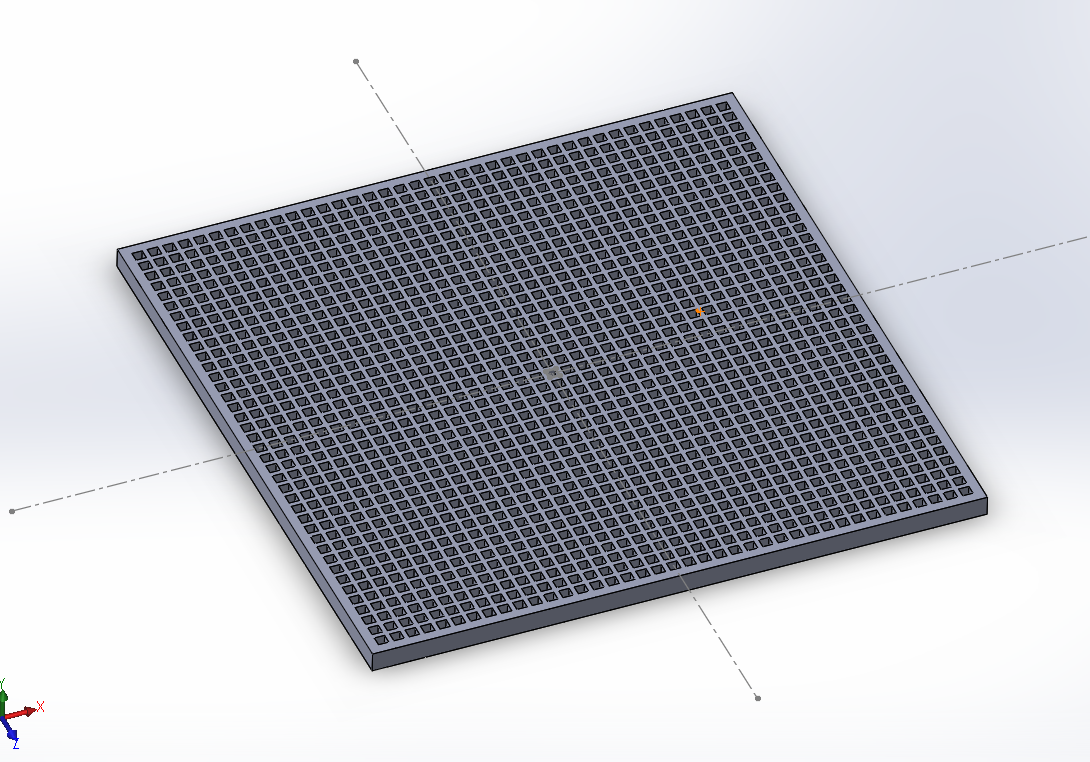
Since your inlet flow is along the plane of the porous media entrance, it is a best practice to model the porous media geometry explicitly as you’ve done with your local OpenFOAM case.
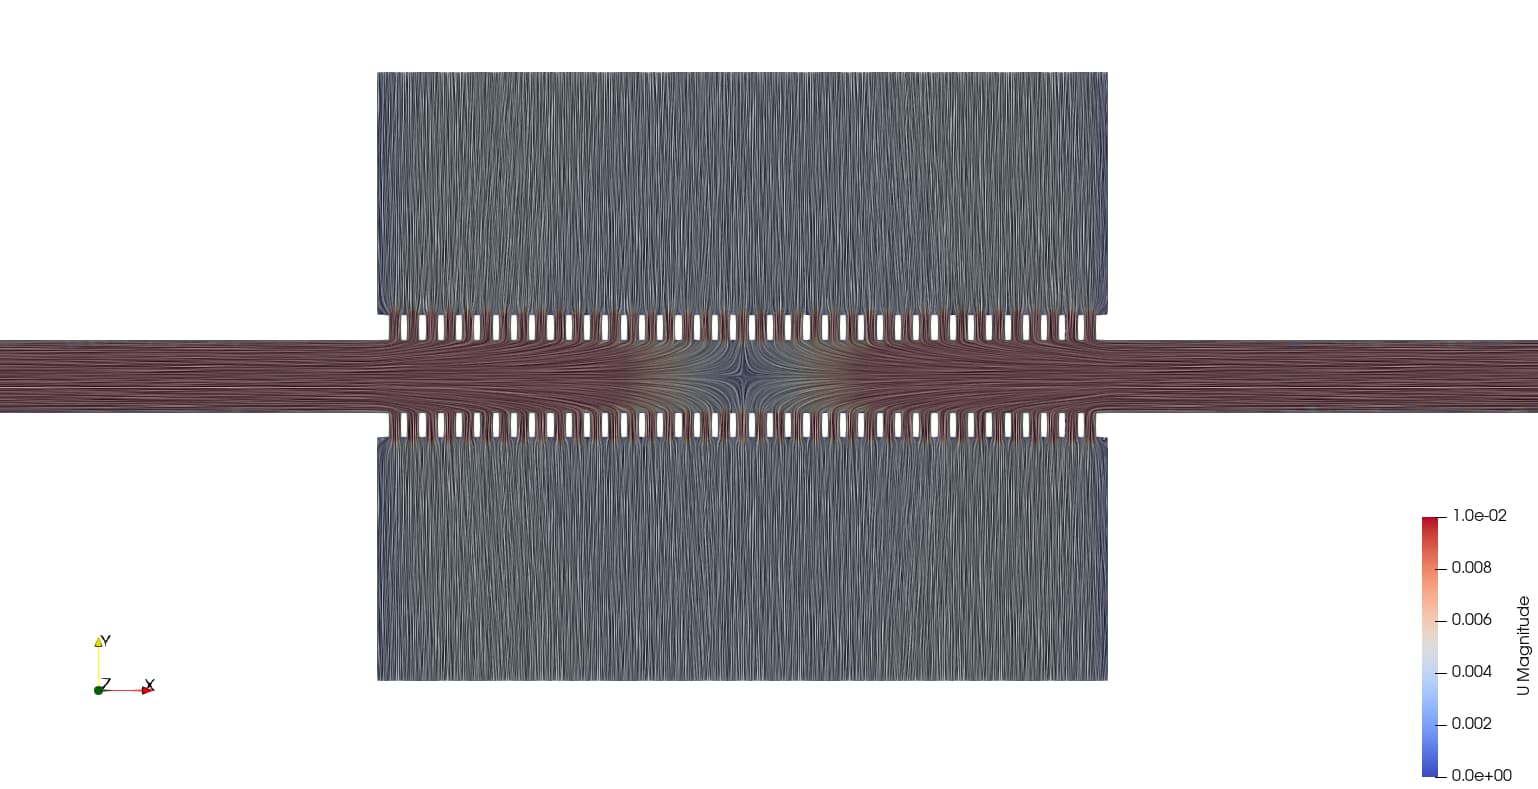
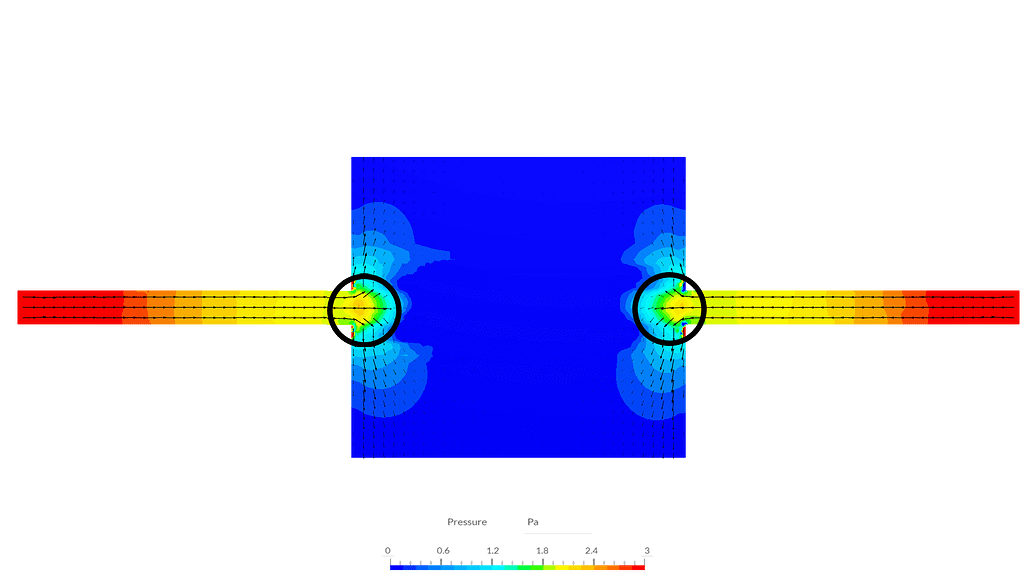
You can see from the flow streamlines in your OpenFOAM case that the x-component of the velocity (horizontal, left/right direction) reaches a stagnation point on the sides of the grill walls. This flow behavior can only be modeled using the explicit 3D model of the grill/screen. The porous media is only meant to be modeling pressure losses, not flow stagnation / direction changes.
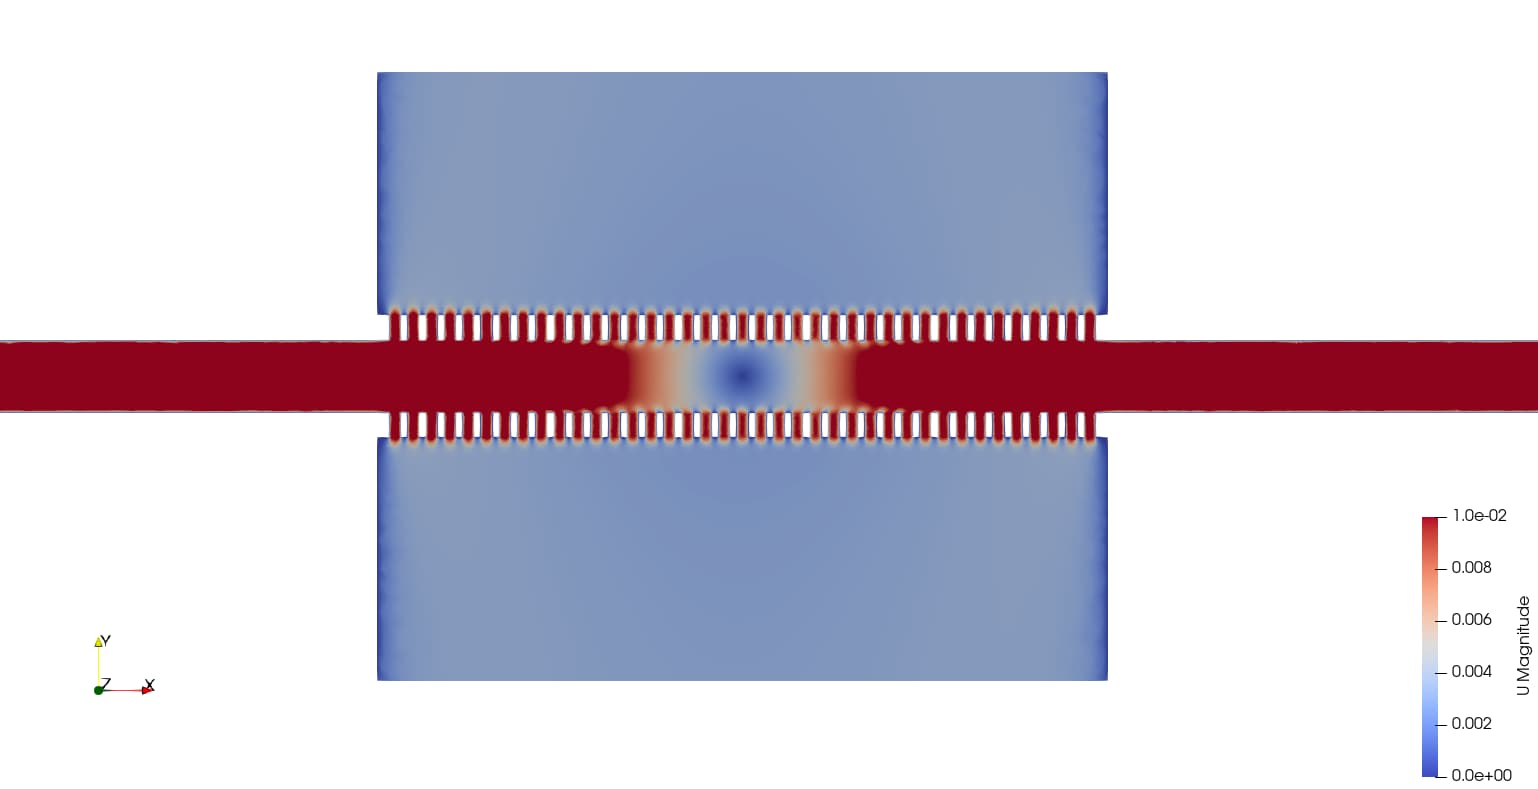
If you look at the pressure contours of the model you have, the static pressure rises promptly at the exit of the 2 inlet channels before dropping rapidly again due to the sudden cross sectional expansion. This means that the region with the highest pressure will be where the most flow occurs across the porous media. This is why the flow across the porous media element is focused near the exit of the 2 inlet channels. The highlighted regions have the greatest pressure on the entrance side of the porous media, so as expected, the fluid flows in through here.
Where to go from here:
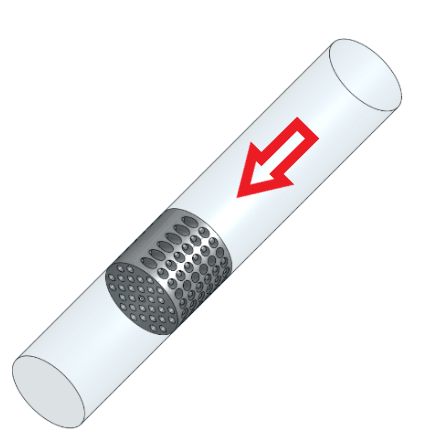
You should account for the explicit 3D model of the screen/grill in your flow domain rather than using the porous media modeling feature. If you are modeling inline pipe flow, where the flow direction is along the direction of pressure loss from the porous media, that is when the feature is more applicable (see below, where the red arrow is the direction of flow).
Further, if you want to ensure you generate a good quality mesh and efficiently run the problem, I’d recommend the following adjustments to your setup (not necessary, but more reliable/faster runtime):
-
Cut the geometry in half (or quarter section) and use the symmetry boundary condition to model the geometry & problem mirroring across the selected boundary plane.
-
If the standard mesher isn’t generating a suitable mesh for the tiny gaps on the screen/grill section of the flow domain, use the Mesh Region Refinement (which you seem to already have a handle on) or try using the Hex-dominant mesher, which uses the snappyHexMesh method for meshing.
For either case, modeling friction/pressure losses along surfaces will be more accurate when adding in Boundary/Prism layers in the mesh. This can simply be toggled on within the Mesh settings:
As a last note: You don’t need to explicitly select all the No-Slip walls and define them in your list of boundary conditions. All non-selected walls will automatically be treated as such.
I hope this helps you progress in addressing your simulation problem and informs you of how to (and not to) use the Porous Media modeling feature.
Cheers,
Omar