Please do, my experience confirms the 800 tho…
ok, again i trust you. Is this graph independent of Reynolds numbers or would the curve range change slightly based on velocity differences, therefore changing the Y+ range that should be measured
I can not answer that question, I will leave it up to you to research and report back here…
Oh boy haha. I know that the Reynolds number changes with wall distance, because the speed of the air changes toward free stream velocity, but we are calculating our Y+ at one specific speed, which could alter the curve (maybe i really have no idea).
EDIT: Answered in next post The shape of this is generally the same for all flows
Thanks Dale i have some work to do, as always haha. Ill post anything i find, dont want to take up too much of your time.
this didnt take long to find, thanks to Simscale haha. I read all these articles already but re-reading with what i know now gives new meaning.
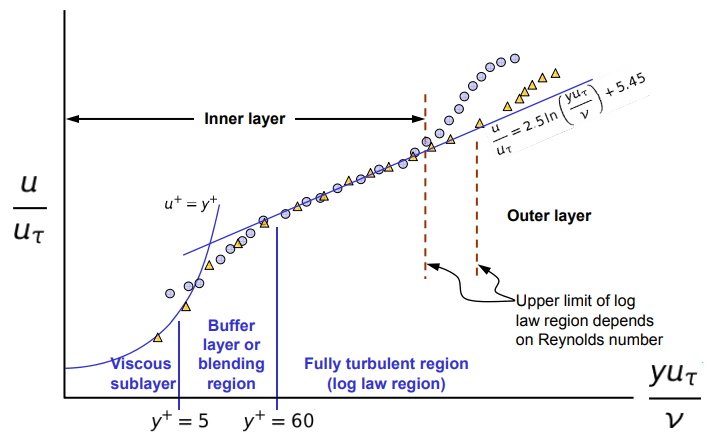
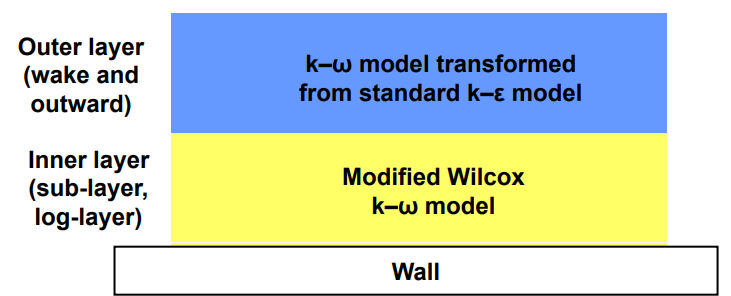
The first cell center needs to be placed in the log-law region to ensure the accuracy of the results. Wall functions are used to bridge the inner region between the wall and the turbulence fully developed region.
First grid cell needs to be 30 < y+ < 300 (If this is too low, the model is invalid. If this is too high, the wall is not properly resolved.
If i understand this correctly:
- This means only the first cell centroid needs to be in the 30-300 range not the all 3 cells (or however many you are using)
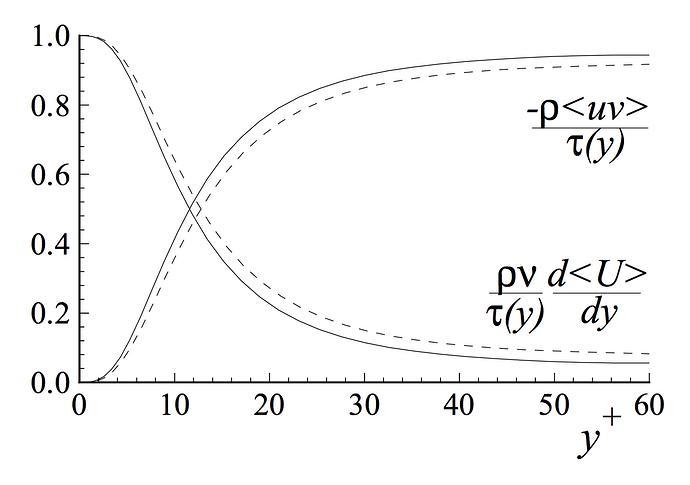
The wall functions rely on the universal law of the wall , which basically states that the velocity distribution very near to a wall is similar for almost all turbulent flows. One can interpret y+ as a local Reynolds number, which means that its magnitude can be expected to determine the relative importance of viscous and turbulent processes. Figure 2 shows the fractional contributions to the total stress from the viscous and Reynolds stresses in the near wall region of channel flow. One can easily see that if we are in the viscous wall region with y+ < 50, there is a direct effect of the viscosity on the shear stress. Conversely in the outer layer with y+ > 50, the effect of viscosity is neglibile. (Pope)
Depending on the turbulence model used, different wall functions must be applied to respective fields of the turbulence model, which means that k−ϵ has different wall functions than the k−ω model.
Due to this fact, the different turbulence models and the associated wall functions require different values of y+ as well as different spatial resolutions of the near wall area.
- Since we are using the k−ω turbulence model we dont need to worry about wall functions but we must be aware that our Y+ values could be different because we are using this model. I am not sure if these ranges apply, but i assume now they are pretty universal.
This article is a main source for the simscale wiki article so i read through this as well
The size of your grid cell nearest to the wall (value of y+) is very important. The
value you need depends on the modelling approach chosen.
Using a Wall Function
* First grid cell needs to be 30 < y+ < 300 (Too low, and model is invalid. Too high and the wall is not properly resolved.)
* Use a wall function, and a high Re turbulence model (SKE, RKE, RNG)
* Generally speaking, this is the approach if you are more interested in the mixing in the middle of the domain, rather than the forces on the wall.
- This graph shows a log-law starting point of Y+ = 60. the upper limit of this value range, as shown in the graph above, says that it is determined by the Reynolds number. This means that the normal 30-300 Y+ range is more of a guideline for the first cell size and to fully encapsulate the log law region, the upper limit is dependent on the Reynolds number being measured. So this could be 30-300, 30-500 or 30- 800.
EDIT: Re reading this again i see i have made some false assumptions but have reworded my questions
Now the questions become:
- Should the first layer size be randomly within the 30-(measured Reynolds number range)?
Example using range of 30-300:
starting point of first cell - Y = 50 - lower limit of log-law
OR
starting point of first cell - Y= 250 - upper limit of log-law
(both first cell sizes are within 30-300 range)
-
in continuation of question 1, would it be better for the first cell size be in the middle of the 30-300 range so that changes in mesh sizing still keeps the Y+ Value in the range?
-
What is the upper limit (outside of the log-law region) for the remaining Boundary layer cells or is there sole purpose to reduce a sudden change between any larger neighboring cell sizes?
Found an interesting article. Very complex but worth the read. I just skimmed it and found this Quoted from page 7&8 3. FLOW REGIMES
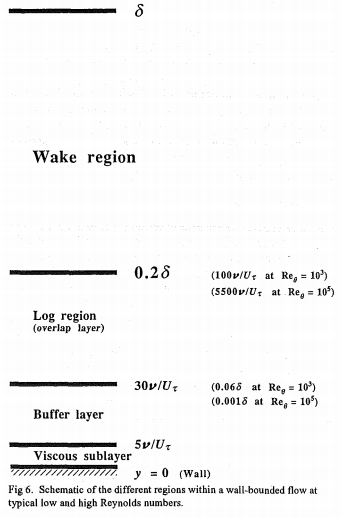
The extent of the log region, expressed in wall units, increases with Reynolds number but is
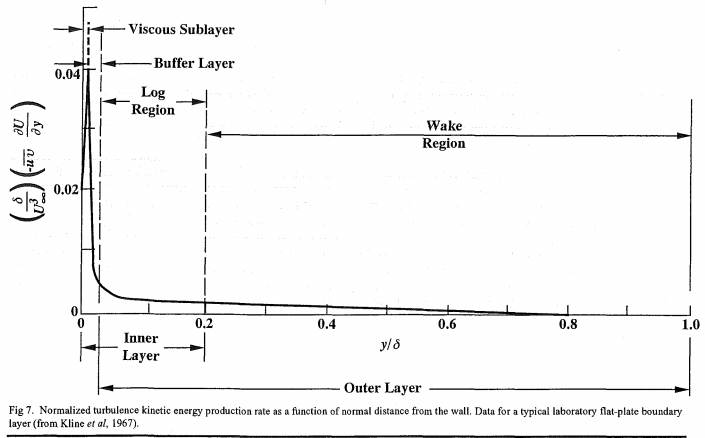
a constant fraction of the boundary layer thickness (Fig 6).
Based on this graph i should be ending the log-law region at 0.2 X my Reynolds number, however trying to understand or compute these exact numbers is getting a bit involved for what i am trying to do and i think i will stay at a range of 100-800 for my Y+ range with all 3 boundary layers within this range.
So, at Y+ = 100 i have: 0.002165 first cell height
and at Y+ = 800 i have: 0.01732 final cell height (all 3 combined)
Does this seem right?
2.1mm first layer size and 17.3mm total boundary layer?
17mm seems quite large for a boundary layer unless this is including the wake region and only the first cell height is in the log-law region. Again confusing and i dont know this answer
I will quickly answer this post #86 first, as I will have many comments of post #85 later (but Post #85 does not convince me that a wall function mesh surface y+ needs a max limit of 300. IF YOU CAN STILL ACHIEVE PROPERLY RESOLVED WALLS, ON VALUES OF y+ up to 800, I THINK YOU ARE STILL OK)…
That ReEFFECT.pdf is a good find, thanks, I will devour that sometime soon…
We are breaking new ground here so we must be careful.
My opinion remains that there is likely little difference in results accuracy between a wall function mesh that is layered with a constant y+ surface value of 300 versus a mesh with constant y+ surface value of 30… and PERHAPS even with a mesh with constant y+ surface value of 800…
That would be a relatively easy test to setup with a relevant sim setup for 3 meshes on a simple but relevant geometry. Rather than continue to postulate, it might be worth the time for you to do that now…
As far as getting a properly resolved wall at 300 or 800, that may take some doing but you have the tools, I would investigate using relative layering using greater than 1 (maybe much larger than 1) ‘final layer thickness’ RATIOs…
I think using higher max y+ might possibly lead to a way to lower your cell count 
PS I do not know how this fits in, but y+ values are generated for all surfaces that are deemed ‘no-slip’, even if they are not layered. I know this may seem obvious but it did take me a while to truly understand that, not that I understand it now
Ok, i think as you said an experiment of different Y+ values would be best. I would start to disagree that a surface value of 800 could have accurate results, i think the measurements taken from such a large cell size couldnt be that accurate with such small geometry needing to be measured (i mean in my specific situation). HOWEVER, i think this will take too much of my time to setup, and again, just meshing accuracy is not what my thesis is about so i think its best to be moving on.
This will definitely decrease my cell count which is an important factor so like i said i think i will stay with first layer at 100 so that this can be achieved.
I think, if im not wrong in understanding what i read, this has to do with the turbulence model being used for each area. Since we are using the K-omega sst model it uses K-omega modeling for “no-slip” for the viscous sub layer and log-law section, then the K-epsilon model for the wake section and above. So i assume this would allow for “somewhat” accurate boundary layer representation even if there is no boundary layer refinement on a designated “no-slip” geometry
Yes but, you may save a lot of cells if on the flatter, larger areas of the body were at the higher y+ values and still somehow use relative layering to resolve the small features (all while staying in the y+ range you choose), this would take time to figure out a system to do this (now at the bottom of my todo list, as well as that 30,300,800 test… ![]() )
)
that might work well as you just said, to do finer boundary layer refinements on the wings and coarser on the mono. The main problem is that i would have to average the cell size level so that the Final thickness ratio isnt to aggressive. Is this what you meant by having 1 or larger then 1 ratios?
Basically yes…
ah ok. ill leave you alone for now and do some work haha. Thanks so much!
New meshing strategy
Our goal for our new meshing strategy is to get Y+ values for both the wings and base mono surfaces by calculating the first cell size of 100 and an overall cell size (all 3 layers added together) of Y+ = 800. In order to achieve this, the expansion ratios and final thickness ratios must be altered to achieve values as close as possible to our desired Y+ range of 100-800. We will use our Y+ calculator to get the first cell size at a Y+ of 100 and our ending Y+ of 800
Using the calculator, our Y+ = 100 for the first cell thickness is 0.002165m
our Y+ = 800 for the overall cell thickness is 0.017321m
To get from the first calculated Y+ value of 100 to our final overall thickness of 800, the expansion ratio between layers must be found and the added total of these three layers must equal our 800 value of 0.017321m
By trial and error the closest expansion ratio of 2.1 was used to get a third layer size of 0.0945465m. Adding all three layers resulted in an overall thickness of 0.01625m, and relating to the Y+ calculator, through changes to the Y+, a value of 765 was found to be 0.016564m which is close enough to 0.01625 and our 800 target.
The Y+ of 765 is used just as a check to see that we are below 800. The exact 765 Y+ value is not needed.
| Inflate boundary layer settings - layer calculation | Y+ Value | |
|---|---|---|
| Layers | 3 | |
| 1st | 0.002165m | Y+ = 100 |
| 2nd | 0.0045465m | |
| 3rd | 0.009547m | |
| Overall thickness | 0.01625m | Y+ = 765 |
| Expansion ratio | 2.1 | |
| Min thickness | 0.001m | |
| Final layer thickness (RATIO) | ? |
The next step would be to find our surface refinement level to be used on each geometry. Since our Y+ range of 100-800 would be used for the wings and the mono, a difference in the Final thickness (RATIO) value must be calculated so that our Y+ range can stay the same when related to two different surface refinement levels.
Here is where the problem starts, we want to use the largest cell size possible for our surface refinements so that the mesh will not have too many total cells but small enough so that the mesh will accurately define the meshing surface. Previous meshes are shown below for optimal cell sizes for specific geometries.
| Geometry | Mesh QT 3 | Mesh QT 4 | Mesh QT 5 | 2019 Final | Min Ranges | Target New values |
|---|---|---|---|---|---|---|
| mono | 0.0075 | 0.015 | 0.0054 | 5-6 0.0075 | 0.0054-0.015 | 0.0075 |
| suspension | 0.00375 | 0.00375 | 0.0013 | 6-7 0.00375 | 0.0013-0.00375 | 0.00375 |
| wheels | 0.0075 | 0.0075 | 0.0054 | 5-6 0.0075 | 0,0054-0.0075 | 0.0075 |
| MRF | 0.00375 | 0.0075 | 0.0054 | 6 0.00375 | 0.00375-0.0075 | 0.0054 |
| Motors | 0.0075 | 0.0075 | 0.0013 | 6-7 0.00375 | 0.0013-0.0075 | 0.0075 |
| Wings | 6-7 0.00375 | 0.00375 | ||||
| Endplates | 6-7 0.00375 | 0.00375 |
To estimate what surface refinement size will result in a successful mesh, the values from the 2019 car and the feature refinement levels are taken into consideration.
Feature refinement : distance of 0.001 - level 7 = 0.001875m
distance of 0.005 - level 5 = 0.0075m
From the data taken above, to have a non-failing mesh, we need a surface refinement for all non-wing geometries of 0.0075m or smaller and for all wing geometries a refinement of 0.00375 or smaller.
To find the correct Final thickness ratio, we use the following equation.
final layer thickness ratio = 3rd layer thickness / surface refinement Level size
Our problem is that a normal final layer thickness ratio is around 0.5. This means the 3rd layer cell thickness should be about ½ the size of the surface refinement cell size.
Based on our 100-800 Y+ range, which required a large expansion ratio of 2.1, our 3rd layer thickness is 0.009547m.
With a 3rd layer thickness of 0.009547m doubling of this value (our ratio just reversed) should give us our surface refinement cell size. This would then be 0.0190m.
This means:
- our calculated Surface refinement cell size from above is 0.0190m
- our “known” surface refinement from previous meshes (shown in table above) is 0.0075m for non wings and 0.00375m for wing surfaces.
As you can see our Y+ = 800 target value results in a 3rd layer cell size that is much too large. This is because we have to relate this size to the surface refinement, as the 3rd layer cell size should be about half of the surface refinement cell size.
Based on the information above, to me, our limitations to either our Y+ ranges and cell sizes or our surface refinement cell sizes is determined by the largest allowable cell size for each selected geometry.
Of course this is based on the goal of having a low total cell count for the simulation, which is a big factor for my specific case due to the complexity of an FSAE car geometry and the requirement to have a full car simulation. If the amount of cores available for use was raised, then naturally the refinement level could be increased. However, my limitation is to 32 cores.
The next post will show what Y+ Range is resultant from using our “known” surface refinement cell sizes, (0.0075m for non wings and 0.00375m for wing surfaces) which did create a mesh successfully.
New meshing strategy
New Y+ range based on successful surface refinement cell sizes
We will now calculate back, starting with our surface refinement size to find the correct Y+ Range. Starting with the following equation to find a reasonable 3rd layer thickness cell size for all non-winged surfaces
Calculation #1
final layer thickness ratio = 3rd layer thickness / surface refinement Level size
0.4 = X / 0.0075
X = 0.4 * 0.0075
X = 0.003m
This is our 3rd laver cell size.
To estimate our upper limit Y+, we must first find the correct expansion ratio to get from our first layer cell size at Y+ = 100 which is 0.002165m to our 3rd cell size of 0.003m
The closest expansion ratio resulted in 1.18 which gives the following:
| Inflate boundary layer settings - layer calculation | Y+ Value | |
|---|---|---|
| Layers | 3 | |
| 1st | 0.002165m | Y+ = 100 |
| 2nd | 0.002554m | |
| 3rd | 0.003014m | |
| Overall thickness | 0.007733m | Y+ = 358 |
| Expansion ratio | 1.18 | |
| Min thickness | 0.001m | |
| Final layer thickness (RATIO) | 0.4 |
With an overall thickness value of 0.007733m the closest Y+ is 359 at 0.0077515m
While a Y+ range of 100-358 isnt that bad, the optimal final layer thickness ratio of 0.4 shows how the rest of these calculations are affected by this value.
There are two fixed values in all of our meshing calculations.
- Our first layer thickness Y+ value. This must be around 100
- Our surface refinement max cell size. For non-wing geometries this is 0.0075m and for winged geometries this is 0.00375m
There best way to increase our upper Y+ limit is to increase our final layer thickness ratio to allow for a larger 3rd layer cell, which will also increase our expansion ratio value to a more desirable level, and finally our overall thickness of the boundary level, which is our upper limit of the Y+ value.
Calculation #2
By changing the final layer thickness ratio to 0.6 our new upper limit Y+ Value will be calculated.
0.6 = X / 0.0075
X = 0.6 * 0.0075
X = 0.0045m
This is our 3rd laver cell size.
To estimate our upper limit Y+, we must first find the correct expansion ratio to get from our first layer cell size at Y+ = 100 which is 0.002165m to our 3rd cell size of 0.0045m
The closest expansion ratio resulted in 1.45 which gives the following:
| Inflate boundary layer settings - layer calculation | Y+ Value | |
|---|---|---|
| Layers | 3 | |
| 1st | 0.002165m | Y+ = 100 |
| 2nd | 0.003139m | |
| 3rd | 0.0045519m | |
| Overall thickness | 0.009855m | Y+ = 455 |
| Expansion ratio | 1.45 | |
| Min thickness | 0.001m | |
| Final layer thickness (RATIO) | 0.6 |
With an overall thickness value of 0.009855m the closest Y+ is 455 at 0.0098518m
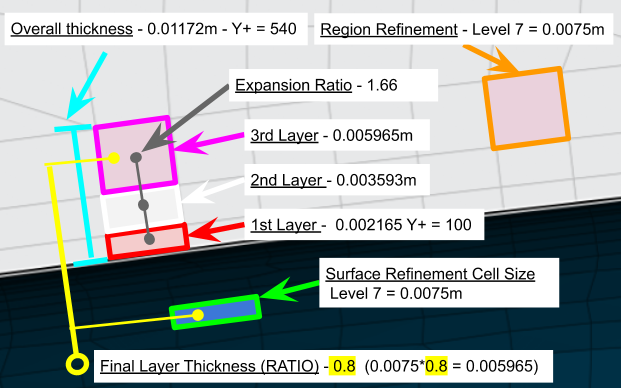
Calculation #3
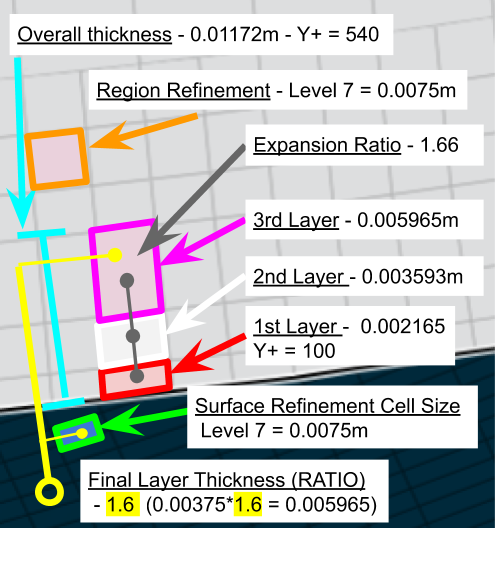
By changing the final layer thickness ratio to 0.8 our new upper limit Y+ Value will be calculated and with a third data point, estimations can be made about the relation between final layer thickness ratio, expansion ratio, and Y+ upper limit
0.8 = X / 0.0075
X = 0.8 * 0.0075
X = 0.006m
This is our 3rd laver cell size.
To estimate our upper limit Y+, we must first find the correct expansion ratio to get from our first layer cell size at Y+ = 100 which is 0.002165m to our 3rd cell size of 0.006m
The closest expansion ratio resulted in 1.66 which gives the following:
| Inflate boundary layer settings - layer calculation | Y+ Value | |
|---|---|---|
| Layers | 3 | |
| 1st | 0.002165m | Y+ = 100 |
| 2nd | 0.003593m | |
| 3rd | 0.005965m | |
| Overall thickness | 0.01172m | Y+ = 540 |
| Expansion ratio | 1.66 | |
| Min thickness | 0.001m | |
| Final layer thickness (RATIO) | 0.8 |
With an overall thickness value of 0.01172m the closest Y+ is 540 at 0.0116922
Data relation table #1
By combining the results of all three calculations the following table give insight into the relations between these variables.
| Surface refinement cell size | Final layer thickness RATIO | First layer cell size Y+ = 100 | Expansion ratio | 3rd Layer cell size | Overall thickness | Y+ top limit value |
|---|---|---|---|---|---|---|
| 0.0075 | 0.4 | 0.002165m | 1.18 | 0.003m | 0.007733m | 358 |
| 0.0075 | 0.6 | 0.002165m | 1.45 | 0.0045m | 0.009855m | 455 |
| 0.0075 | 0.8 | 0.002165m | 1.66 | 0.006m | 0.01172m | 540 |
| Difference between Data | ||||||
| 0.4 - 0.6 | 0.2 | 0.27 | 0.0015m | 0.002122m | 97 | |
| 0.6 - 0.8 | 0.2 | 0.21 | 0.0015m | 0.001865m | 85 |
Calculation #4
Now the calculation will be made for wing surface refinements, with a surface refinement cell thickness of 0.00375 I will use a final layer thickness ratio to 0.8 for the new upper limit Y+ Value.
0.8 = X / 0.00375
X = 0.8 * 0.00375
X = 0.003m
This is our 3rd laver cell size.
Conveniently, our 3rd layer size is 0.003m which is already calculated in using the 0.0075 surface refinement level at 0.4 final layer thickness ratio shown in calculation #1.
The closest expansion ratio resulted in 1.18 which gives the following:
| Inflate boundary layer settings - layer calculation | Y+ Value | |
|---|---|---|
| Layers | 3 | |
| 1st | 0.002165m | Y+ = 100 |
| 2nd | 0.002554m | |
| 3rd | 0.003014m | |
| Overall thickness | 0.007733m | Y+ = 358 |
| Expansion ratio | 1.18 | |
| Min thickness | 0.001m | |
| Final layer thickness (RATIO) | 0.8 |
With an overall thickness value of 0.007733m the closest Y+ is 359 at 0.0077515m
Calculation #5
By referencing our table that related final layer thickness expansion ratios to Y+ upper limit values. We can estimate that there is an obvious correlation between final layer thickness expansion ratio that will give us an approximate Y+ upper limit value of 540, which will be true if X = 0.006 in the following equation.
1.2 = X / 0.00375
X = 1.2 * 0.00375
X = 0.0045m
As you can see the result is 0.0045m with an increase of 0.4 to the final layer thickness ratio. Since 0.00375 is exactly half or 0.0075 (one cell level down). We can surmise that adding 0.8 to our original final layer thickness expansion ratio of 0.8 will give us our desired 0.006 3rd layer thickness and our desired Y+ value of 540.
1.6 = X / 0.00375
X = 1.6 * 0.00375
X = 0.006m
This is our 3rd laver cell size.
We can simply use the same table data results from calculation #3
The closest expansion ratio resulted in 1.66 which gives the following:
| Inflate boundary layer settings - layer calculation | Y+ Value | |
|---|---|---|
| Layers | 3 | |
| 1st | 0.002165m | Y+ = 100 |
| 2nd | 0.003593m | |
| 3rd | 0.005965m | |
| Overall thickness | 0.01172m | Y+ = 540 |
| Expansion ratio | 1.66 | |
| Min thickness | 0.001m | |
| Final layer thickness (RATIO) | 0.8 |
With an overall thickness value of 0.01172m the closest Y+ is 540 at 0.0116922
Data relation table #2
| Surface refinement cell size | Final layer thickness RATIO | First layer cell size Y+ = 100 | Expansion ratio | 3rd Layer cell size | Overall thickness | Y+ top limit value |
|---|---|---|---|---|---|---|
| 0.00375 | 0.8 | 0.002165m | 1.18 | 0.003m | 0.007733m | 358 |
| 0.00375 | 1.6 | 0.002165m | 1.66 | 0.006m | 0.01172m | 540 |
| Difference between Data | ||||||
| 0.8 - 1.6 | 0.8 | 0.48 | 0.003m | 0.003987m | 182 |
This data shows that for two different surface refinement levels, in our case Level 5 (0.0075) and level 6 (0.00375) the final layer thickness ratio must be increased by 0.8 to achieve the same Y+ upper limit level.
HOWEVER, even though the Y+ limit range of 100 - 540 is equal between the two surface level refinements, with a final layer thickness ratio greater than 1.0, the 3rd layer thickness will be LARGER than the surface refinement cell size.
At this point I am unsure which is worse for the mesh quality, an unequal Y+ value range between boundary layer refinements
OR
A final layer thickness ratio greater than 1 which results in a 3rd layer cell size larger than the surface refinement cell size.
Hi Dan,
I have been very busy throughout the holidays but I see that you have a new strategy of your own here…
The normal y+30-300 range and possibly out to y+30-800 range does not have anything to do with a y+ value of the overall thickness of all the boundary layers… If all the y+ surface values, over your whole geometry, fall in the 30-300 range, then you have succeeded in meeting the normal y+ ranging criteria.
That range is the range of y+ values on the surface of the geometry which can only been seen on a y+ surface map of the results on a suitably converged simulation run…
My theory (which I someday will test) was that for wall function use, inside a standard y+ range of ~30-300, the simulation run results would vary insignificantly (I give that a 50-50 chance right now) between meshes that had a constant y+ of 30 all over the geometries surface and one that had 300 all over it… The advantage for meshing to higher end of the range, is that you could certainly make a mesh with fewer cells for that 300 y+ mesh, as long as the transition from prism cells to volume cells could be handled gracefully for the 300 mesh… In fact I do not necessarily think that even a y+ 800 mesh would vary much at all in results values if the transition was graceful…
Frankly I can not see any reasoning that would justify your strategy other than as a maybe a guide to determine whether your overall thickness of your prism layers is large enough to capture the whole turbulent BL… But I think there are better, more proven ways to do that with Eddy Viscosity Ratio analysis of the results etc…
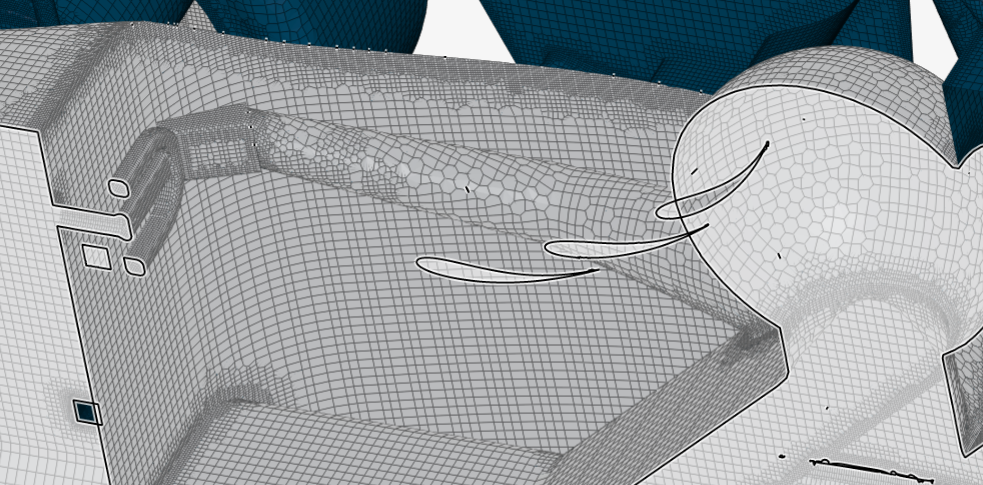
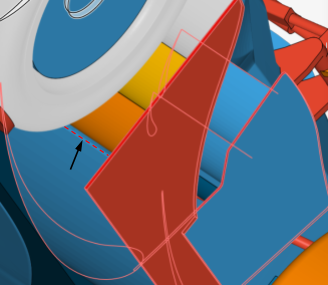
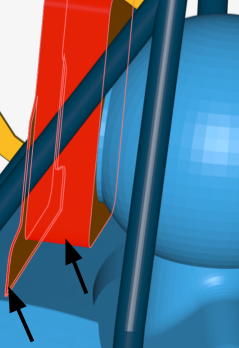
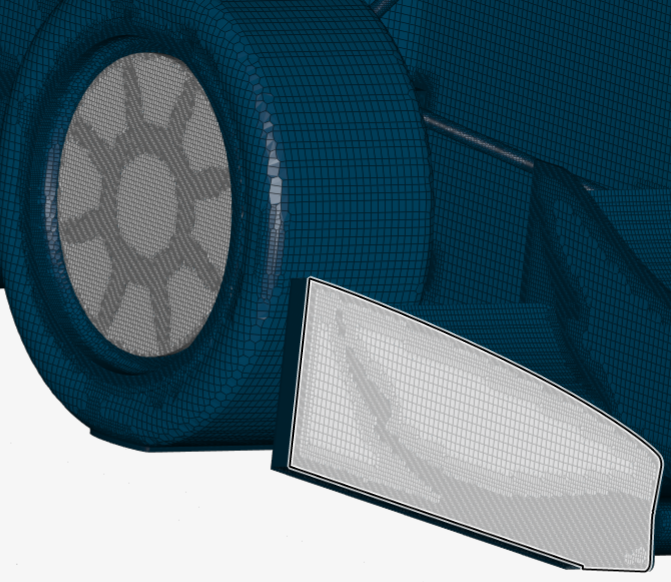
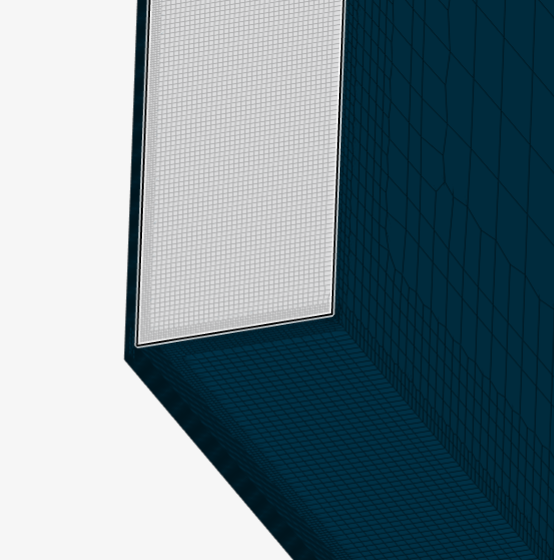
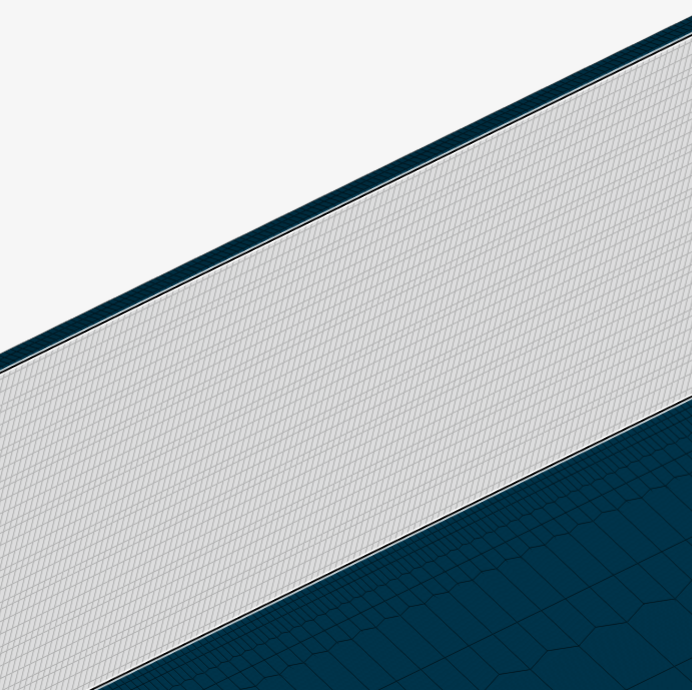
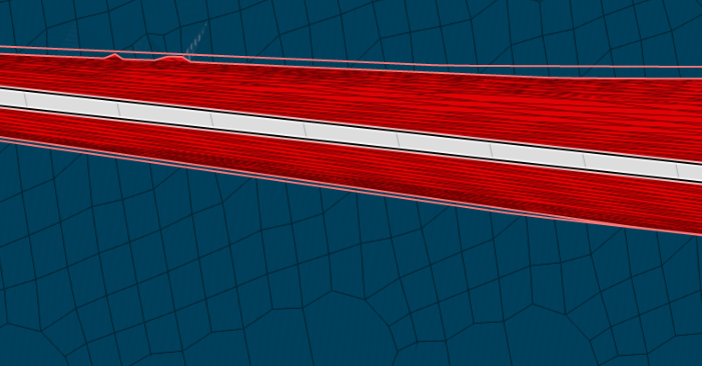
Pictures and Documentation of New Meshing Strategy
Trial 6 - Aero 2 - Mesh QT 6
| Total Cell Count | 14.2m |
|---|---|
| Time | 152min |
| Illegal Cells | 6524 |
| Checking faces in error : |
**non-orthogonality > 70  degrees                        : 6355**
faces with concavity > 80  degrees                     : 0
faces with skewness > 4   (internal) or 20  (boundary) : 0
faces with interpolation weights (0..1)  < 0.02        : 0
faces with volume ratio of neighbour cells < 0.01      : 5
faces with face twist < 0.01                           : 11
faces on cells with determinant < 0.001                : 0
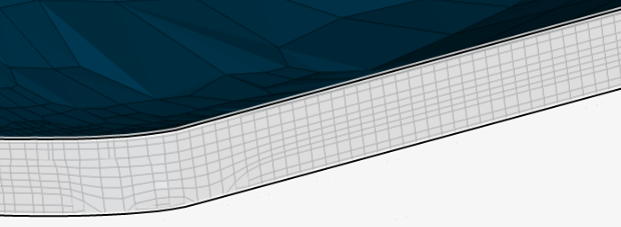
1. New Cartesian boxes
Cartesian boxes are now setup to encompass the geometry as closely as possible to reduce total cell count
Zone 1 - Nose
Zone 2 - Front Suspension
Zone 3 - Driver area
Zone 4 - Rear of mono
Zone 5 - Front Wing
Zone 6 - Front Tire
Zone 7 - Diffuser
Zone 8 - Rear Tire
Zone 9 - Pre-Rear wing
Zone 10 - Rear wing
Zone 11 - Cell reduction box
2. New Boundary layer settings based on Level 7 & Level 8 Y+ = 540
Level 7
Level 8
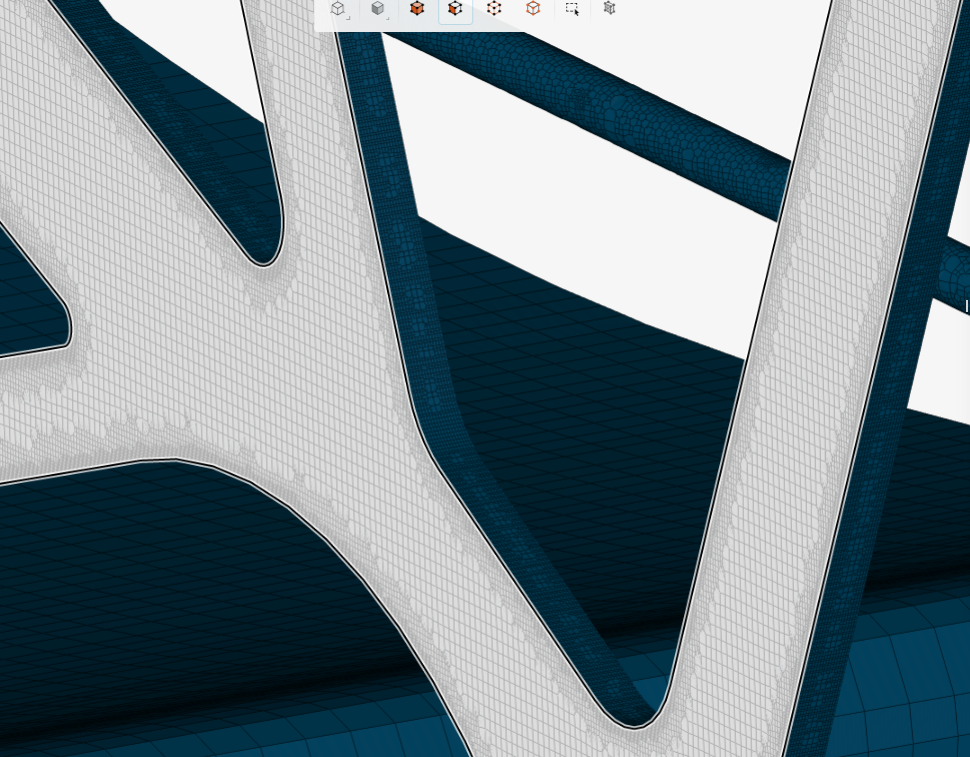
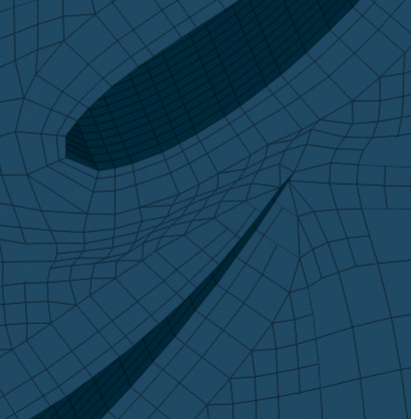
3. Needed improvements
Geometries
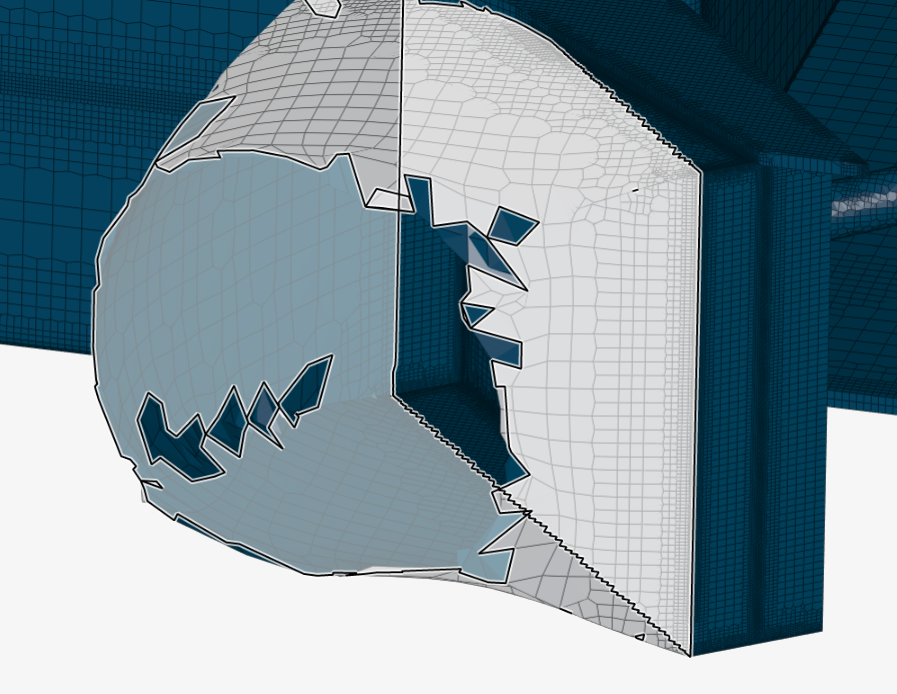
- Split wheel and rim geometry
Outer wheel surface and spokes share same face selection
-
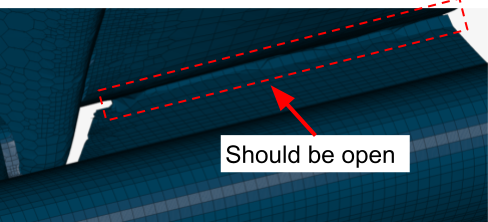
Shorten middle of front main wing (mesh attaches to nose)
Mesh has fused to nose so air cannot pass through.
-
Split foot pedal cover face from mono
This is the smallest surface attached to the mono other then the dummy area. This results in a split level refinement being needed which is not optimal
-
Split driver dummy area from main mono
The necessary smaller surface refinements of this area should be separate to the mono, boundary layer dependent surface.
-
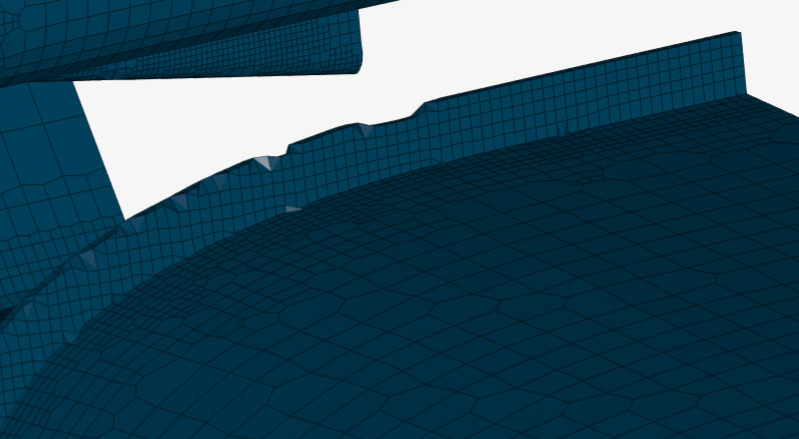
Diffuser trailing edge cannot be selected
The main diffuser profile has no trailing edge face to select. These must be split
-
Headrest small edge face and side pillow have same face selection
The small edge face and larger headrest side face should be split to reduce cell size
New Mesh Changes
- Mesh size way to fine on rear wing holder main face, smaller side faces, and lateral stabilizing beams.
- Mesh reduction on faces such as the MRF zones are getting “print through” from neighboring geometry. This is seen on MRF zone spokes and front endplate wing profile.
-
Front wing outer endplate gurney flaps cell size too small
-
Rear wing element gurney flap cell size too small
!
-
Radiator exhaust shroud mesh too coarse. Jagged edges
- Trailing edges were not meshed however most were converged with cells from the top and bottom of the wing surface. An exception is the front main wing trailing edge which was meshed.
- Contact patch cell size too small
- Trailing edge of wings, boundary layers not created.
By making these changes then most of the model can be separated into small small faced - high refinement level areas, and the larger cell size areas like the mono. Also unnecessarily small cell refinement areas can be improved.
Definitely making progress…
Just a warning, I have found expansion ratios over 1.3 to start affecting results significantly, you may want to try 1.3 and maybe a couple between 1.3 and 1.66 (while keeping the total thickness of all layers constant, you will need more layers at 1.3) to see what difference in results you see…
Dale,
To build on your analysis of Y+ to overall thickness, i agree that there is not a direct correlation between the boundary layer total thickness and Y+ value range. I did not intend to make it seem like the BL range MUST fall between 30-300 or 30-800. It was intended only to see how thick each layer would be, especially using the calculator, to get the upper limit Y+ for understanding how thick the entire boundary layer would be. From what i understand, (which is not a whole lot) the most important thing is that the first cell size falls within the 30-300 range, or in your opinion so far, 30-800 range.
The part that im not sure about, is your theory that the results would not differ much when the Y+ is so large, closer to the 800 side. I would assume that with such a large cell size, that trying to calculate the entire boundary layer within this cell would produce inaccuracies. This is of course just a guess. Also a Y+ of 800 could have very different values based on the speed or reference length being calculated. Knowing that the boundary layer is very close to the wall geometry, i would bet that a better representation of the BL could be measured, with multiple cells encapsulating the lower side of the Y+ range.
From what i have done with these calculations, and from seeing the resultant mesh, it has been extremely beneficial, even if what i have done is wrong, because the relation of the needed Y+ first layer cell size, the final layer cell size (for the overall thickness ratio), and the total boundary layer thickness ( only needed to see what upper Y+ value we are using) have helped to understand how these all interact with the surface refinement sizing for the geometry.
Here is my reasoning:
-
Based on previous meshes from last year, with 32 cores available, I must have a total cell count under around 20 million cells for the mesh and simulation to run successfully. This requires a surface refinement cell size that is large enough to ensure that i am not using too many cells, but small enough that smaller geometries are correctly meshed. (For what i have shown around 0.0075 mm for larger surfaces, 0.00375 for smaller)
-
Since my surface refinement sizes are unfortunately running the show in terms of how small and accurate the cell coverage is, this partially effects my first layer Y+ cell size through the correct final boundary layer cell size. (3rd cell size). This is due to the relation that must be held between the final BL cell size (3rd cell size) and surface refinement through the Final layer thickness RATIO.
- This is what you meant by a graceful transition.
Shown in my previous post, my 0.00375mm level 8 boundary layer calculation resulted in a 1.6 value for the final thickness RATIO. this means that the final boundary layer cell size is LARGER then the surface refinement cell size. This was needed to keep the same Y+ range for level 7 and level 8. (this was Y+ min = 100 to Y+ max = 540)
This did not have a graceful transition
- In order to uphold this ratio and not have outrageously different cell sizes between the two levels, calculating the final layer thickness for level 7 shown here and also in previous posts:
0.8 = X / 0.0075
X = 0.8 * 0.0075
X = 0.006m
0.006 is our 3rd layer cell size. Using this we can calculate back by finding the closest expansion ratio to achieve our Y+ = 100 value we calculated.
My reason for re-explaining this is to show that our surface refinement cell size (0.0075mm) cannot be changed due to the limitations from #1. This results in a specific final boundary layer cell size (3rd layer cell size, in this case 0.006mm)
UNLESS
the Final layer RATIO is changed outside of the recommended range. ( in the case of using only 3 layers)
OR
Increasing the layers to, for example. 5. This allows for minimal change to the final layer cell size (if the expansion ratio isnt too aggressive, which it shouldnt be) and increases the overall Boundary layer total cell size (all layers added together) which increases the upper limit of the Y+ range. Since a larger final layer (5th layer) is created, the Final layer thickness RATIO can be closer to the recommended range (and a more graceful transition made)
This is why i think it is important to know before hand what the correct Y+ range is. That way you can know where each layer lands, the difference in size between each layer, and if the BL is being measured correctly.
Im sorry if i repeated a lot from previous posts. I wanted to make clear what my though process is.
Now the question is, what should my range be. Not sure what is the most important factor in accurate results
Is the most important having the first cell within 30-300 and nothing else really matters?
Does it matter if the rest of the layers are even near lower Y+ value?
Does having multiple layers in the lower side of the Y+ range (30-400)better then having them towards the higher side (300 - 800)?
I really feel like my current Y+ = 100 value at 0.002165 or 2.1mm thick is more accurate then having a Y+ = 540 at 0.01172 , which is 11.7mm thick. I find it hard to believe that having an 11mm thick first cell can accurately measure most of or the entire boundary layer correctly.
- Correct me if im wrong but my next move is to change the BL to 5 layers,
- decrease my first layer cell size slightly (maybe Y+ = 50 or 80)
- Keep around a 1.3 expansion ratio
- Keep a Final thickness RATIO of around 0.4-0.6 to gracefully transition into higher level surface refinement cell sizes
For the higher level wing surfaces:
- Consider changing to 6 or 7 layers
- keeping the same Expansion ratio and Final thickness RATIO due to extra layers.
The goal is to decrease the region refinement levels, and possibly certain surface refinement levels so that the total cell count of under 20 million can be achieved.
Dan,
I think it is not possible to combine all of these ways I have suggested in one grand sweep on a complex geometry…
I would approach the ‘y+30,300,800 test to minimize cell count while maintaining results accuracy’ should be tested on a relevant but simple geometry with a layered mesh of low cell count but finely resolved where needed. Many runs with different layering would need to be made…
I do not have the time to do that right now.
The current approach you are taking is similar to Dylans approach here At the end of that topic I was confused, but since then, I have decided that he uses a y+ value formula for each layer and he uses those values to determine how many layers he needs at any specific ER to fully encompass the turbulent BL zone… Maybe you can use his formula which he has proven to himself…
Thanks so much for the link! I will look at that tomorrow.
EDIT after reading through this post (the beginning was super confusing but most likely useful when i get into all the simulation settings UGH.) Once Dylan stepped in, his reasoning was sound. but i dont think its necessary for me to do such a large comparison as you did.
I agree the best method would be to do a smaller test with multiple runs using different settings. Right now im not sure i have time for that either. EDIT I will make time. However i have said such things before on other projects and ended up going with the more work/better result route.
If i did do this test, i would most likely use a multi element wing as this would be the most important area to get right.
EDIT My new approach is to attack the rear wing with different layering techniques. The best results will then be applied to all wing surfaces on the full model. Method is as follows:
- Half wing symmetric simulation (i know you said to avoid these but i wish to pump out many runs quickly)
- wing surface refinement at 0.00375mm or smaller.
- split faces and surface refinements for large surfaces (endplate) and small (wing profiles)
- Y+ first cell size test 30, 50, 80, 100
- layer amount to match with region refinement level from full car 3,4,5,6 layers to keep recommended expansion ratio and Final layer thickness RATIO
- Y+ max range test without changes to ER or FLTR, 300, 500, 800
I really appreciate you sticking with me for so long.