I mean if YOU wish to proceed with this test, while i continue with the same cornering simulations in a straight wind tunnel then we will have an excellent data set.
I just dont want to commit to this extra work when i still have the rest of my research for vehicle dynamics to do, get the car prepped for testing, and start writing the damn thing. I really dont want to make this stressful at the end.
P.S. I still really do want to do the curved tunnel
EDIT: I should really send you the full solidworks car model. I designed it with adjustable suspension so changes to geometry can be made quickly The tutorial for what i did is here
EDIT: Rhino imports Solidworks fairly well, or I can steal your 2020 wheels turned geometry at some point from a SimScale project if it is step format imported…
Ok whatever you want. If you have the original file you can change the pitch, roll, yaw, ride height, and steering angles to whatever you want. Im not sure if an imported STEP can do that. Either way ill be importing the cornering geometries for each case in the next couple weeks.
haha no drifting, although that would be sweet. Im not exactly sure what speed yet i have to talk to who was in charge of last years vehicle dynamics development. This is where i have to decide to do real world testing first, then use that data to as inputs to the CFD or vice-versa. I can get approximate data for this but the goal is improving our times/lateral acceleration not just comparing results
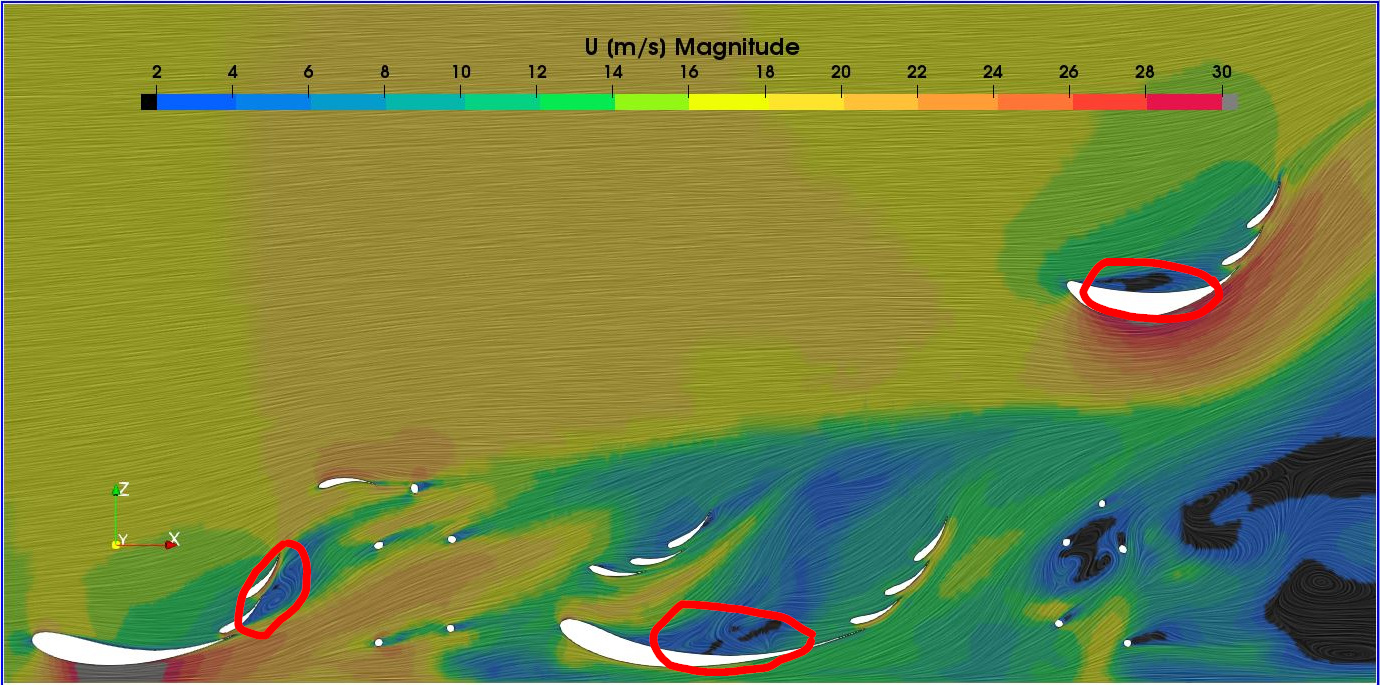
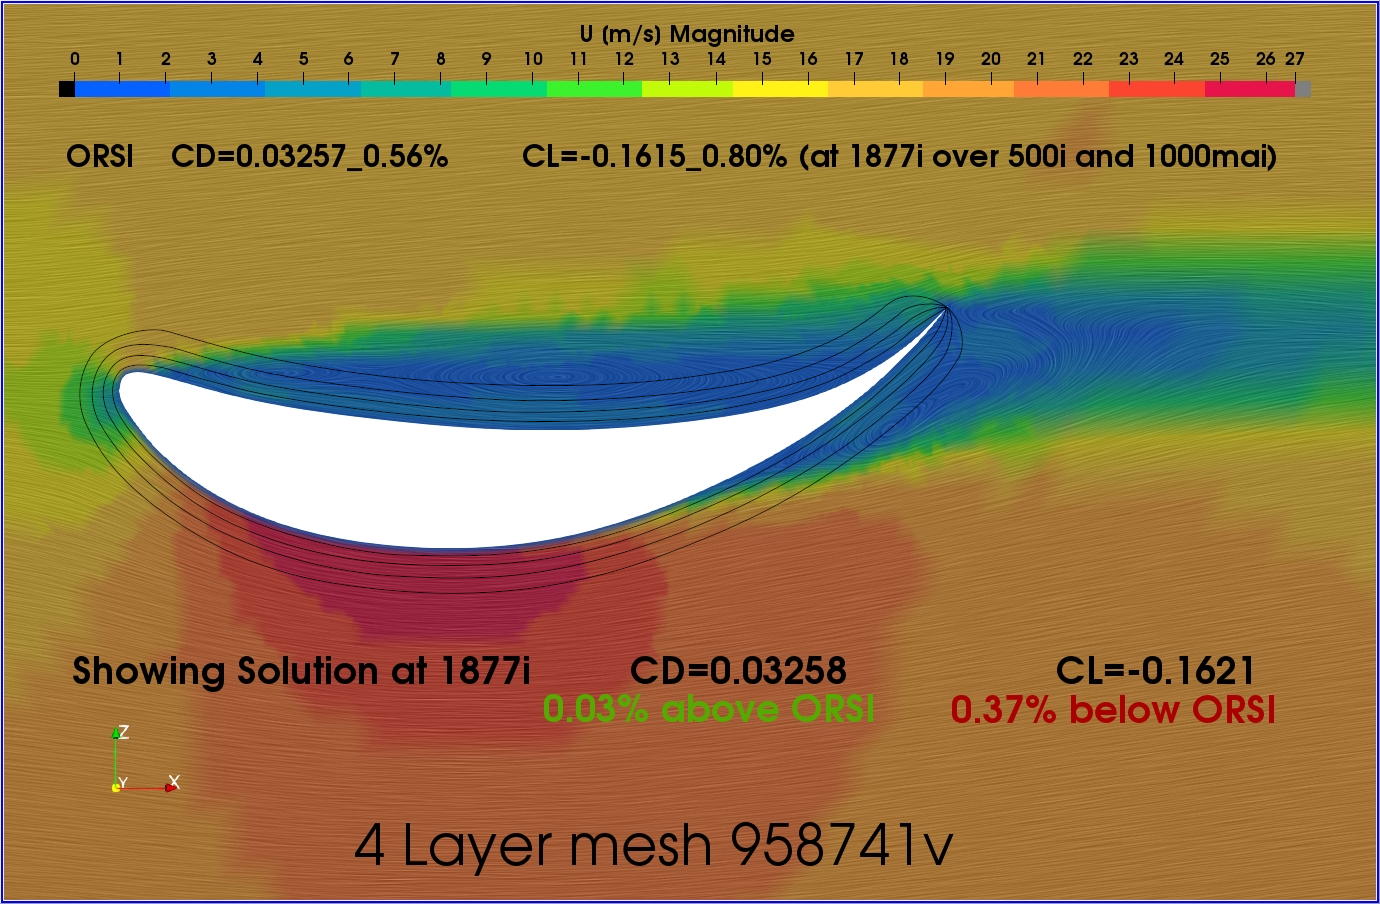
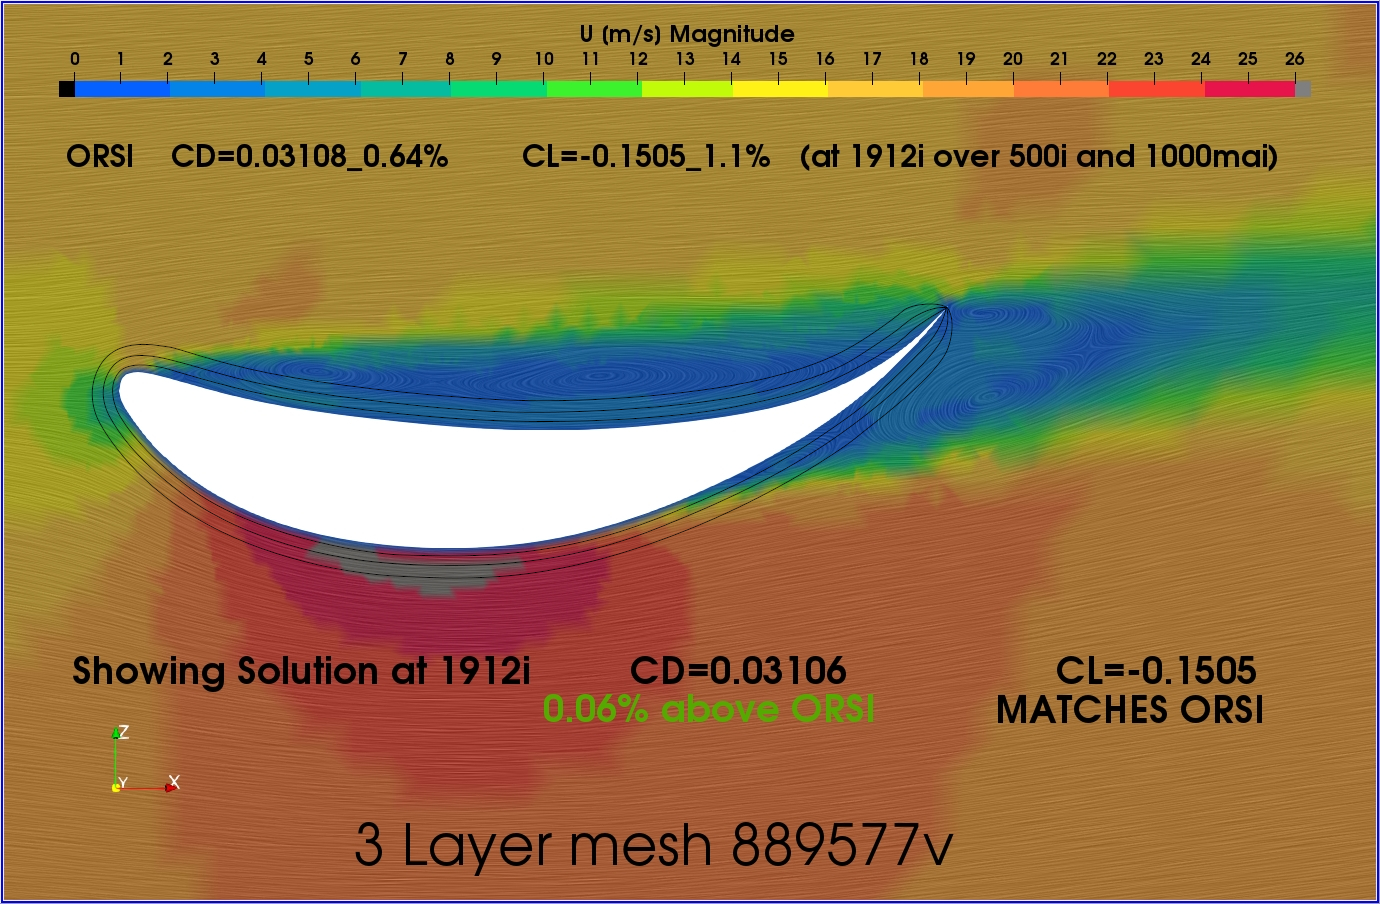
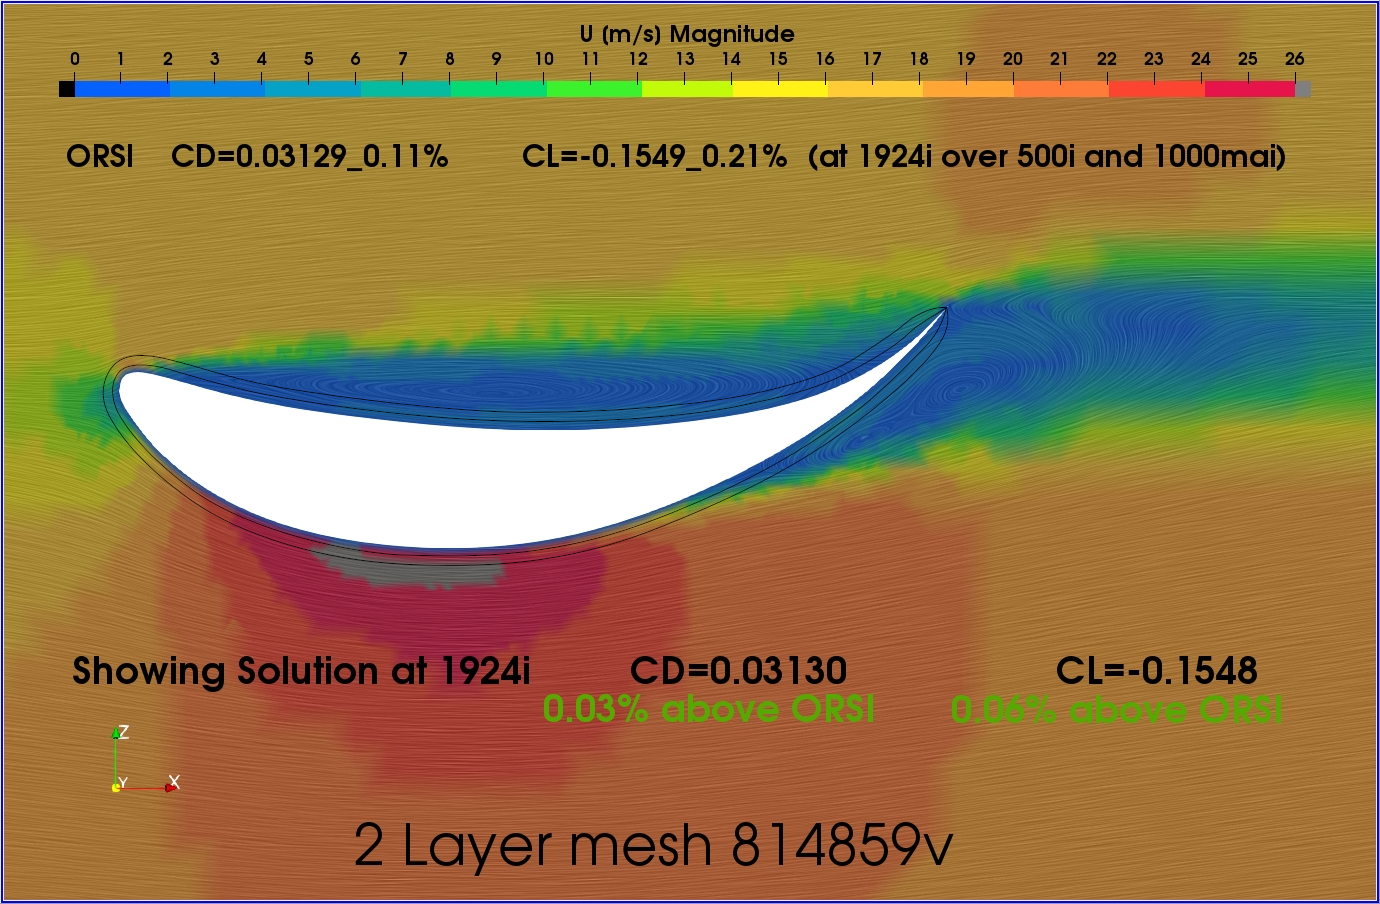
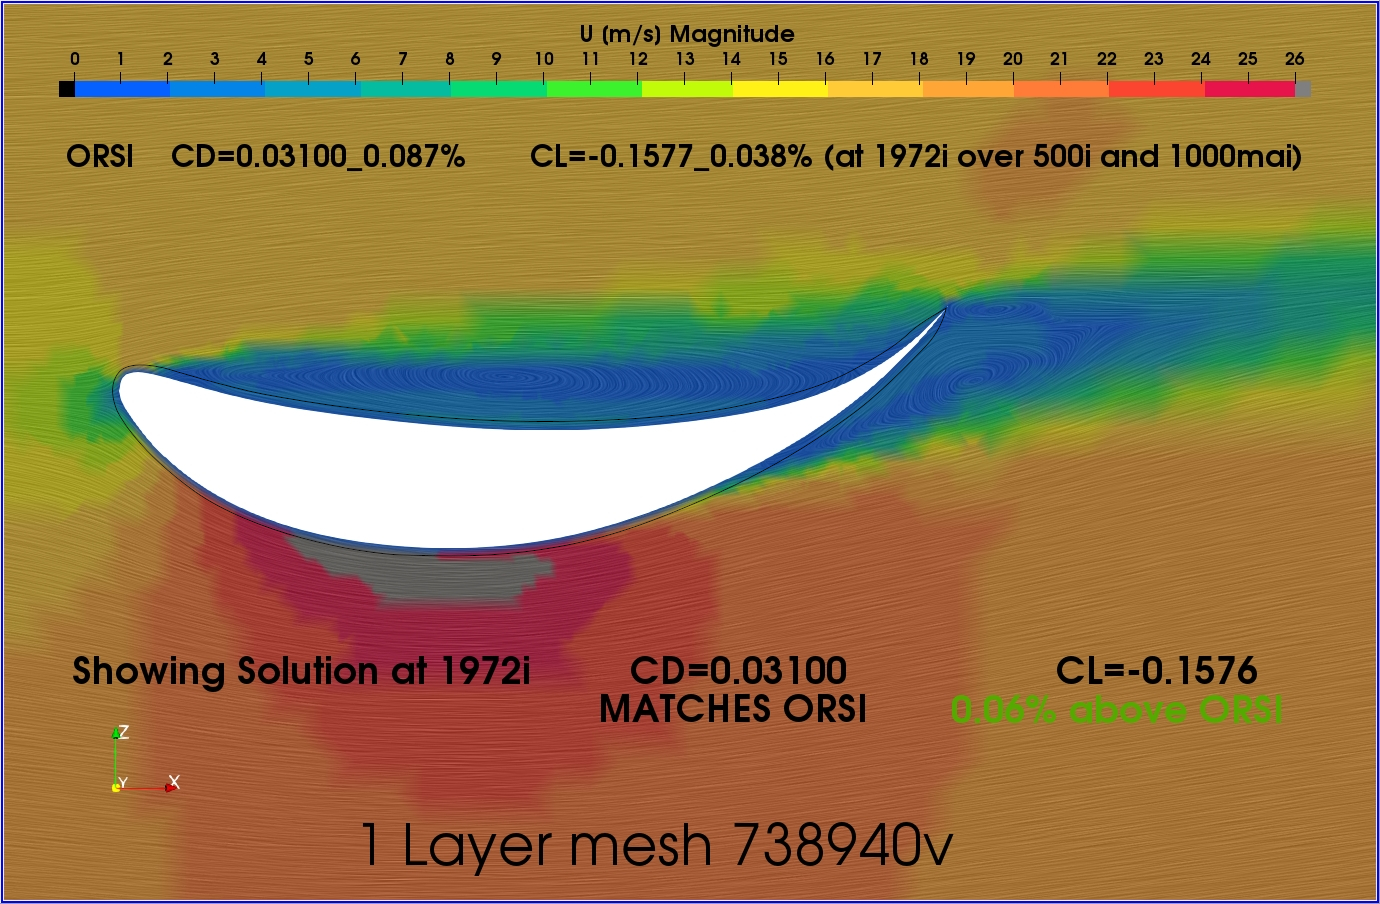
Looking at the underside of the wing, the separation location is about the same for 4,3,2, layer sims but in the 1 layer sim it stays attached longer.
Looking at the outbound wake direction (far right of the picture) i notice that 3 layer and 1 layer are turned more upwards, while 4 and 2 layer are straight or downward facing.
At the bottom of the wing, where the Dark red area is around the gray area, in the 4,3,2 layer tests this dark red is about the same size while in the 1 layer it grows bigger
Any thoughts on this or would you consider this just variations in flow?
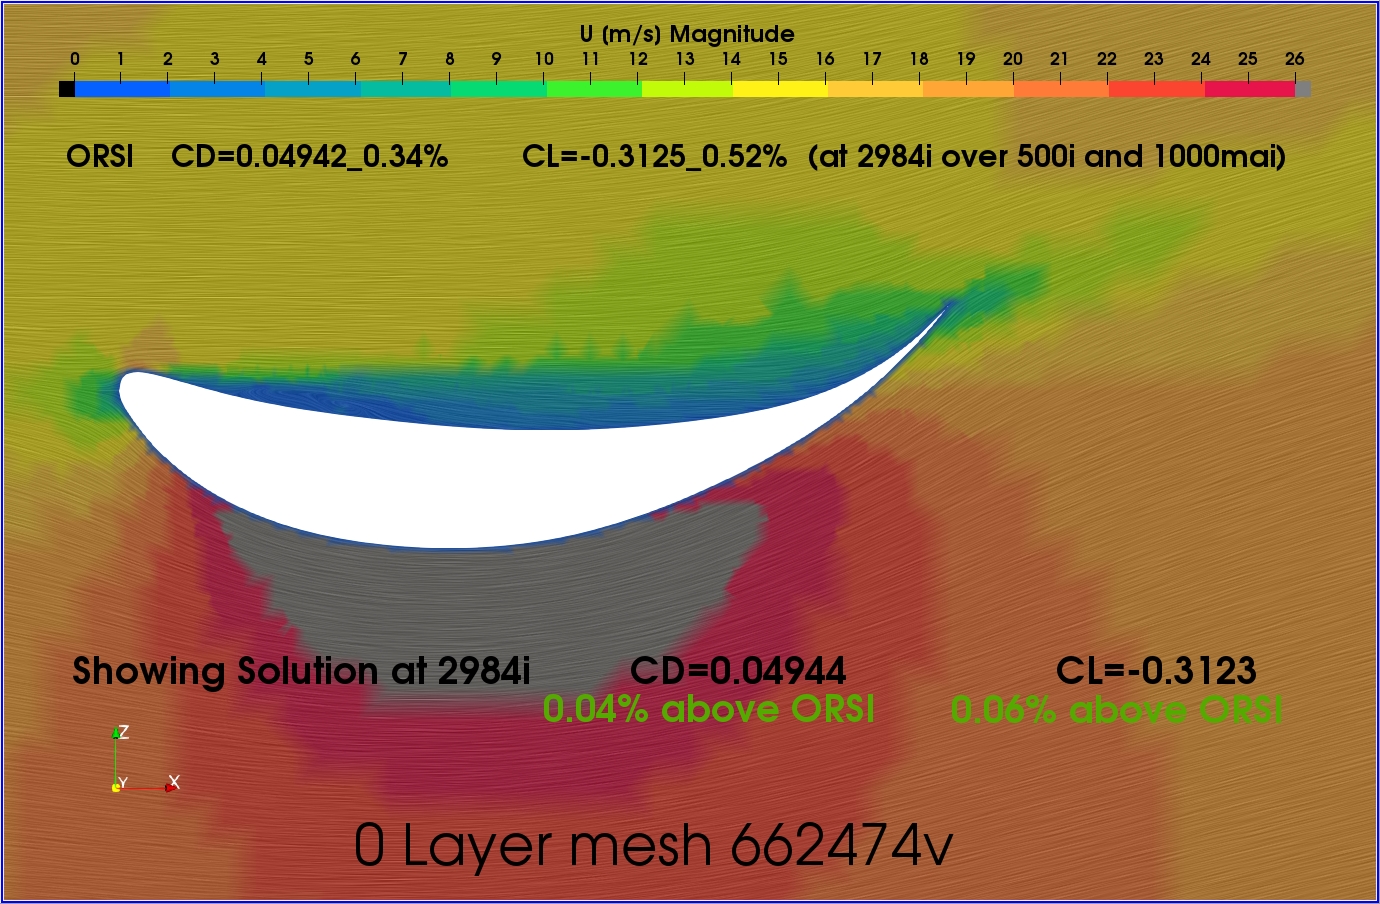
I am not sure but the 0 layer obviously has to be significantly different because of the major difference in CD and CL with ANY layered mesh…
I am showing the full solutions sets at the iteration that closely matches ORSI values, so that removes that issue (some even match to 4 significant digits )
The CD and CL of all layered meshes are pretty close to each other and I don’t know if we are seeing true differences between # of layers in the U mapping or flow patterns yet… I hope we are, as that would be awesome…
What I find really interesting is the fact that 0 layer flow is almost not separated at all!!! (just a little in the camber area)
Yea i forgot to say that your ORSI% difference values are spot on!!
Im not sure if its flow patterns or not, but for me… three simulations have one point of separation, and one has a later point. Unless this is a fluke, this points to something. Maybe running the 0,1,2,3,4 test again with the wing at a different AOA? See if the pattern of later separation for the 1 layer simulation is still there?
yes the tuft test will most likely be done first at a straight line run for a basic setting. Then at each skidpad radius and comparing the best overall setting. We can change the AOAs for each event though.
Maybe if the 2,3 and 4 layers pointed to the fact that they are giving better CL and CD values that could be related to having a slightly further forward separation point on that surface, but they do not seem to point that way with the way CD and CL vary over 2,3,4. Also 3 and 4 layers get that 2nd eddy developed in the camber region, so double whammy for predictions of what is happening here…
Did you not tuft test those wing packages when they were put on to begin with, that largest chord wing just looked wrong incidence angle to me before I saw CFD results Tuft testing will not tell you that you have the wings set for most downforce but I think for sure they won’t be at most downforce incidence with separations like that.
I would have liked to do a tuft test but literally all of our testing time from last year was just getting the car to work. Then came suspension setup and torque vectoring. In terms of a driving car, aero is last on the list
This wing profile was from the 2018 season, developed by the previous developer. Same for the front wing. Knowing i had no help for aero design, i had to make decisions on where to invest my time, so i left these alone. I focused on a turning simulation with many different geometry setups to improve overall performance.
You have the 2019 cornering simulation project now. I had about 20-25 different geometry changes to test how the aero packet worked and influenced the packet as a whole.
The current aero developer for the 2020 car has already noticed and changed this wing profile
I am sure you have seen my 01234 project, but I have just made a lot of text and conclusion changes which you might have missed if I didn’t mention them now
I did see it but i just read through it again. man that is a good post, super concise and explains your entire hypothesis, reason for the project, benefits for 1 layer approach and conclusions. Im glad you made this project because now i want to quote your post as a source in my thesis!
Only thing i would add is to mention that this was all done with absolute layering.
I found quite detailed explanation about Drag Reduction System (DRS) in F1 cars (not in FSAE cars), and it helped me to understand @dschroeder problem, as I was a patient reader of that long thread, but not grasping the subtleties. It could help other thread readers to understand how important correct meshing and simulation is in that case.
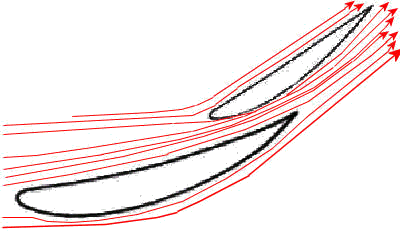
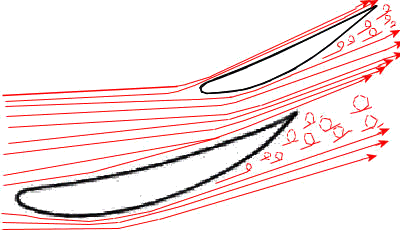
Adjustable rear wing in active - deployed position. Stall condition appeared. Airflow around the wing separates from the surface of the wing decreasing its effectiveness, reducing downforce and drag in the same time:

 )
)