Thanks for the link!.. Our team has thought of uisng DRS on our car for the past few years. However, every year the focus is placed on other areas of improvement. Implementing a DRS system is a decision that must be made and kept at the very beginning of the season because it effects how the wings are constructed. We also must consider the effects of adding these systems such as:
- Extra weight from Pistons/servo-motors
- Extra complexity in design stage.
- Integration of new systems for electrical team (more work for them)
- Activation method (manual or automatic -combined into torque-vectoring system)
- And Most IMPORTANT - validation of increased performance VS non-DRS
I think our team is one or two season away from adding DRS. It all depends on what the lead Aero developer wants to focus on.
There are not many long straights on the FSG track but I do think it is worth having on the car. Since we are driving at such low speeds, our wing setups are very high Downforce and therefore very high drag. Reducing this drag has big benefits on acceleration potential.
1 Like
Looks interesting except I do not think what they say about those flow patterns makes sense…
I will have to look at a sim results before I say what I think, so the results can back me up 
This goes on my ToDo list
AND, here I go again…
I decided to use 3 layers and mesh the 01234 geometry to yPlus area average values of 34,52,102,182 and 197 (again to a very strict y+20-300 range)…
These results shock me…
Do you see the strangeness that I see 
Is this showing a correlation between Y+ area average and the Coefficient of Lift? As in, the larger Y+ average value, the less lift we get?
It seems to show more than expected variation from Hi to Low ORSI CD and CL over the accepted range of wall function yPluses…
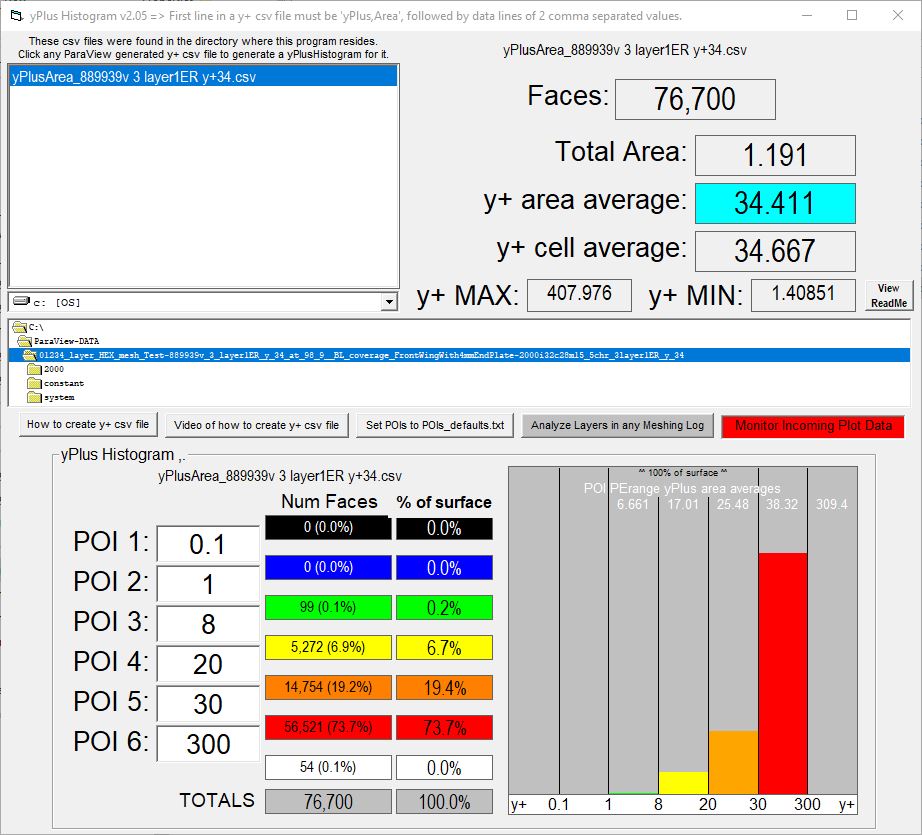
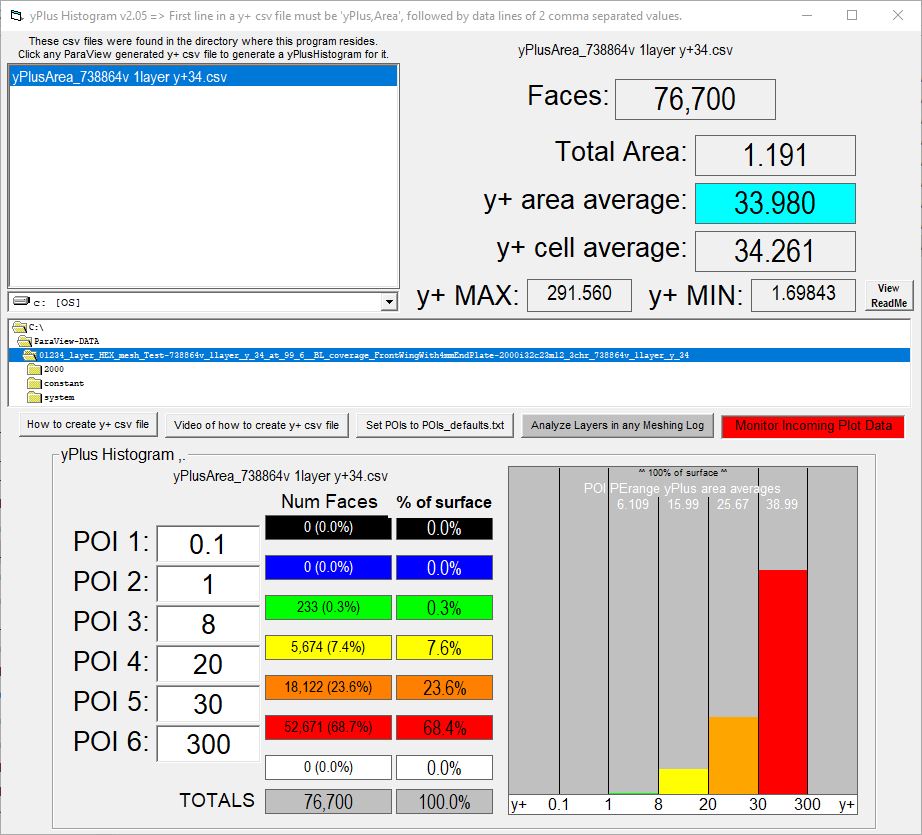
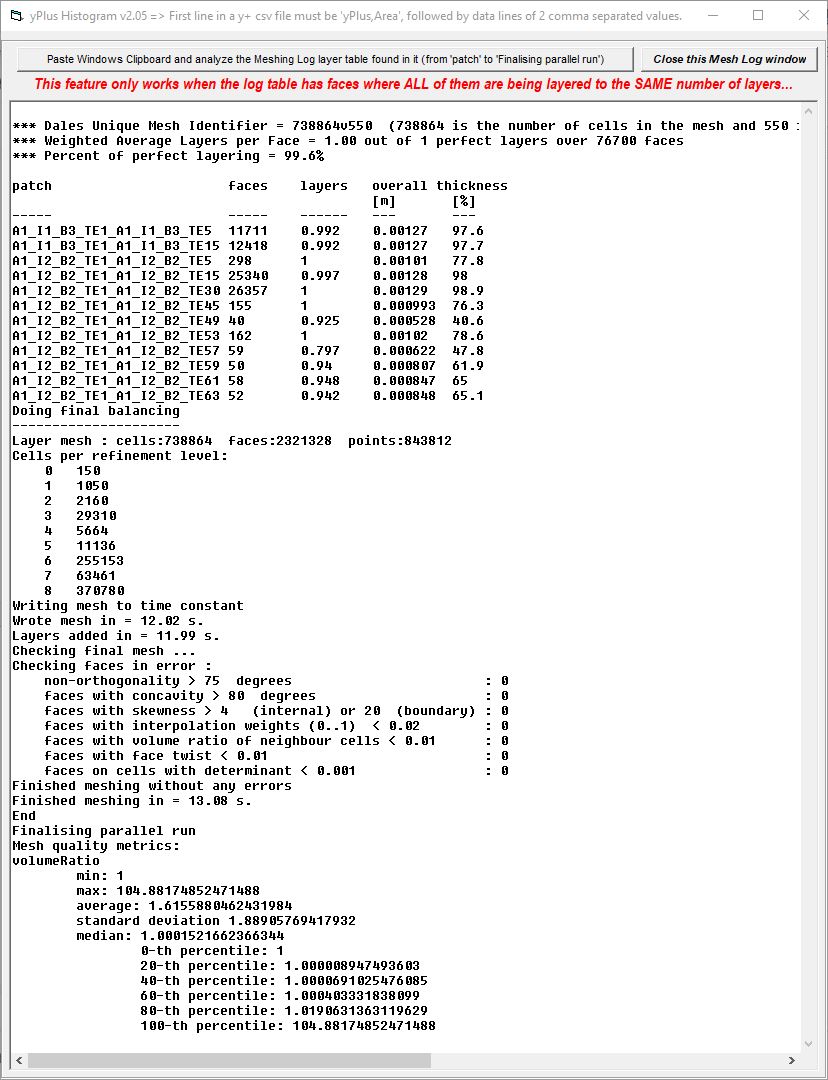
Also, the y+34 mesh almost has to be discounted due to the seemingly significant negative affects on the ORSI CD of having yPlus values in the <20 range (6.9% in this case as you can see by the below yPlusHistogram for the y+34 mesh):
.
Here is the y+52 histo:
.
The y+102 Histo:
.
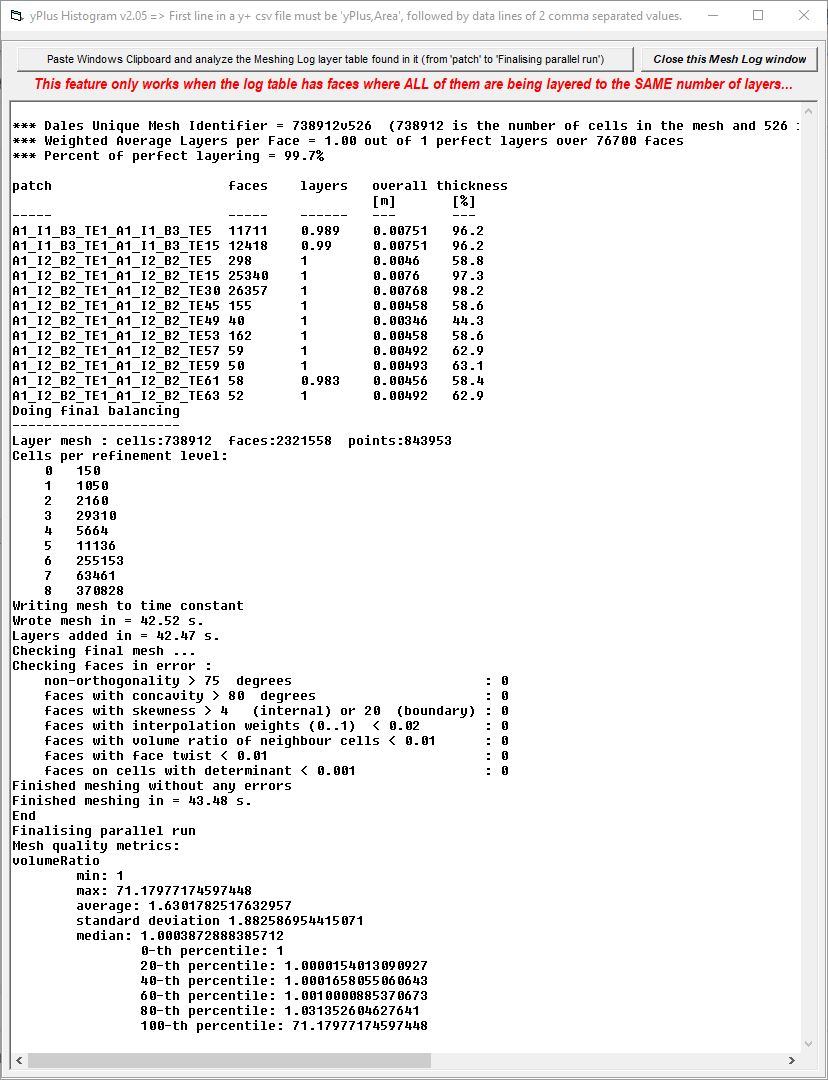
The y+182 histo:
.
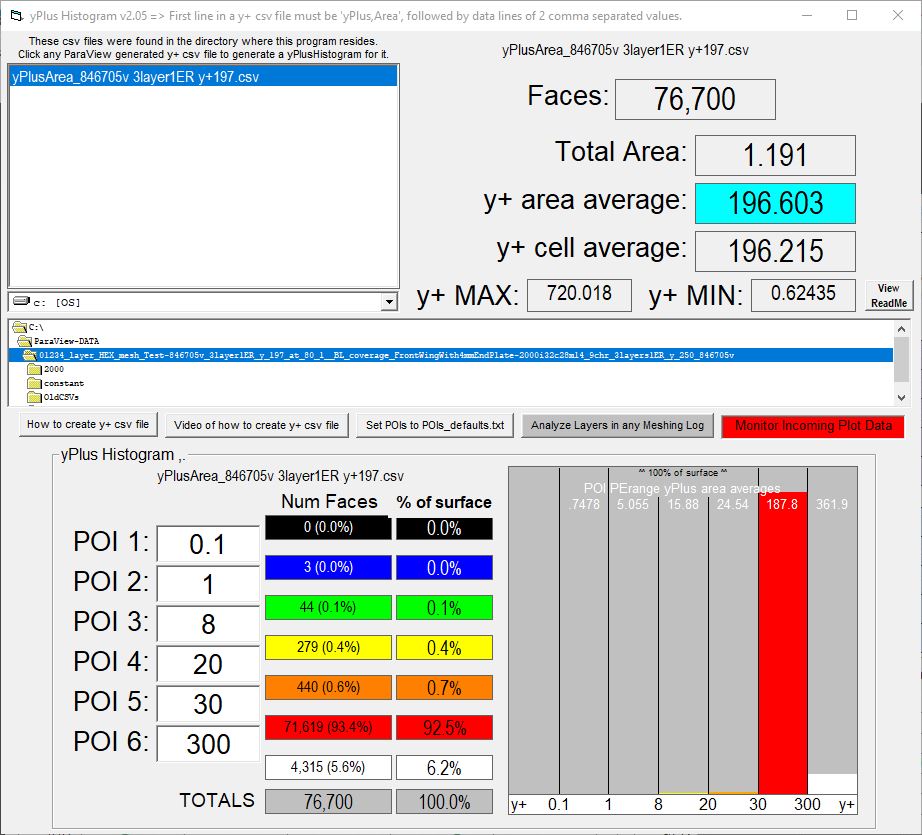
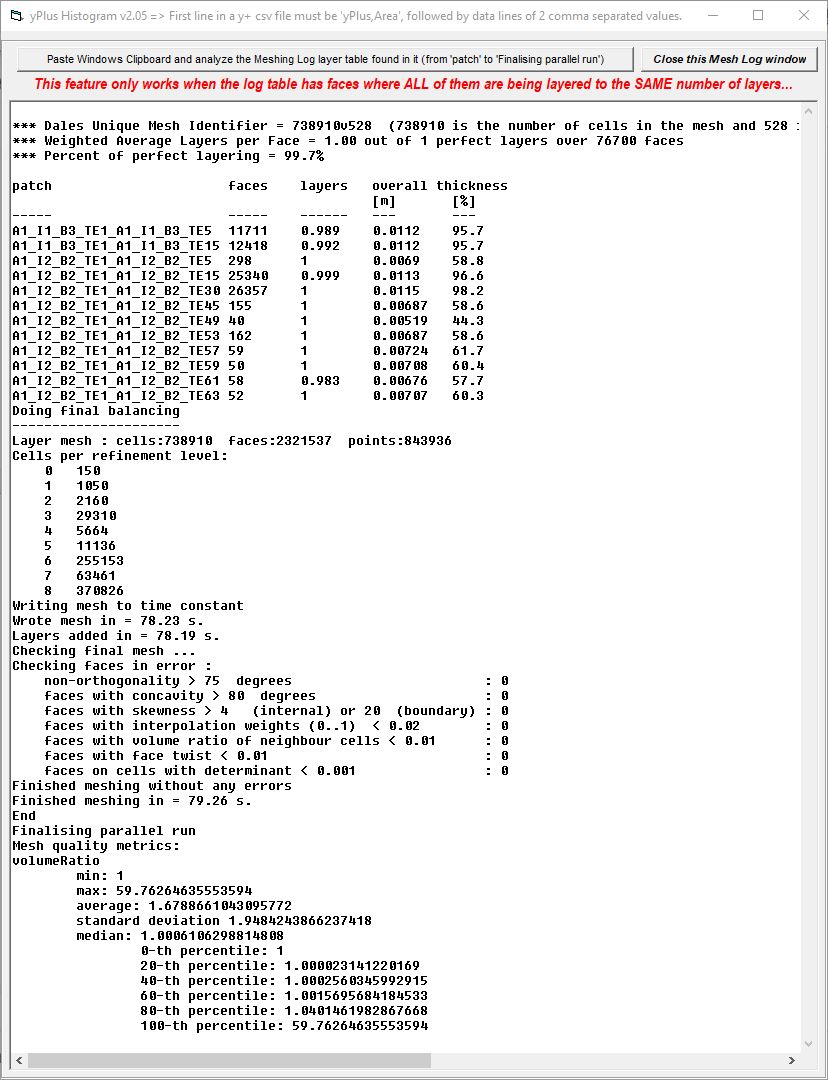
And the y+197 histo:
Hmm do you think extending the upper range of Y+ Area average would help? maybe the results of Cl will taper off to a stable number? The only somewhat definitive answer for which Y+ area is best, would be at Y+ = 100 because this is where CD switches from decreasing to increasing, The biottom of the curve.
Yep, I am already trying to mesh a y+400 ish …
So, I could only get to y+197 and still have a possibly reasonable 80.1% of the # of faces requested on each face…
If I wanted to get above y+197, I would have to make the surface Hex cells on the geometry bigger which would invalidate that mesh compared to the others in this series wrt cell count and adequately resolving, in the mesh, the tighter curved surfaces and small features of the geometry…
I added the mesh to the results table just to have another mesh we could discount  and added its histo with the others in the above posts…
The y+197 sim run seems to show that we are running into issues with having such a low 80.1% of the # of faces requested on each face, so we likely discount y+197 too.
So, I am not sure where to go from here yet, but I will likely run this ‘y+ spread test’ on a 1 layer mesh at y+ 52, 102 and 182 to see what its results look like…
that would be amazing, you are killing it with this project!
Thanks, but to be fair, it really has meshed well with a lot of issues I have had high on my ToDo list for a while now, this gives me incentive to do them
And, continuing with this latest unexpected discovery (during my 01234 layer investigation) of how yPlus area average significantly affects CD and CL values in wall function meshes…
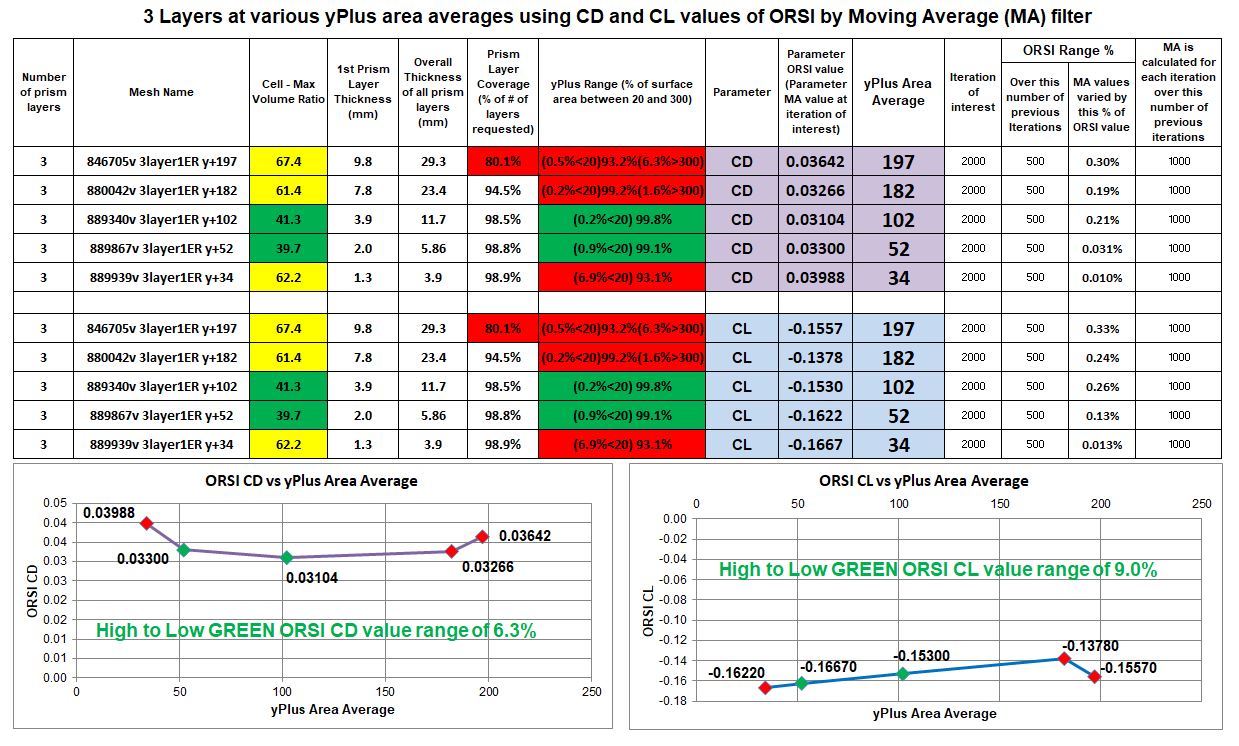
I am flooding this post with data to see if anyone can see a relationship that I do not… Right now, on what I believe is an extremely good (I think by anyone’s standard, with over 98% of the surface cells in the y+20-300 range) 3 layer wall function meshes, the CD and CL results vary nearly 30% depending in what y+ area average that I chose to mesh it at in the y+30-300 range.
Here is the current results table that shows the issue and here is the extended 01234 layer test project that has been continued into Stage 2 and Stage 3 to include all the meshes and sim runs of these next two tables. In my project, every Sim is reserved for a single mesh that has a fully converged and amazingly results stable Sim Run on them. There is no need to make a copy of the project so you can find the buried meshes that are used in any results table of mine. Please have a look at the project, meshes, sim runs and solution sets to see if you can find a irregularity that I missed:
In that table, I have added a column for a meshes ‘Cell - Max Volume Ratio’ (MVR) (from the meshing log) and I have highlighted meshes with MVR over about 40 as yellow and < about 40 as green… (not sure if that is a good
dividing point but this is a quality metric I have no experience with and I needed to start somewhere)…
Also in that table, I chose to look in-depth at the number of mesh cells <20 and >300. I decided to highlight in RED all meshes that had >1%ofArea <20y+ or >1%ofArea >300y+. If this is a good dividing point for this new proposed metric we can filter out a lot of meshes in the table and the CD and CL results now vary only about 9% over the two green meshes of this new metric.
.
.
.
.
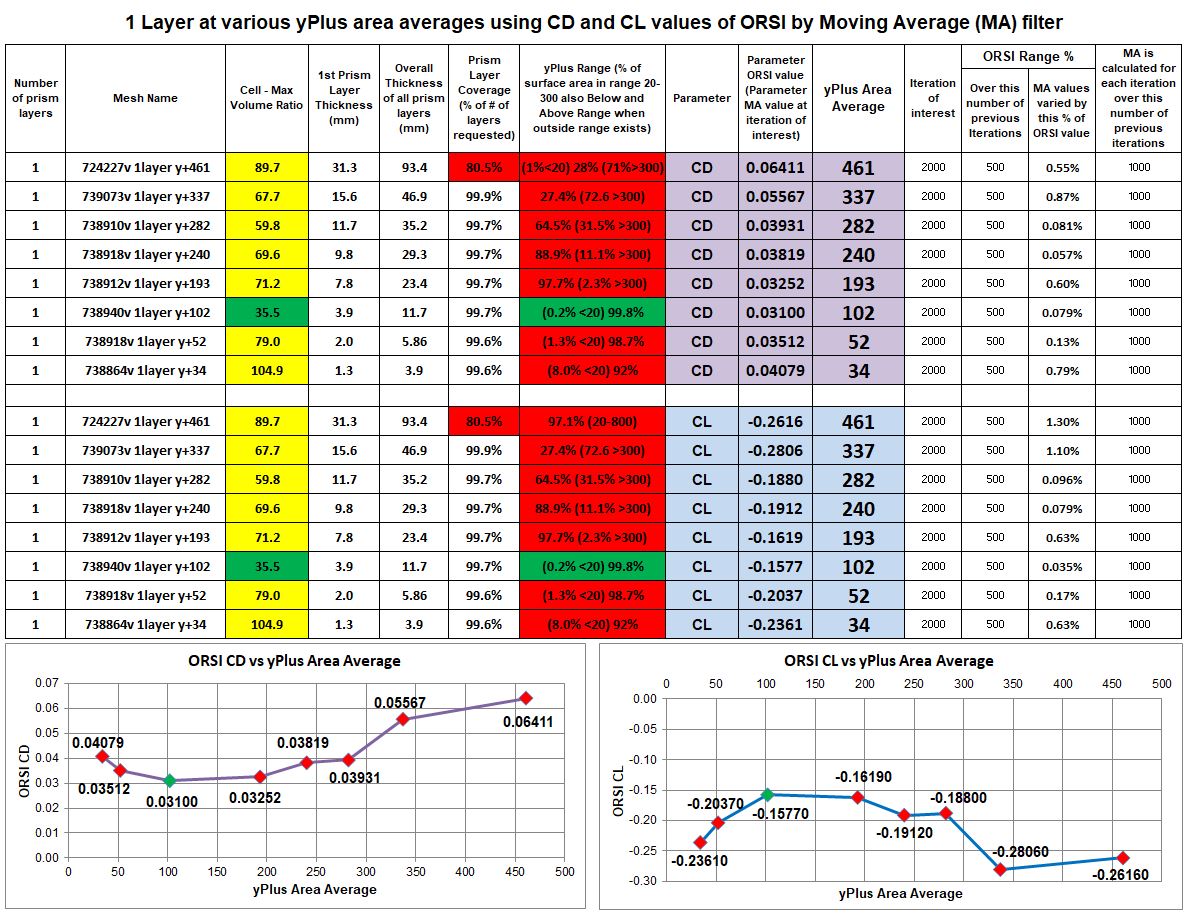
Then, I also ran a full range of y+ meshes with the 1 layer mesh and here are the results colored with the same metric ranges I discussed above and only 1 out of 8 meshes remain green:
Am I heading in the right direction to make sense of these results
I will edit this post and add all the Residual and results plots and histograms etc. now, which will make this post very long, but sometimes you just need to see these things quickly, all on one place to make sense of things
The impact of the changes between the following images is best viewed by clicking on the first image and then cycling through them with your Left and Right arrow keys.
I will start with the 5 yPlusHistograms of the ‘3 Layers at various yPlus values…’ table:
.
.
.
Now the 8 yPlusHistograms of the ‘1 Layer at various yPlus values…’ table:
!
I decided to put each series of images in a new post…
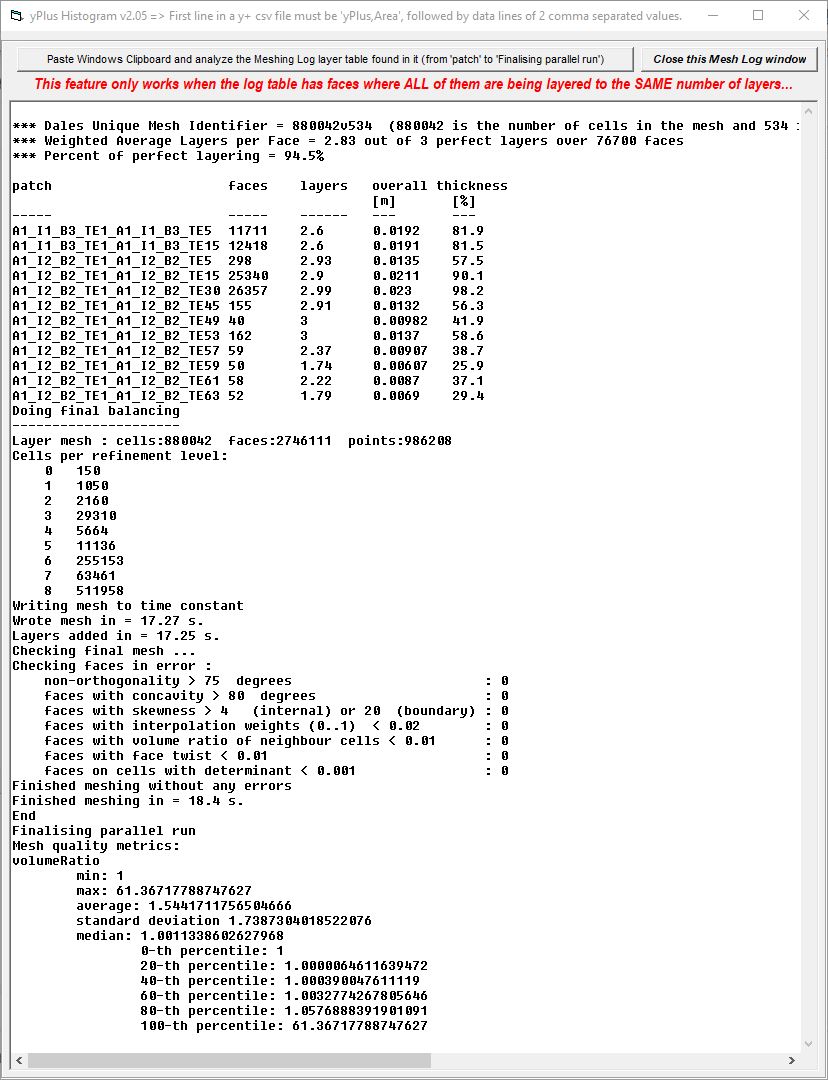
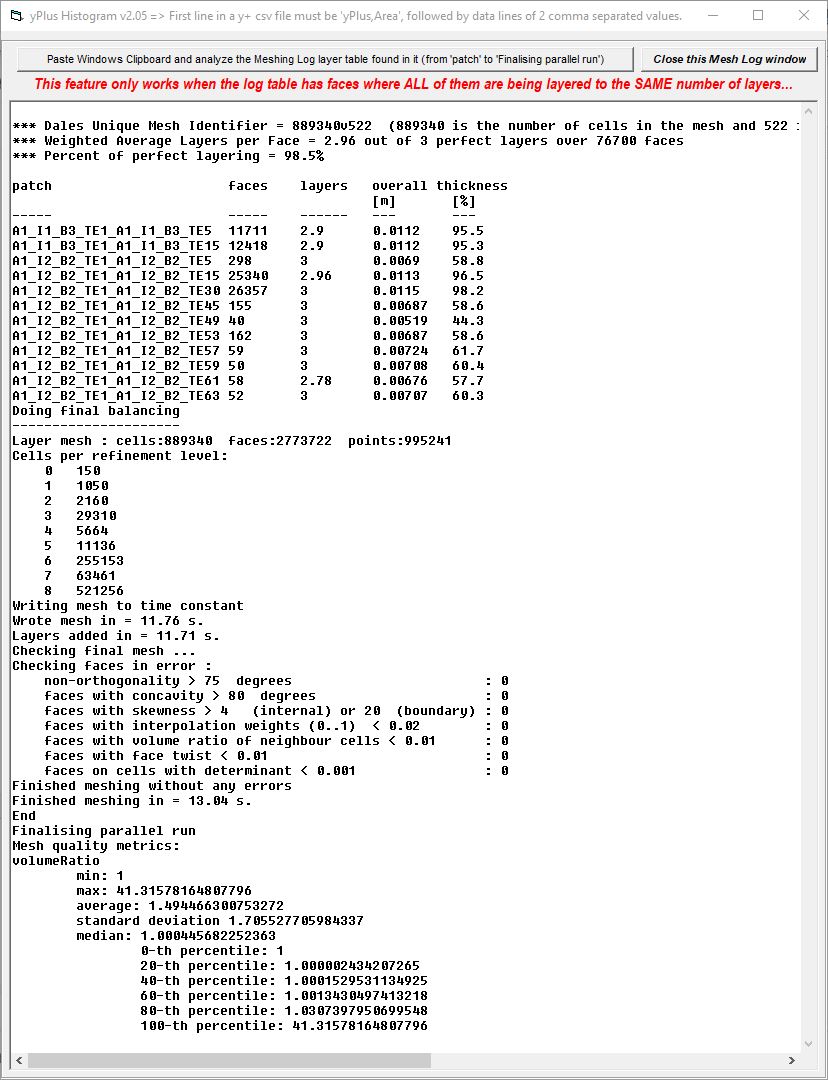
Here are the Meshing Log Analysis for the 5 meshes of the ‘3 Layers at various yPlus values…’ table (descending y+ area average in this order y+ 197, 182, 102, 52, 34):
.
.
.
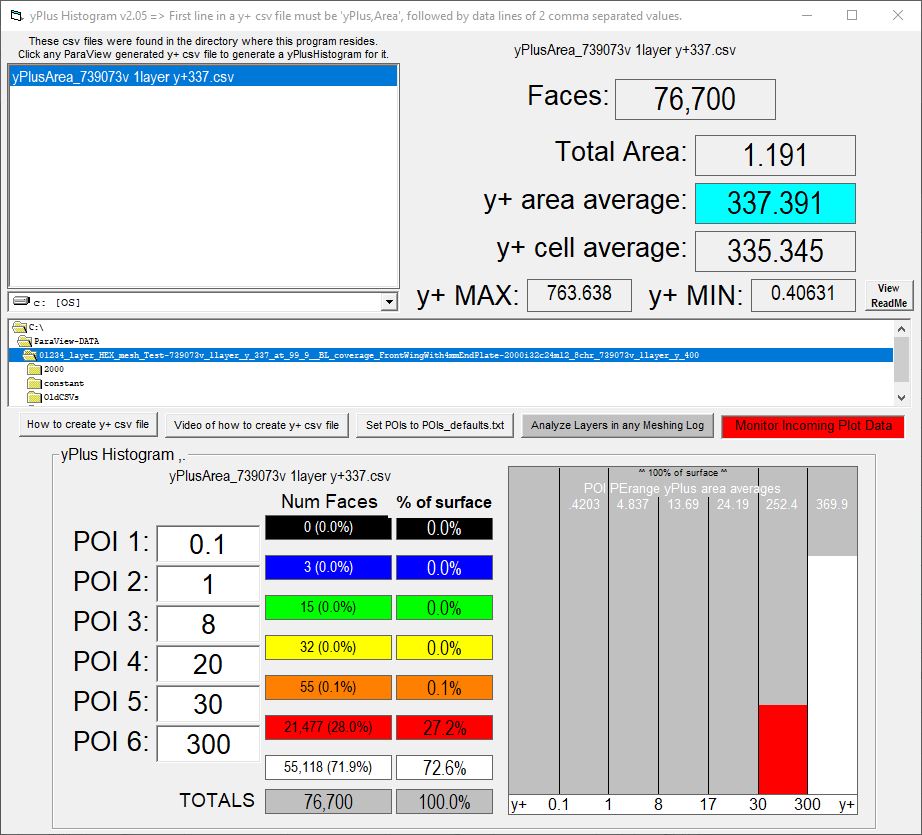
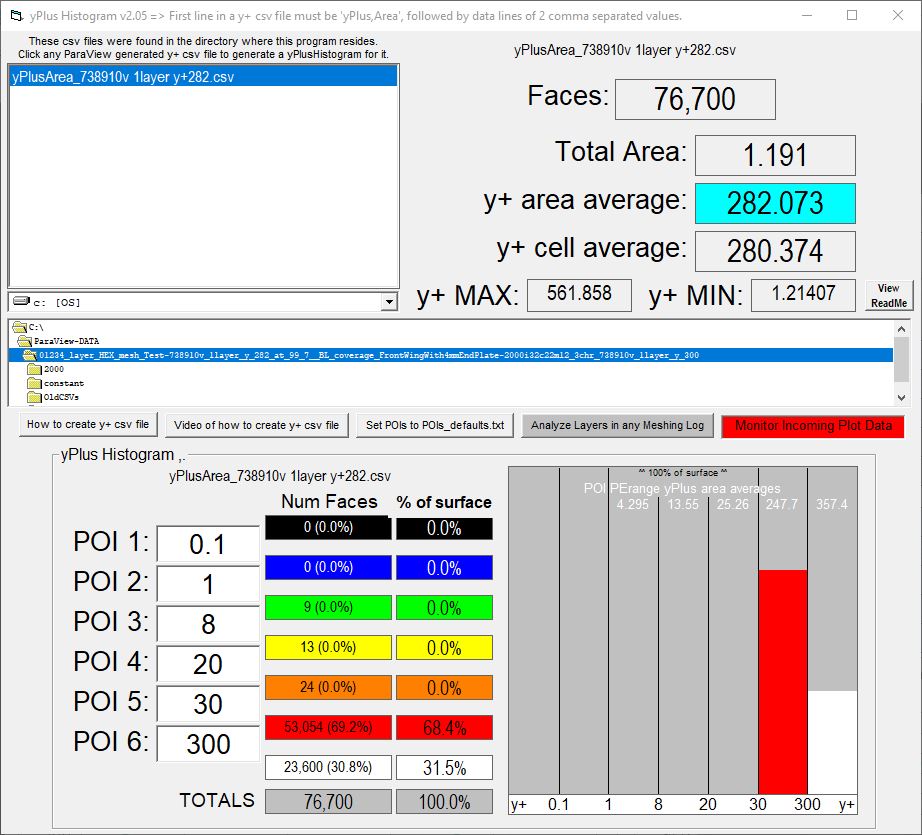
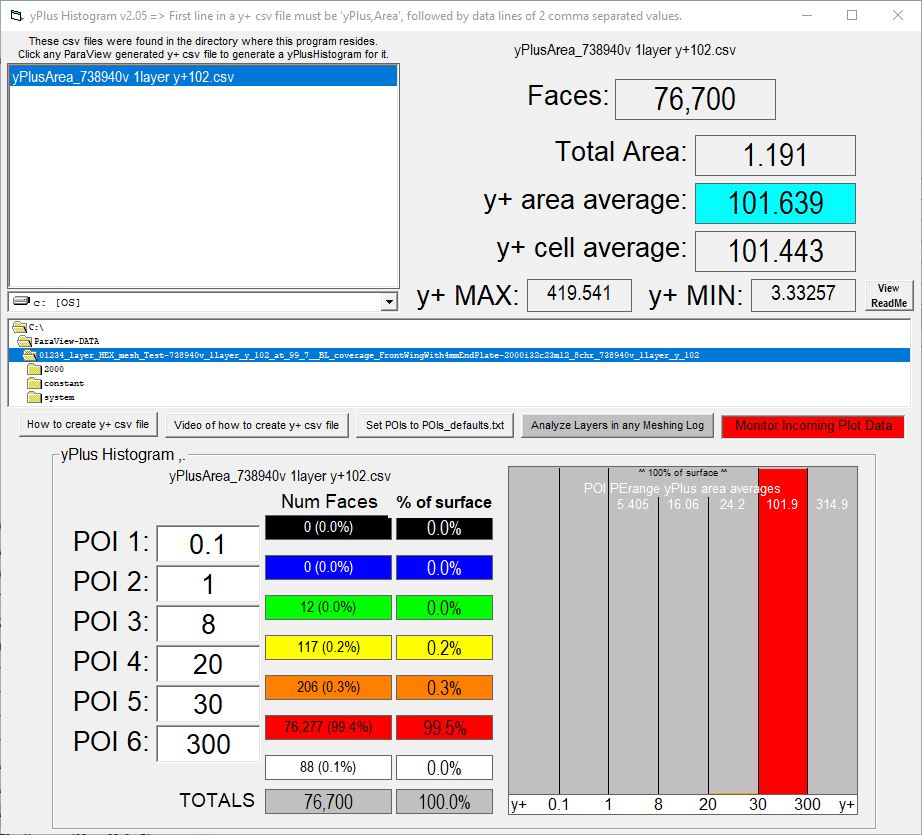
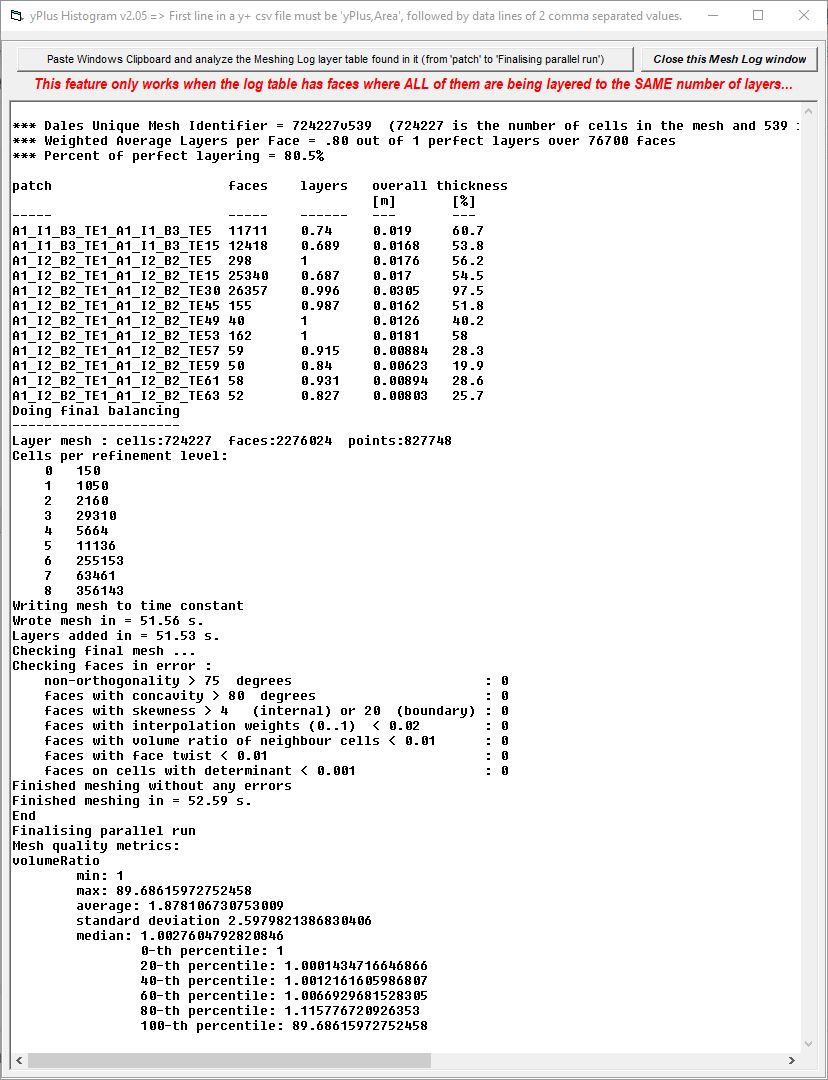
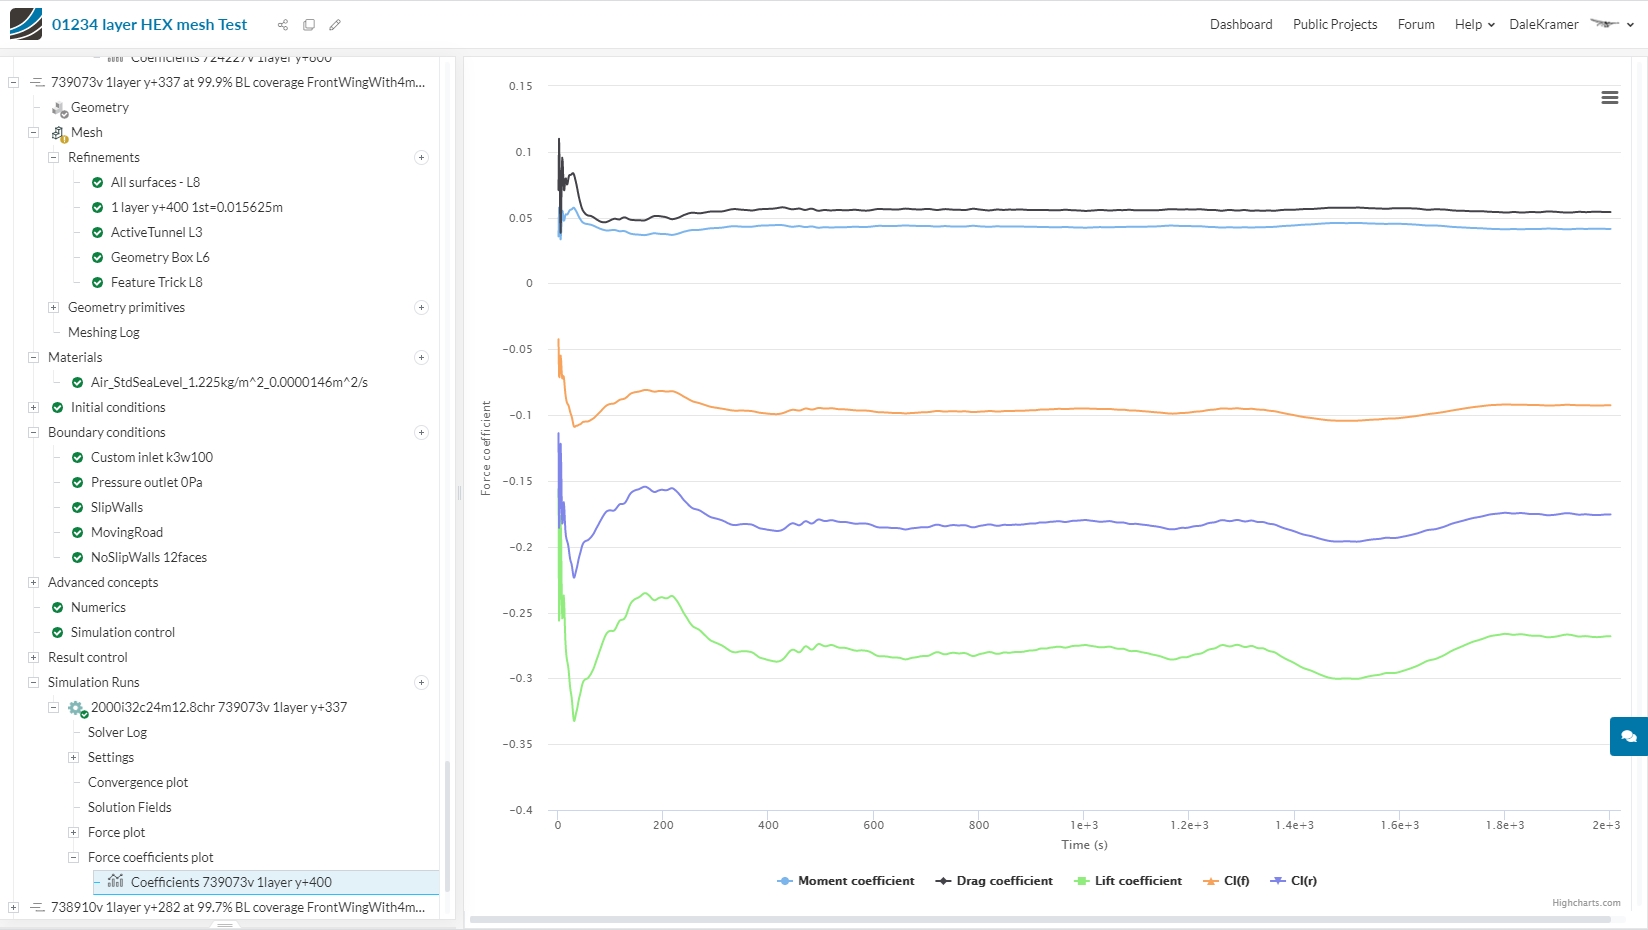
Here are the Meshing Log Analysis for the 8 meshes of the ‘1 Layer at various yPlus values…’ table (descending y+ area average in this order y+ 461, 337, 282, 240, 193, 102, 52, 34):
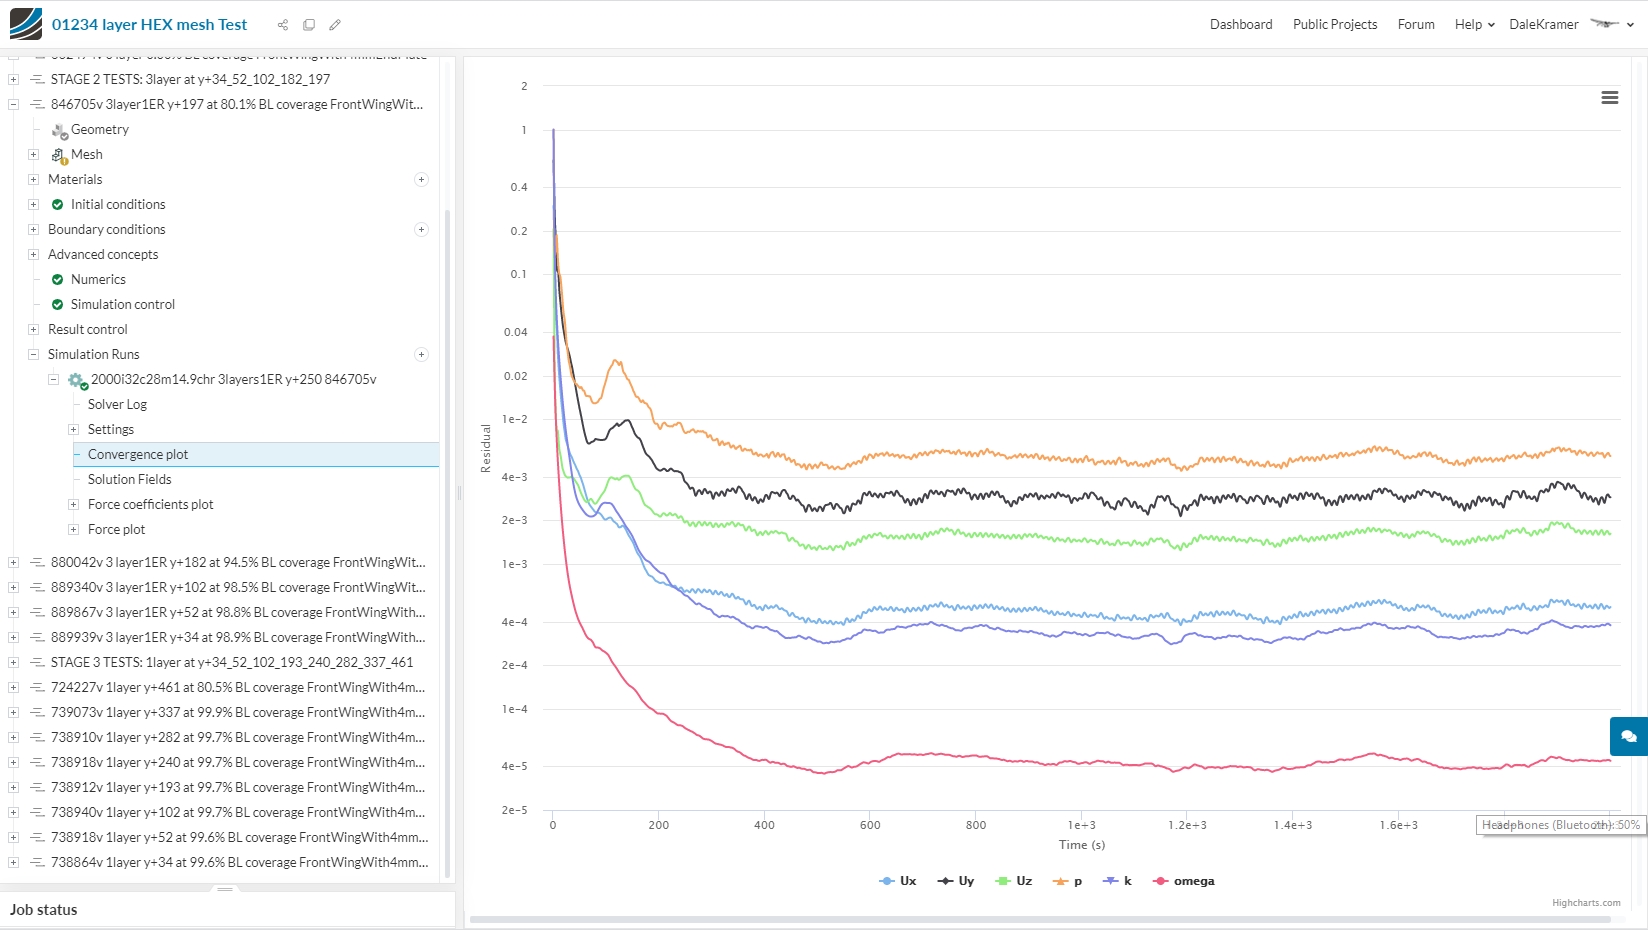
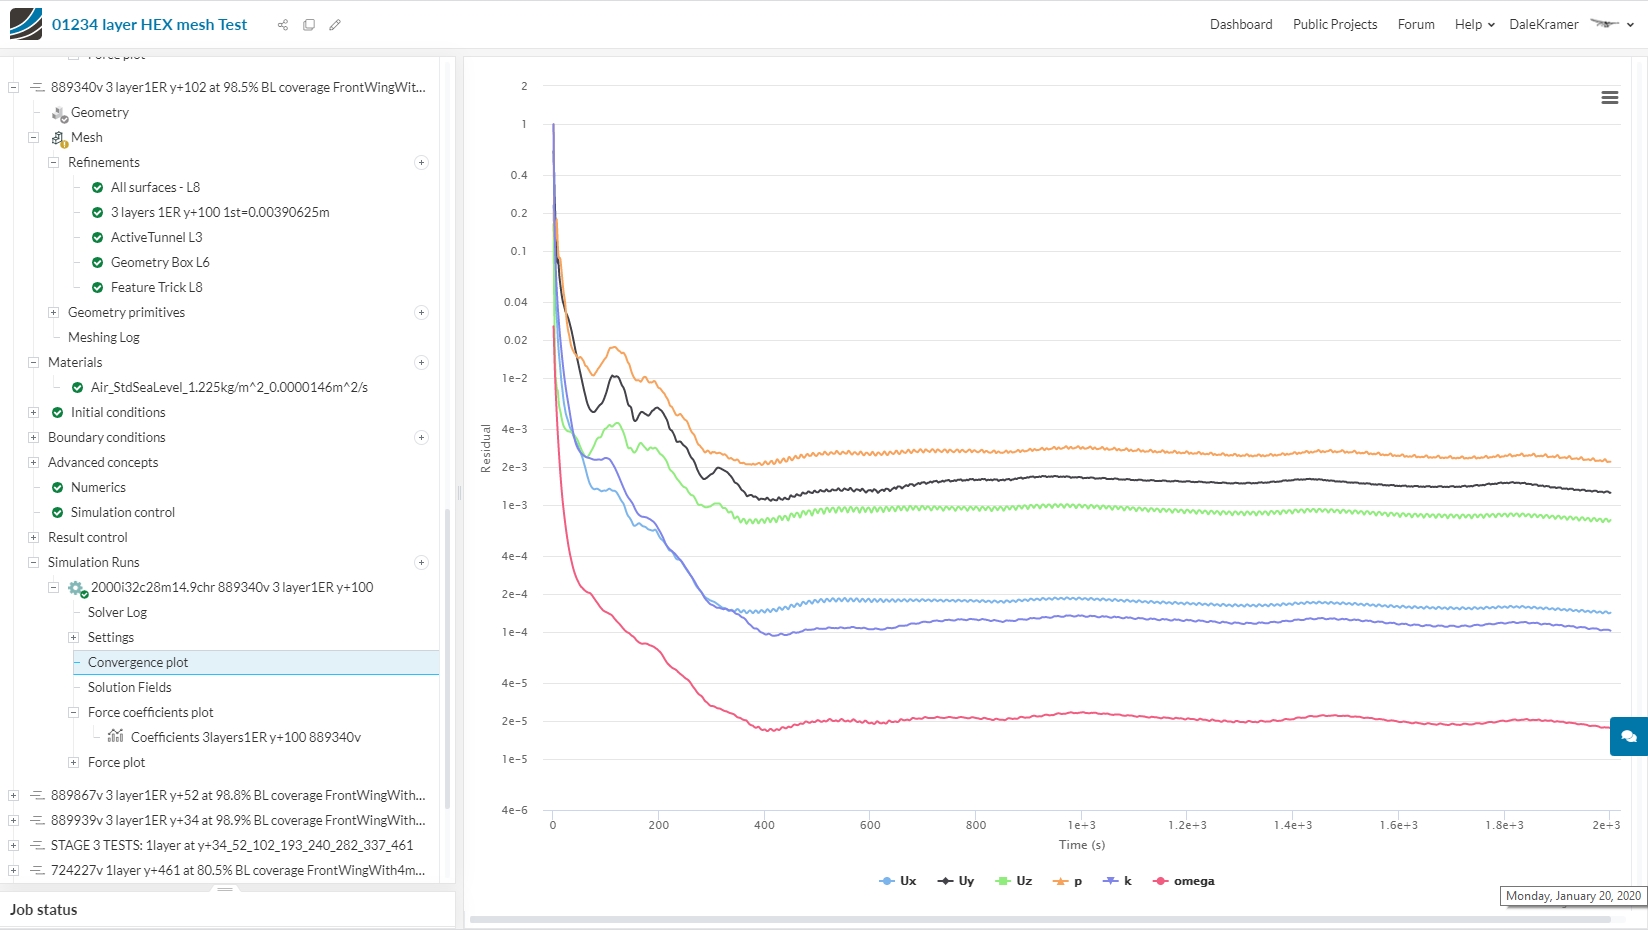
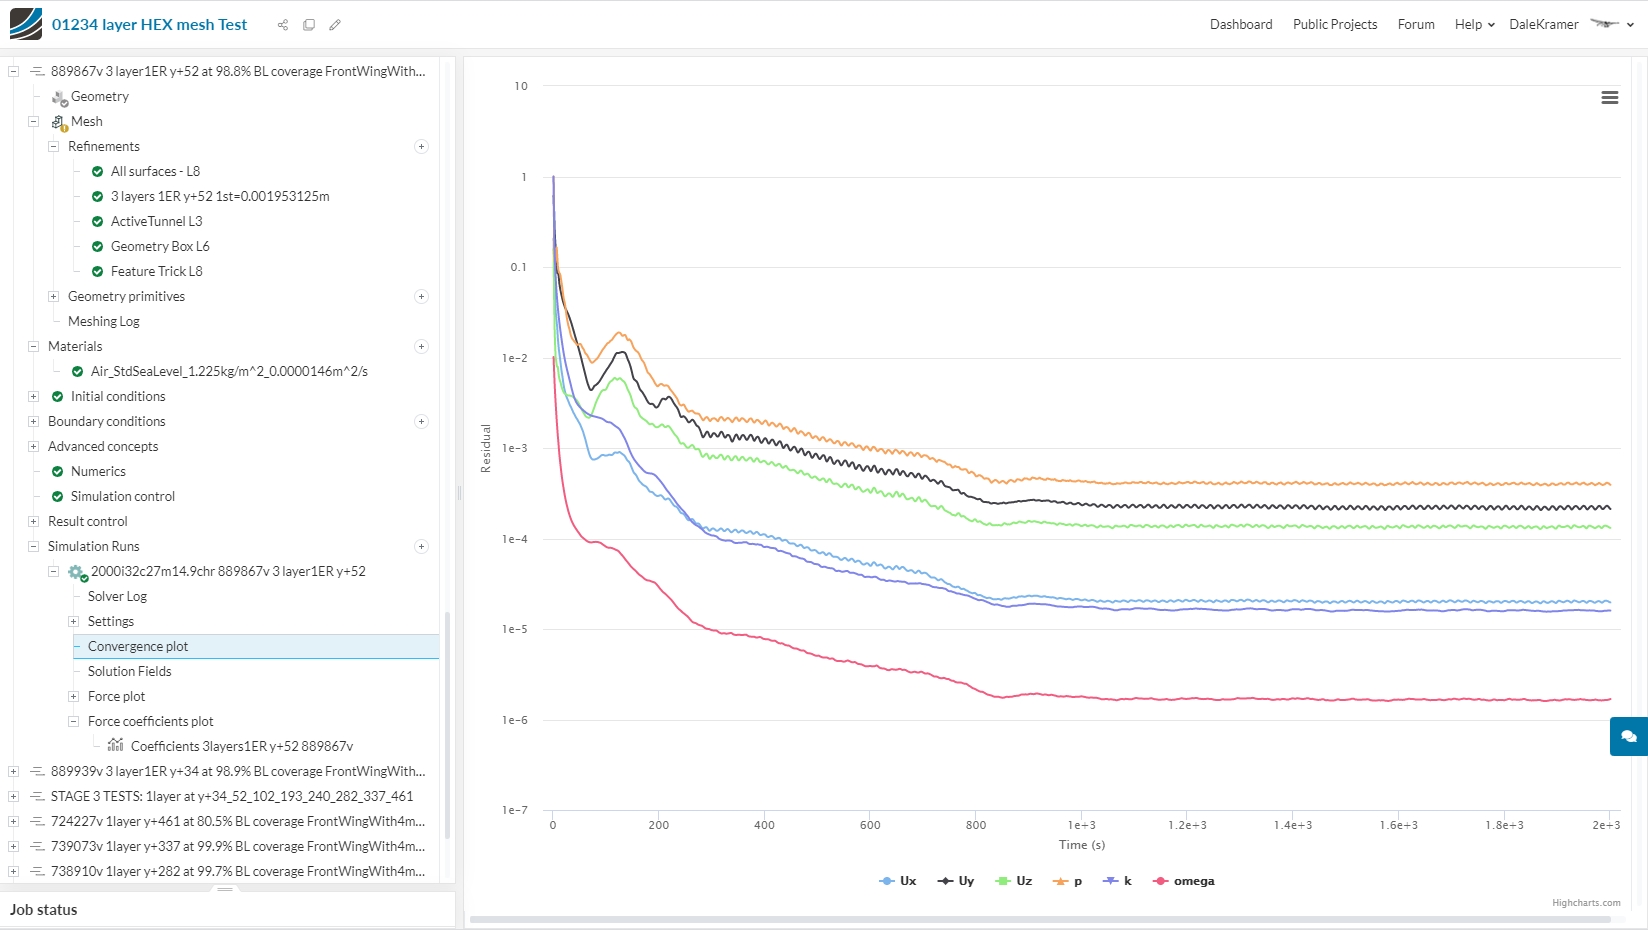
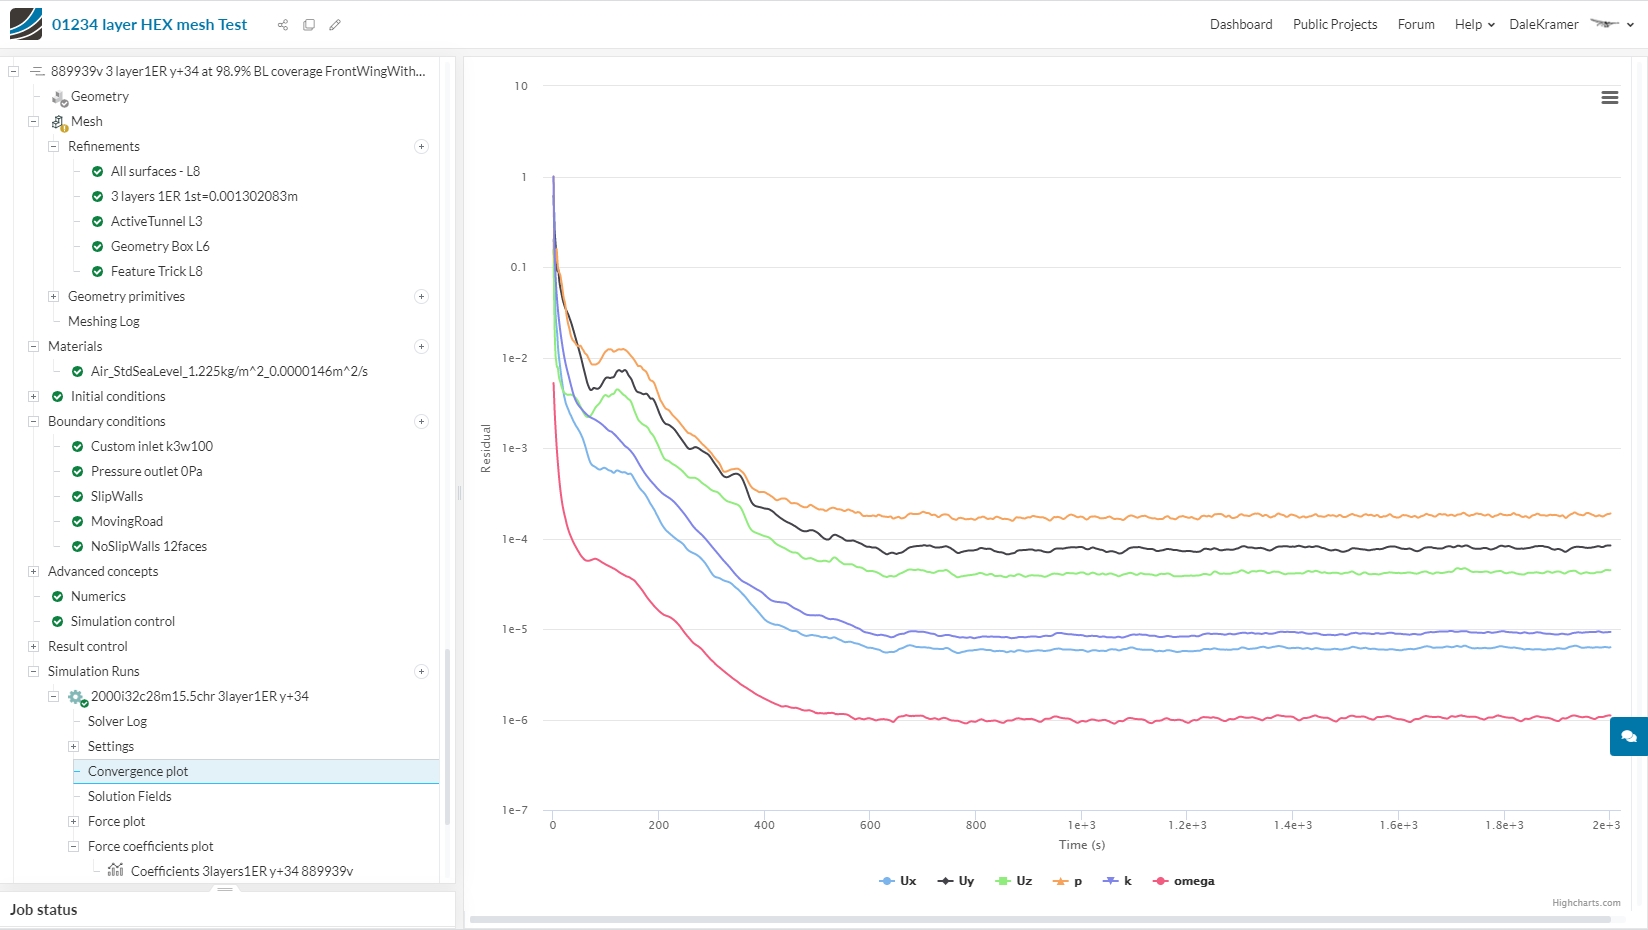
And here are the 5 Residual Convergence Plots for the 5 meshes of the ‘3 Layers at various yPlus values…’ table:
.
.
.
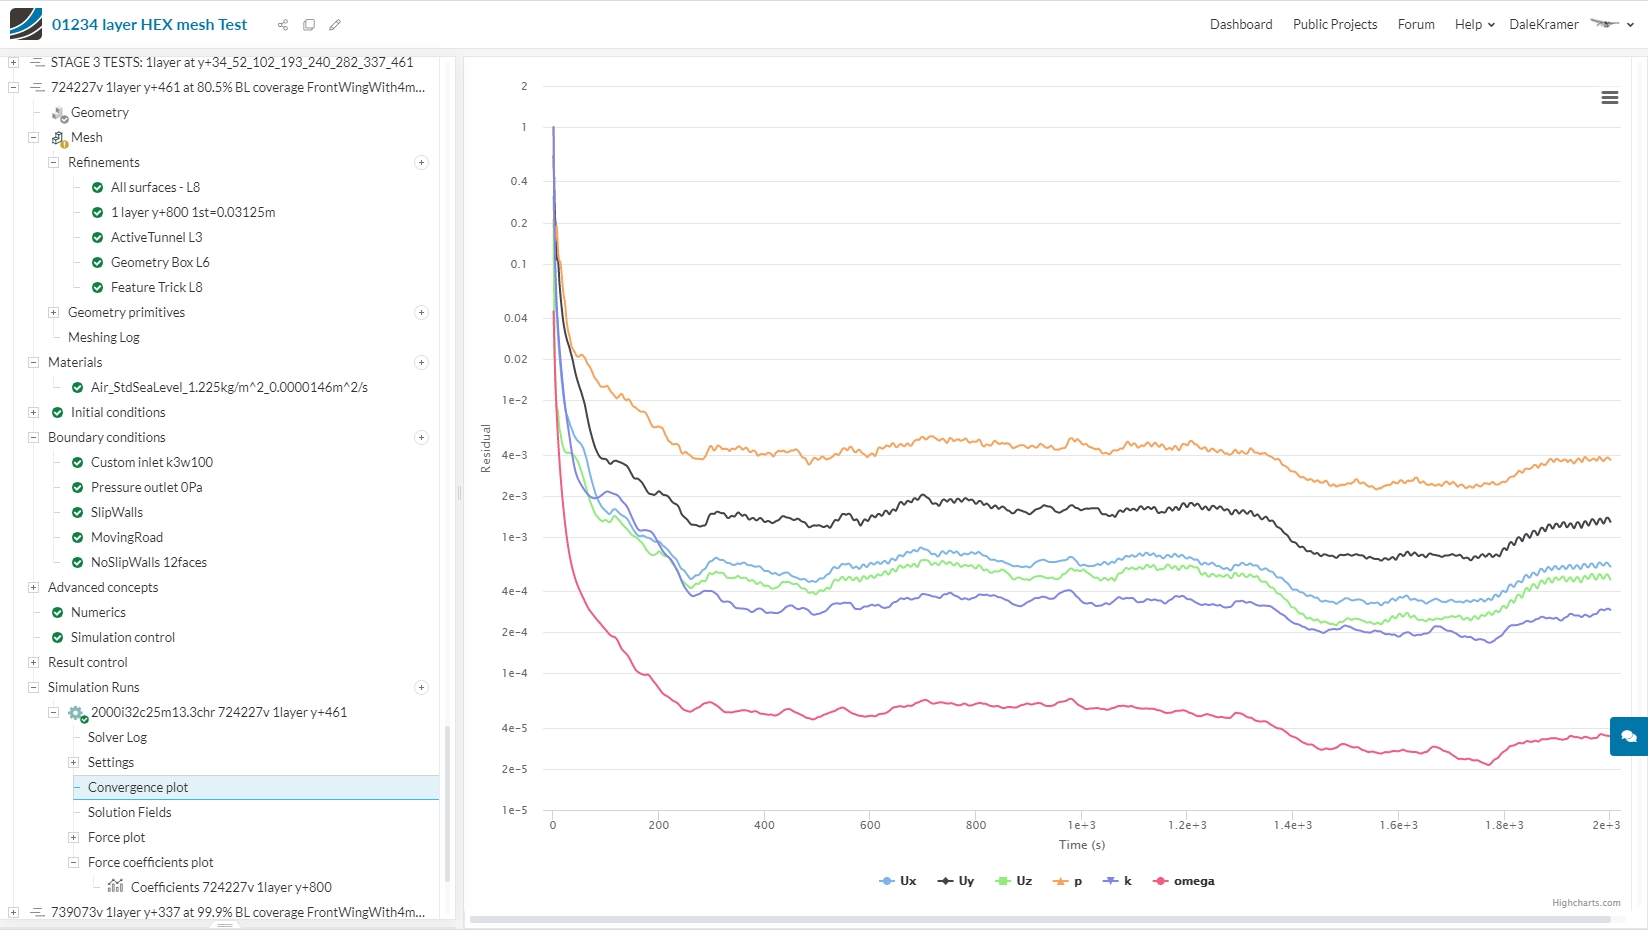
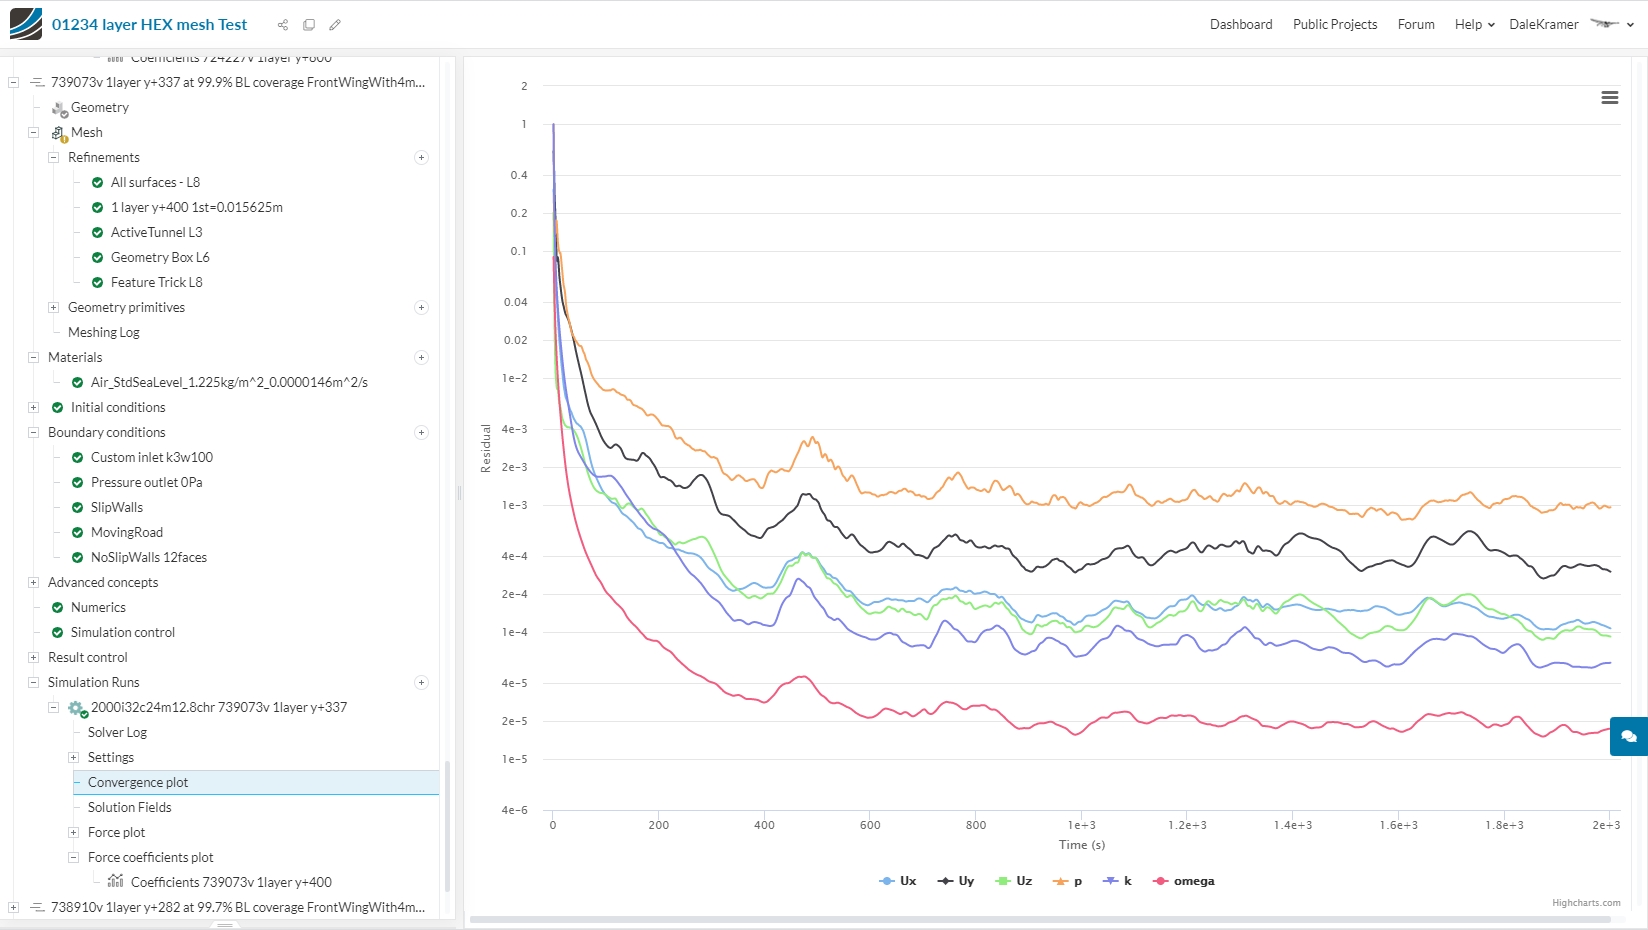
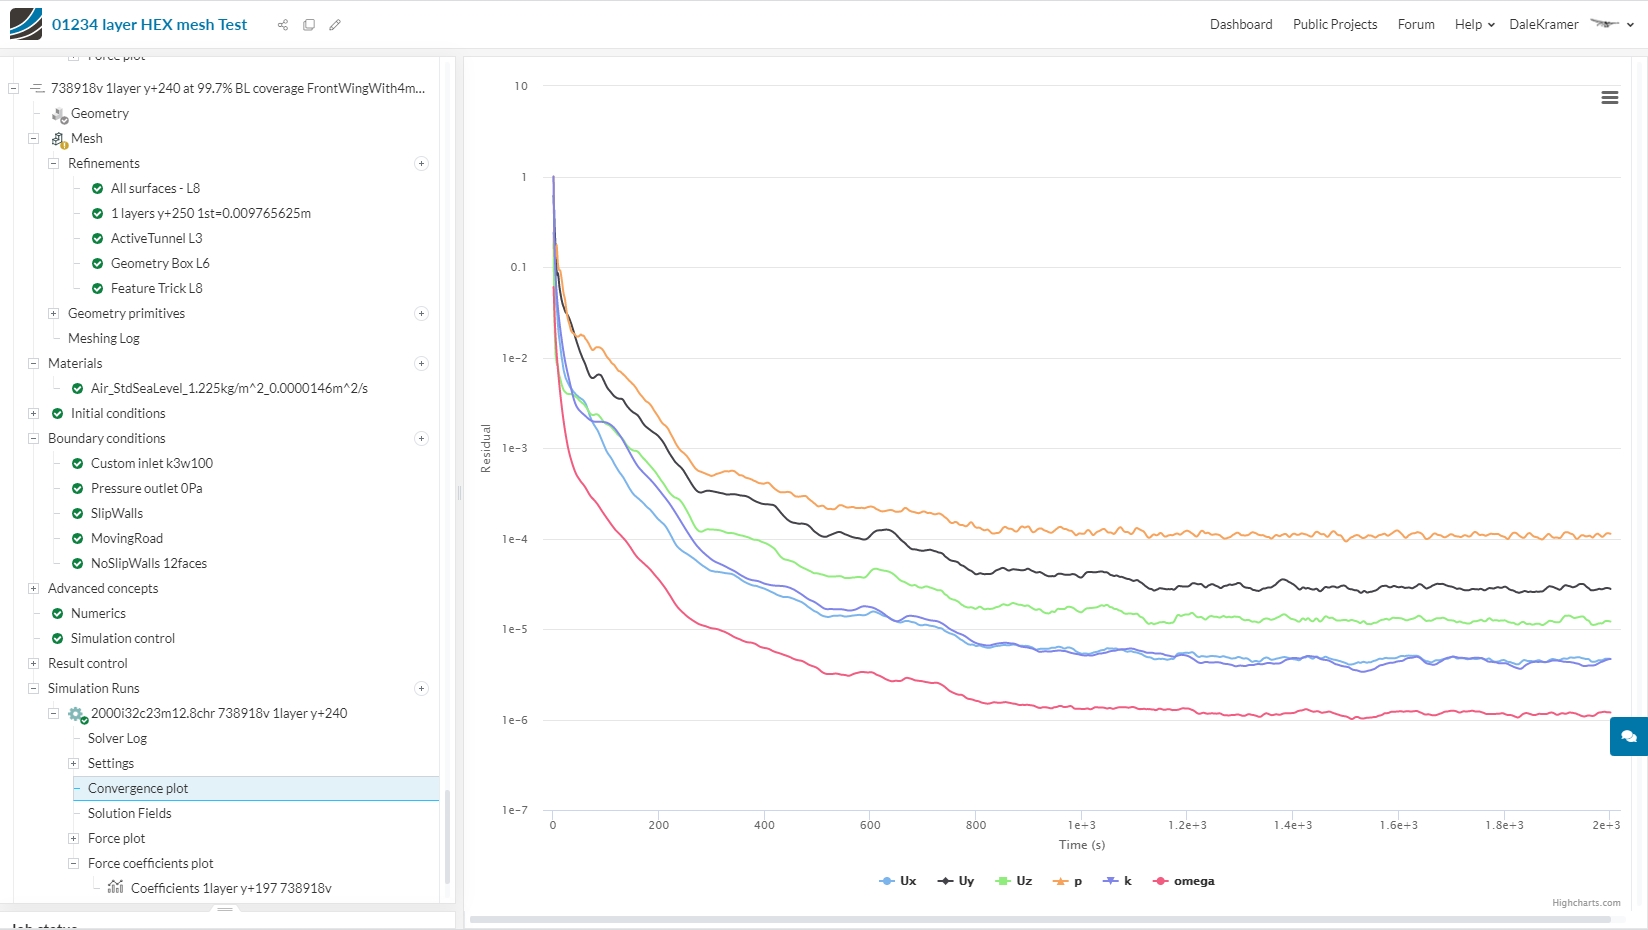
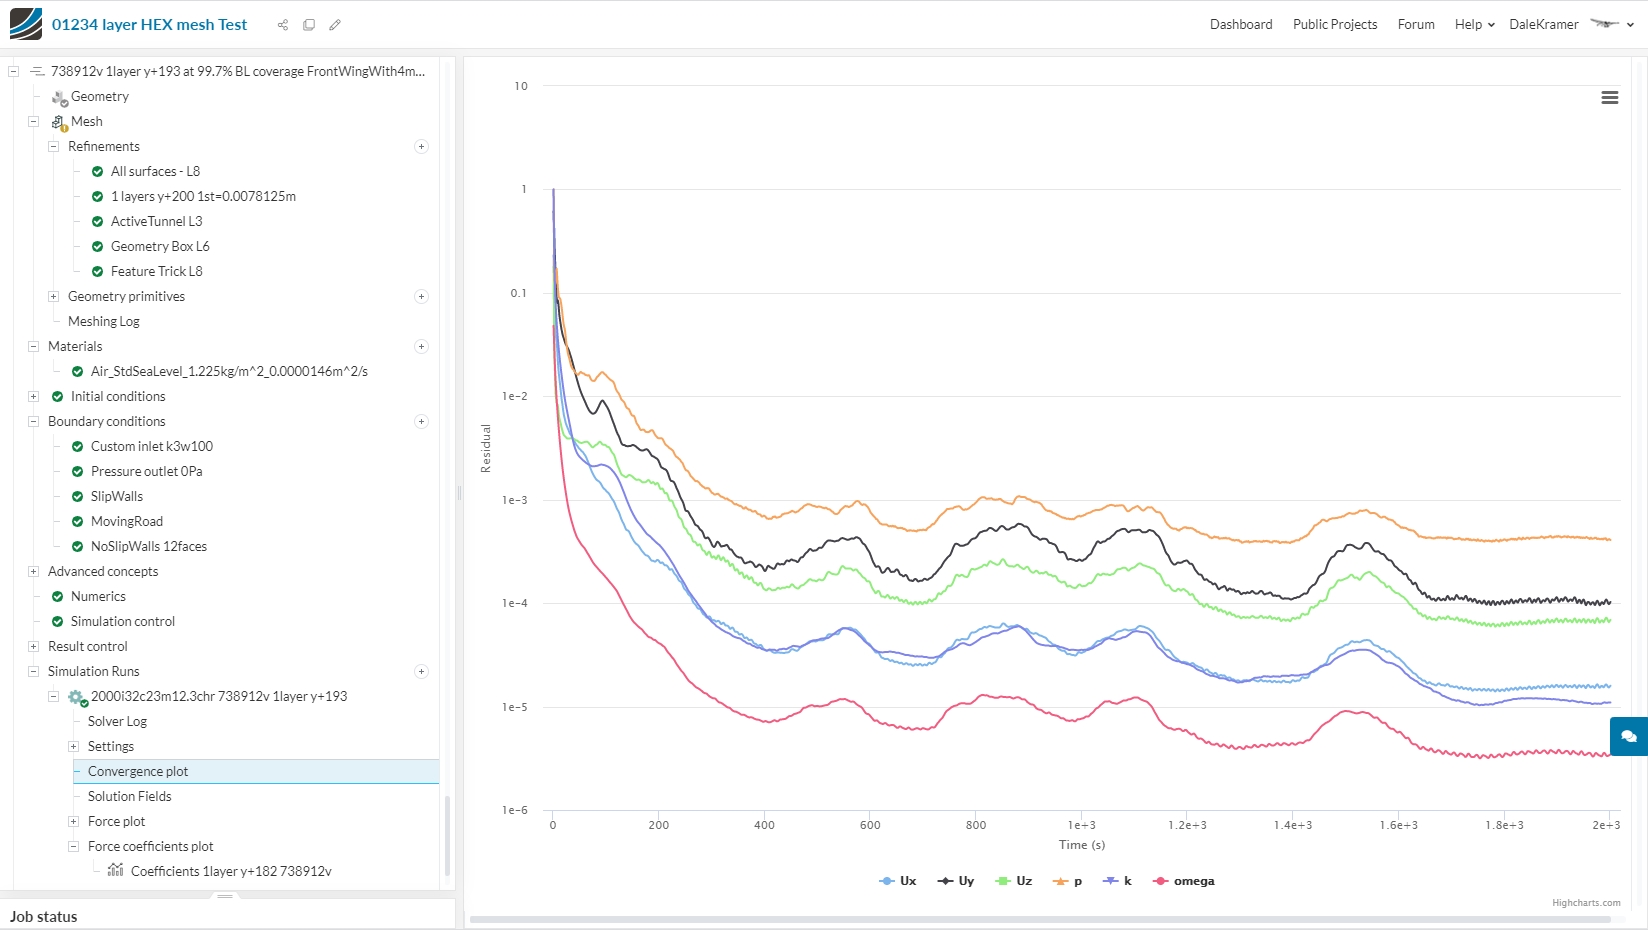
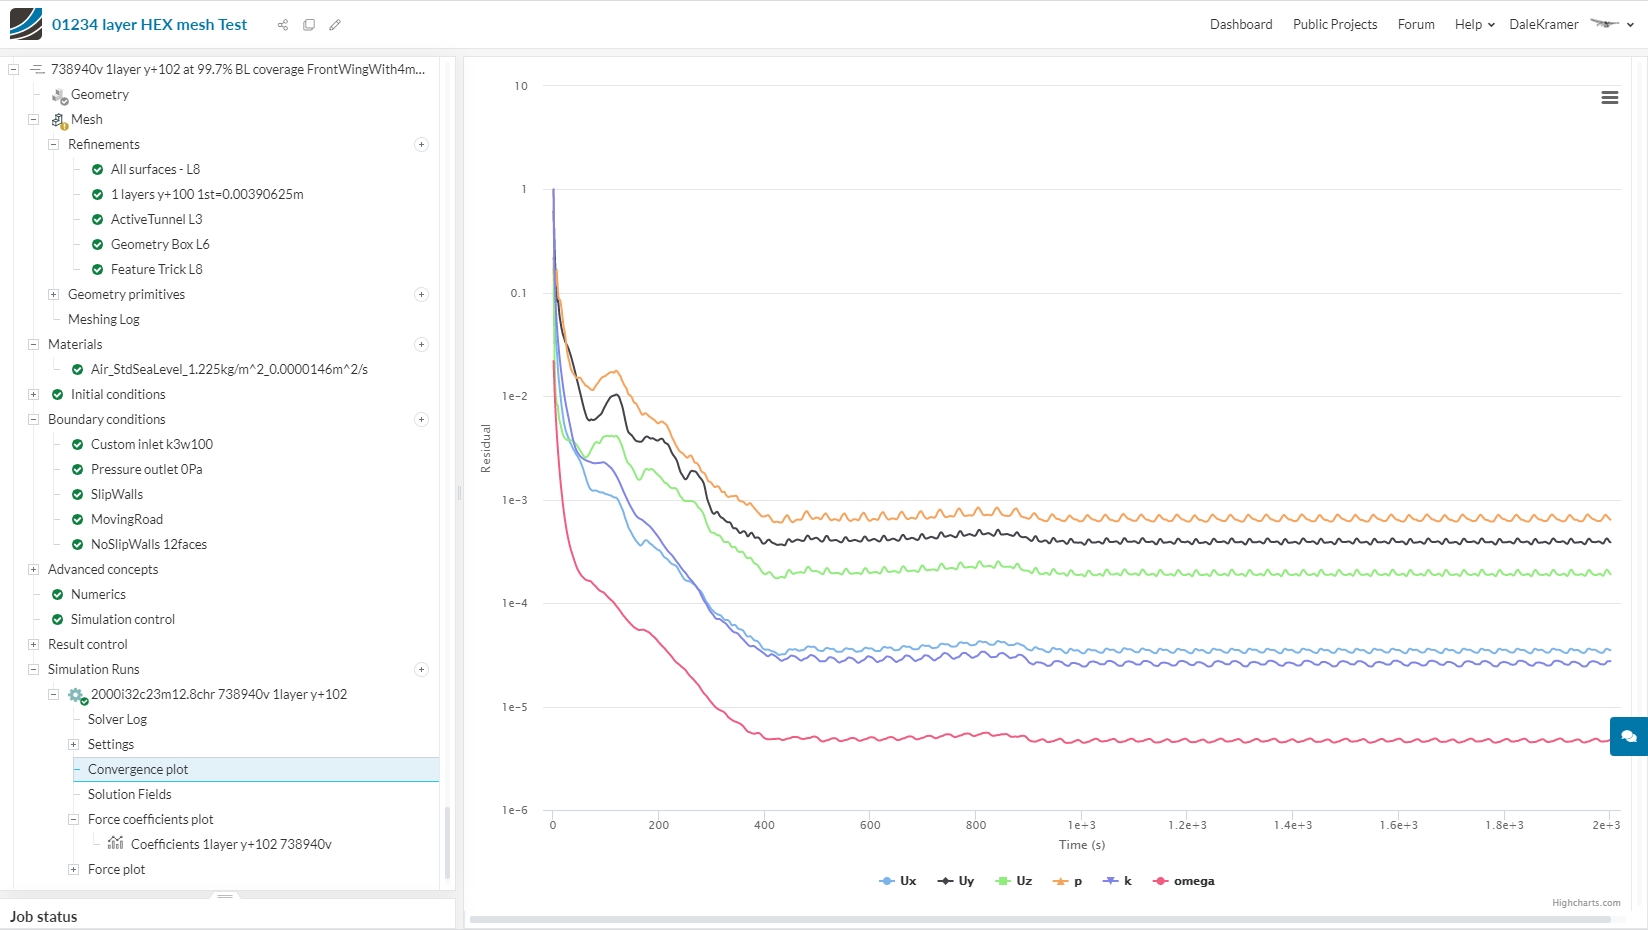
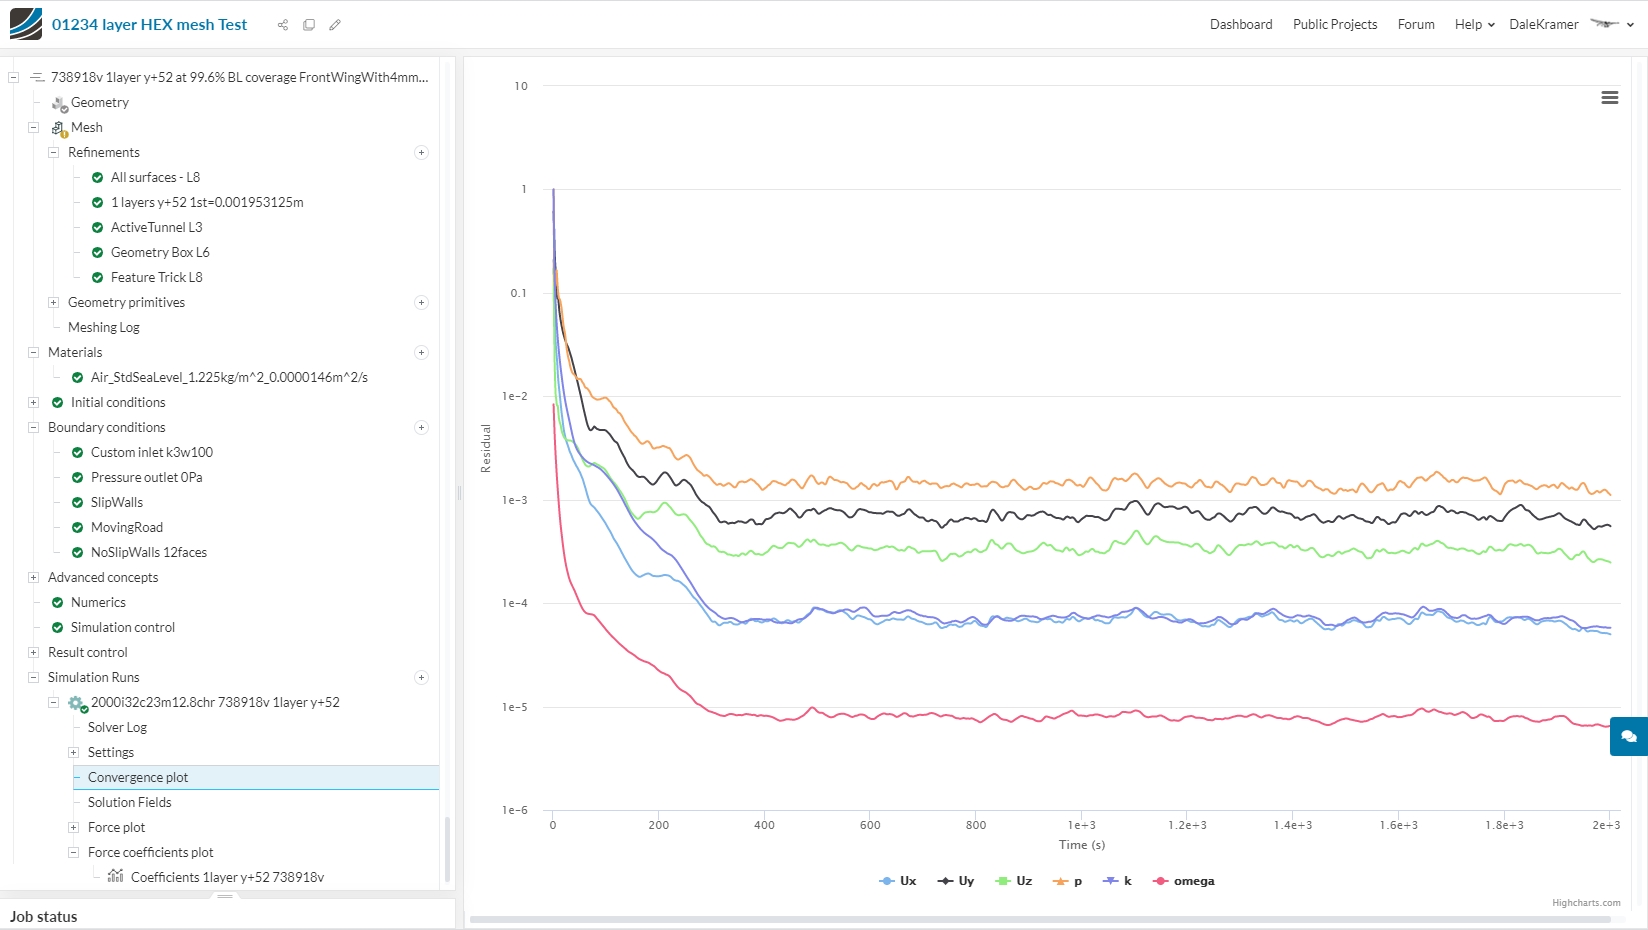
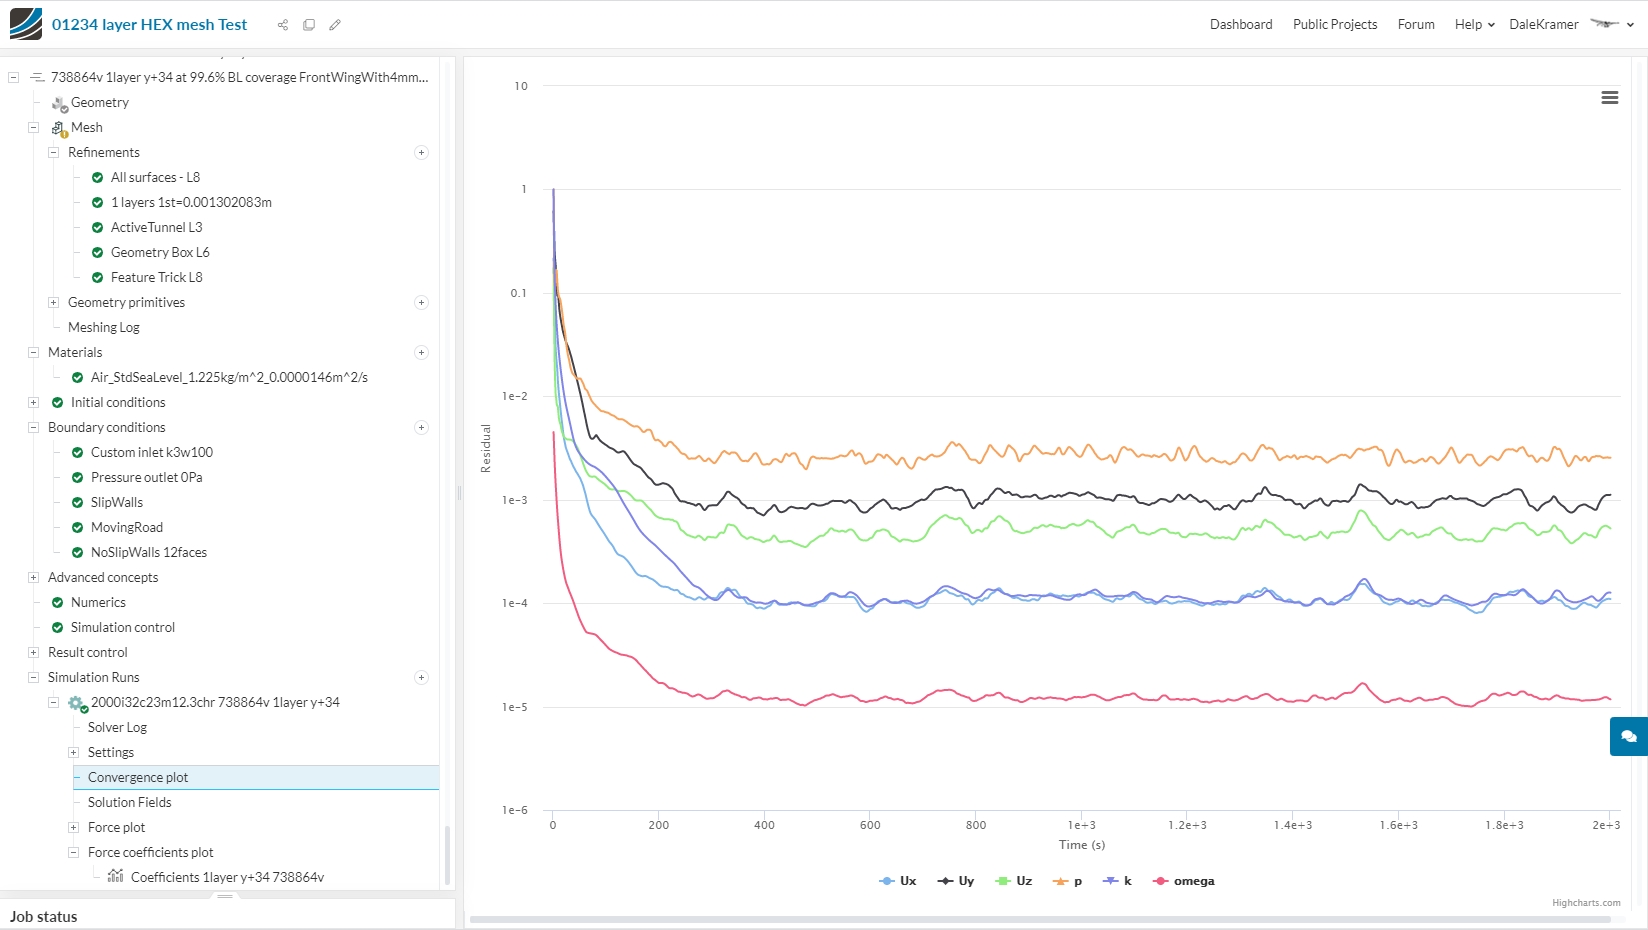
And here are the 8 Residual Convergence Plots for the 8 meshes of the ‘1 Layer at various yPlus values…’ table:
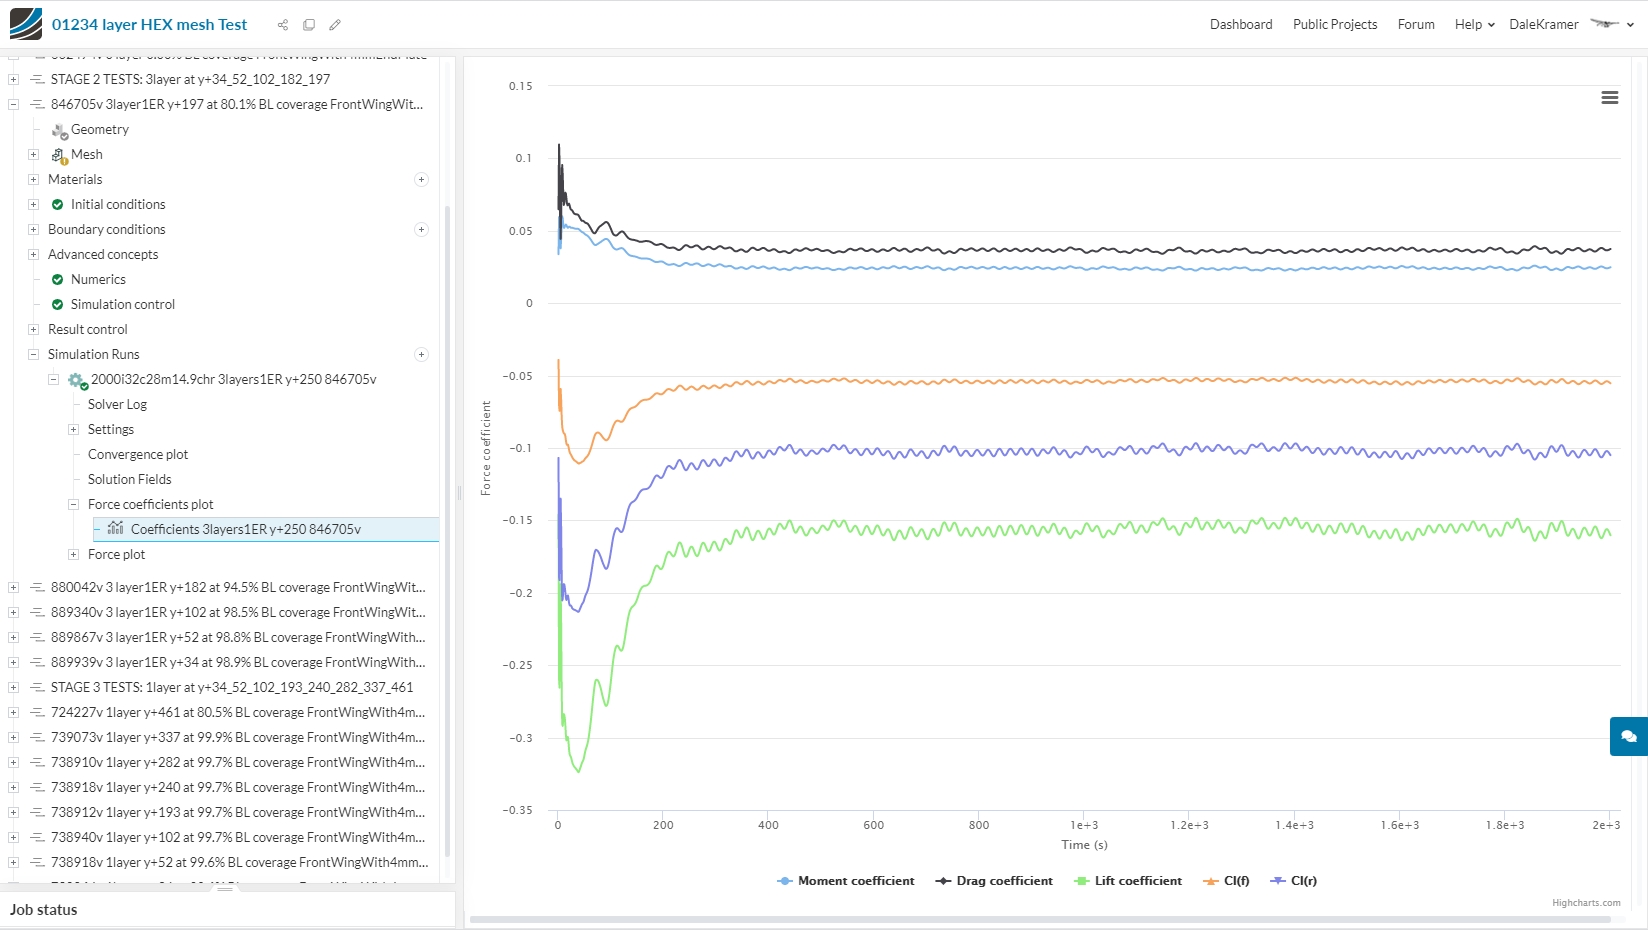
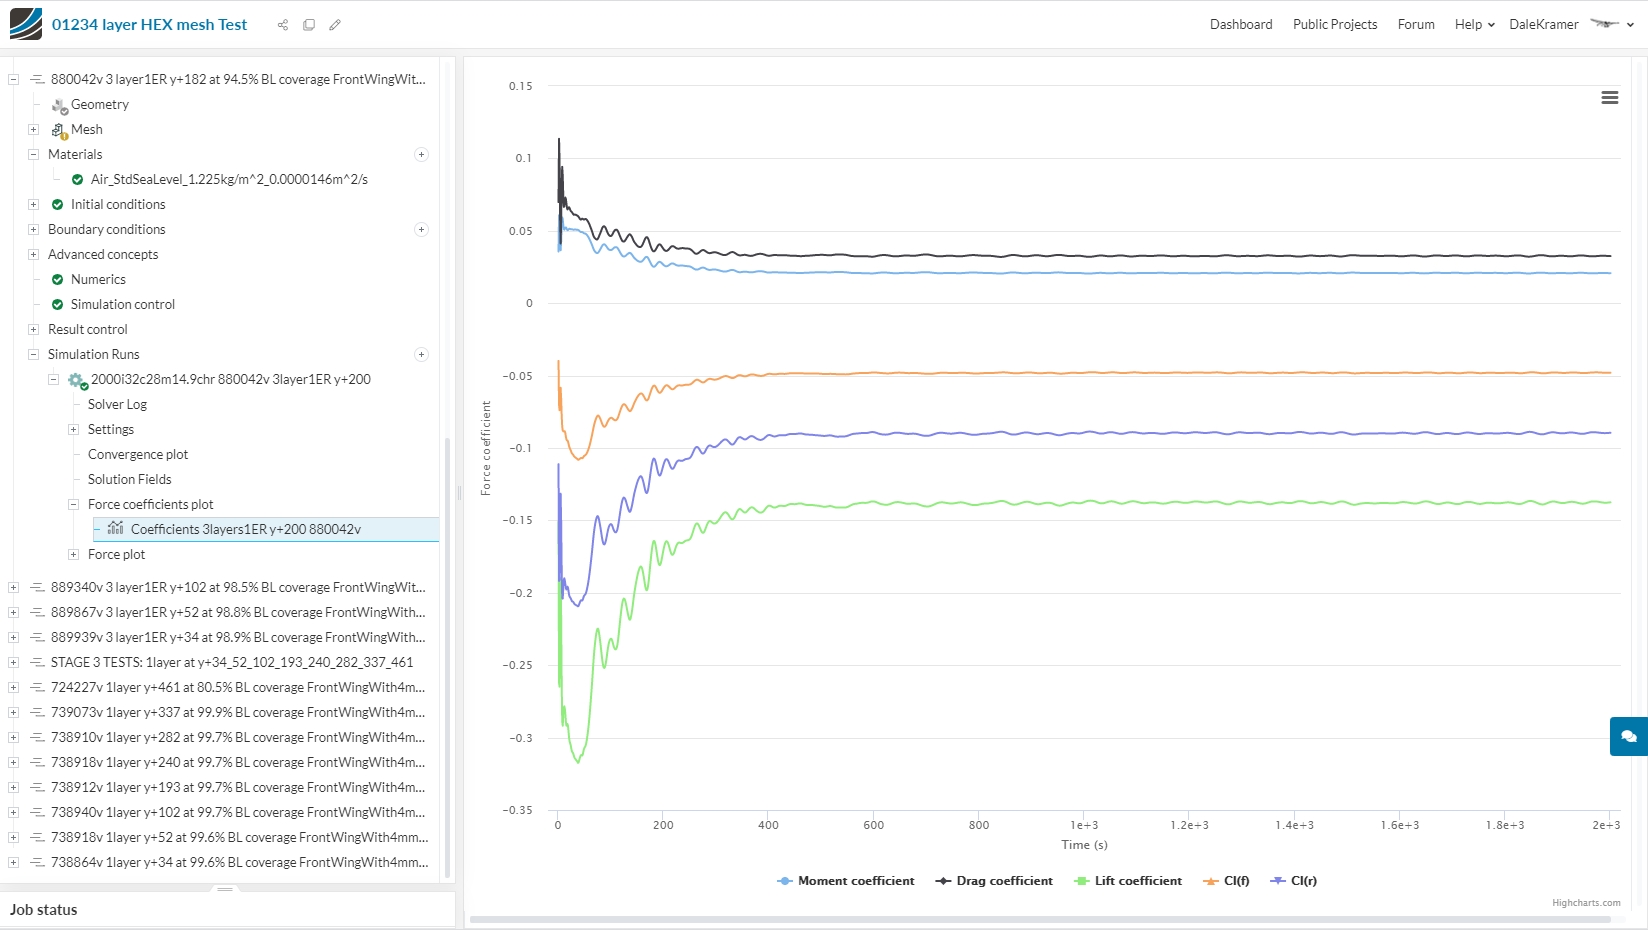
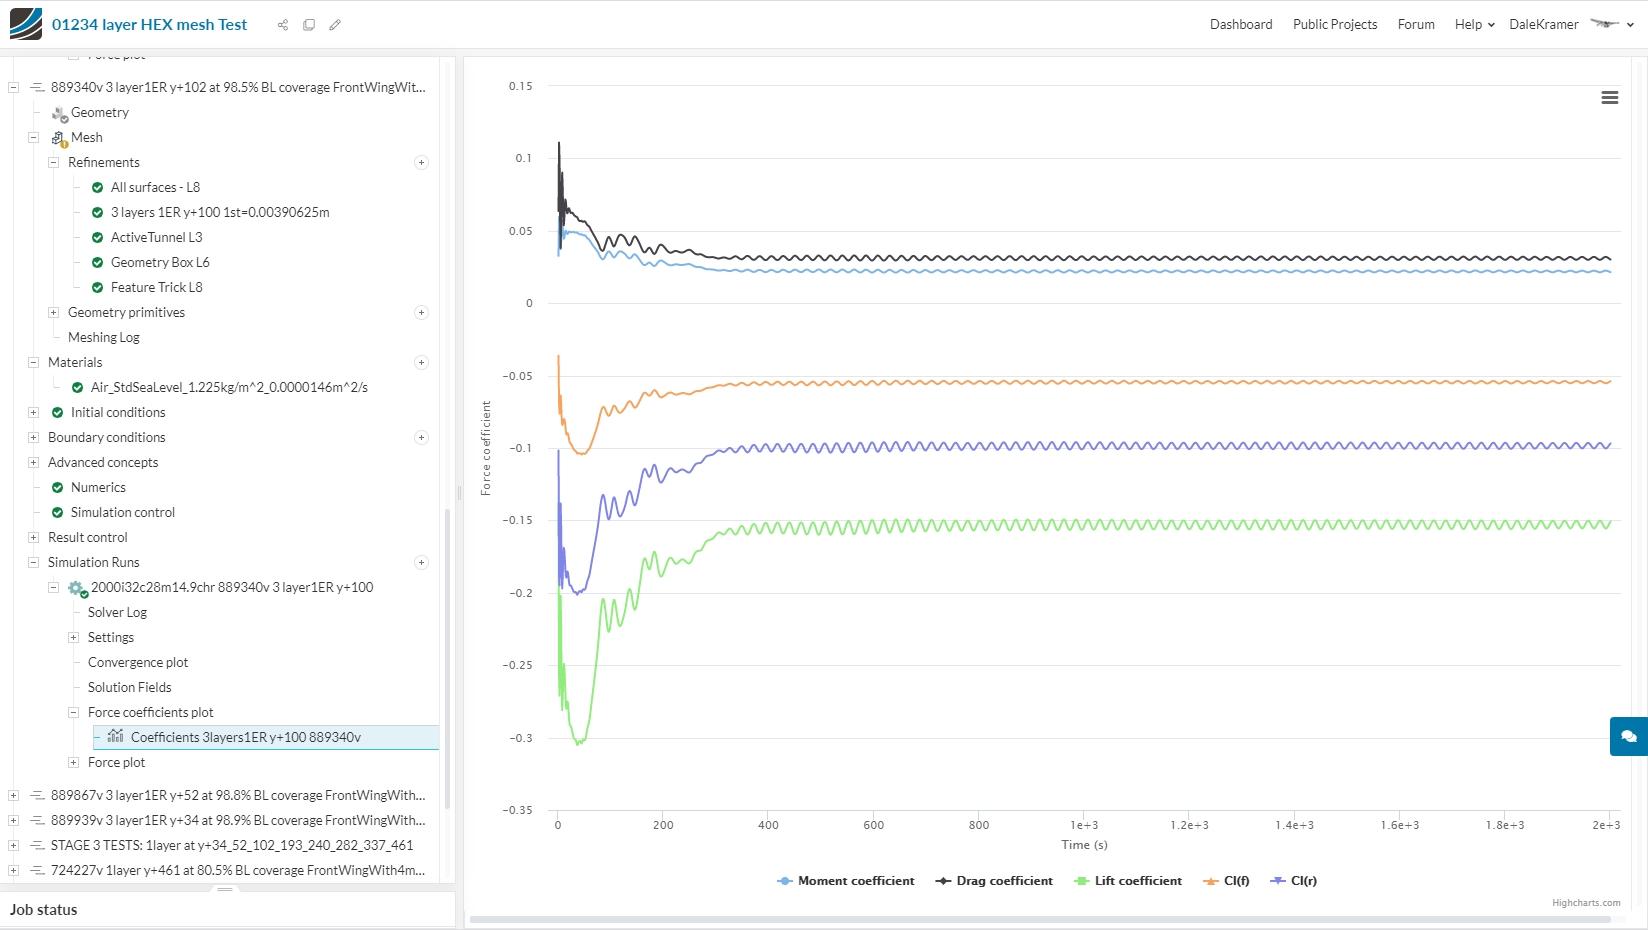
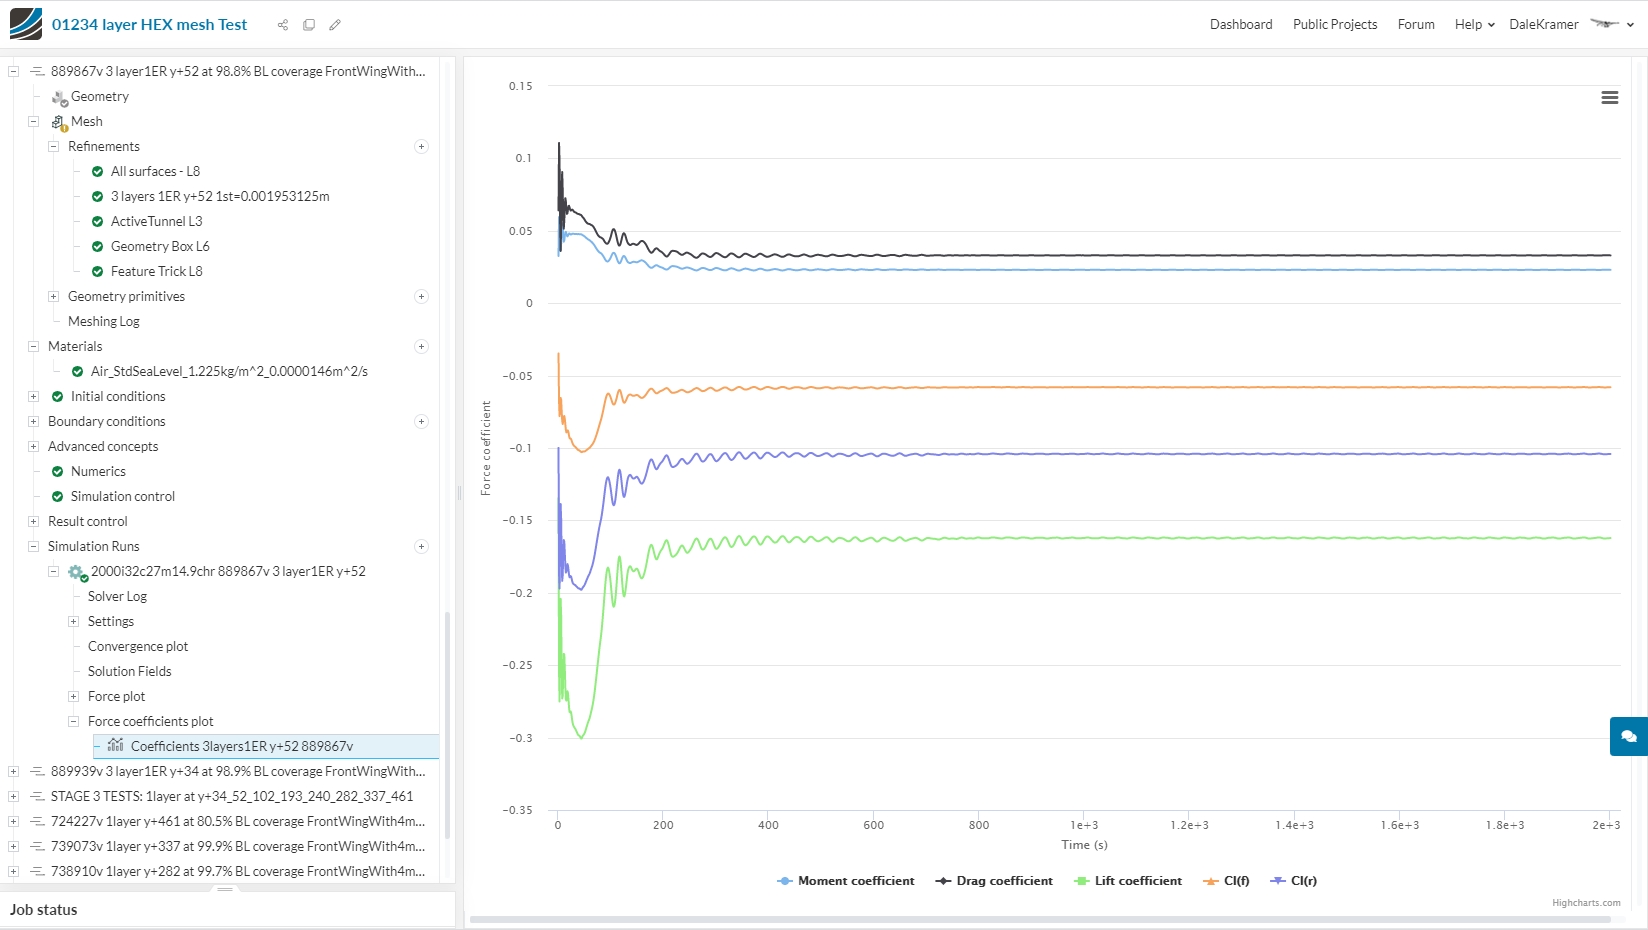
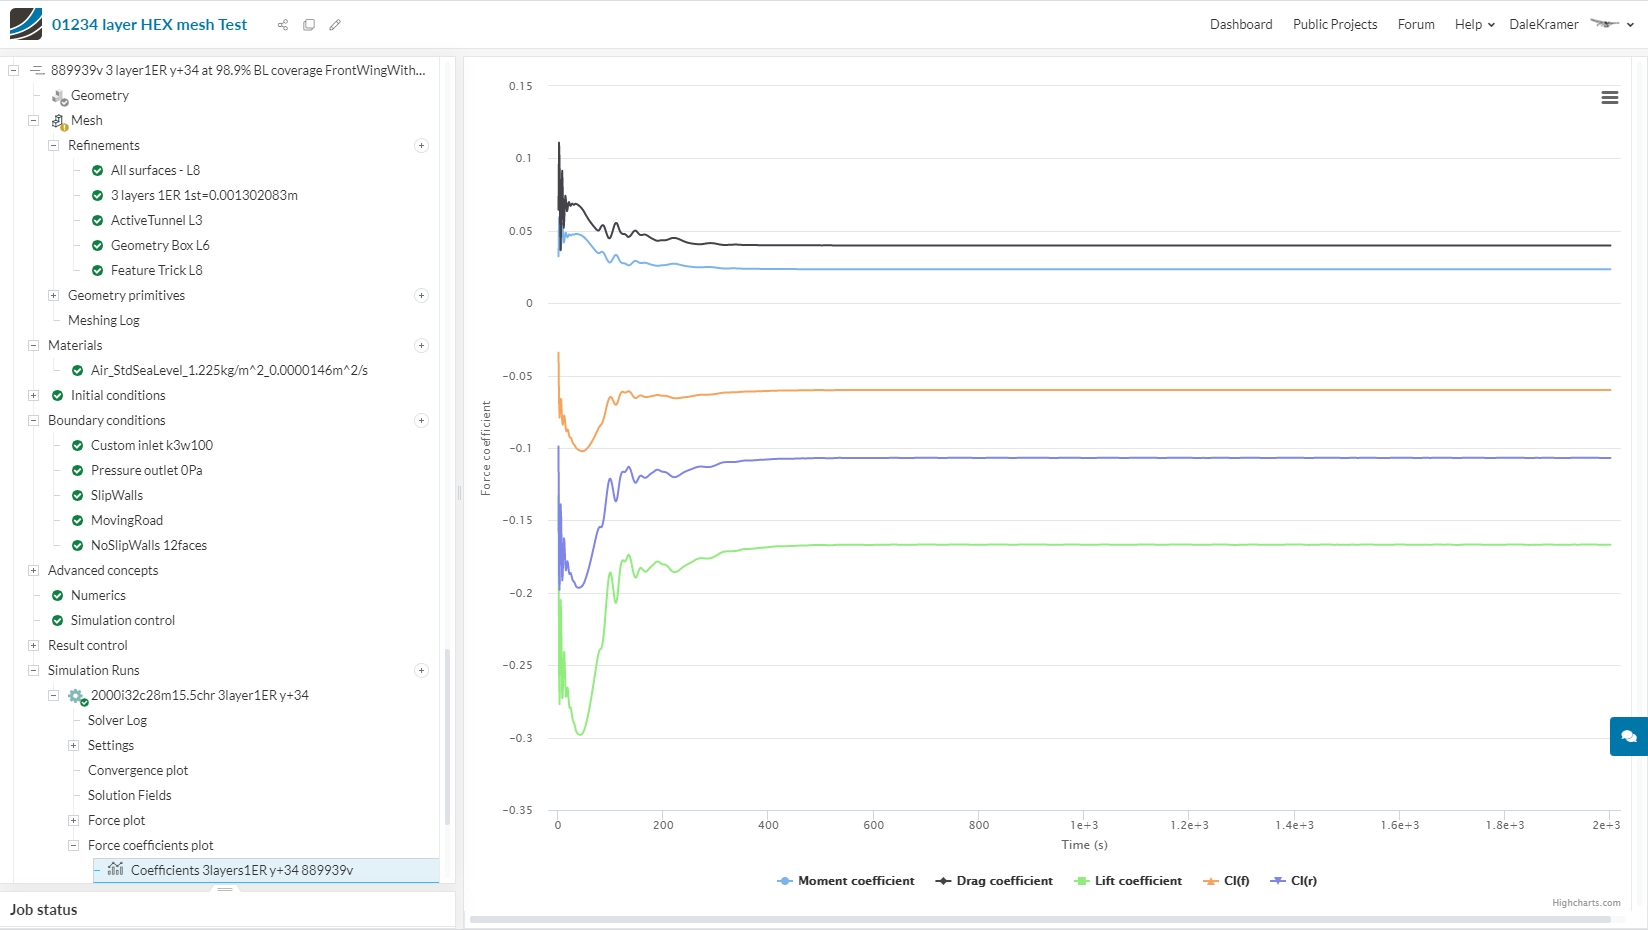
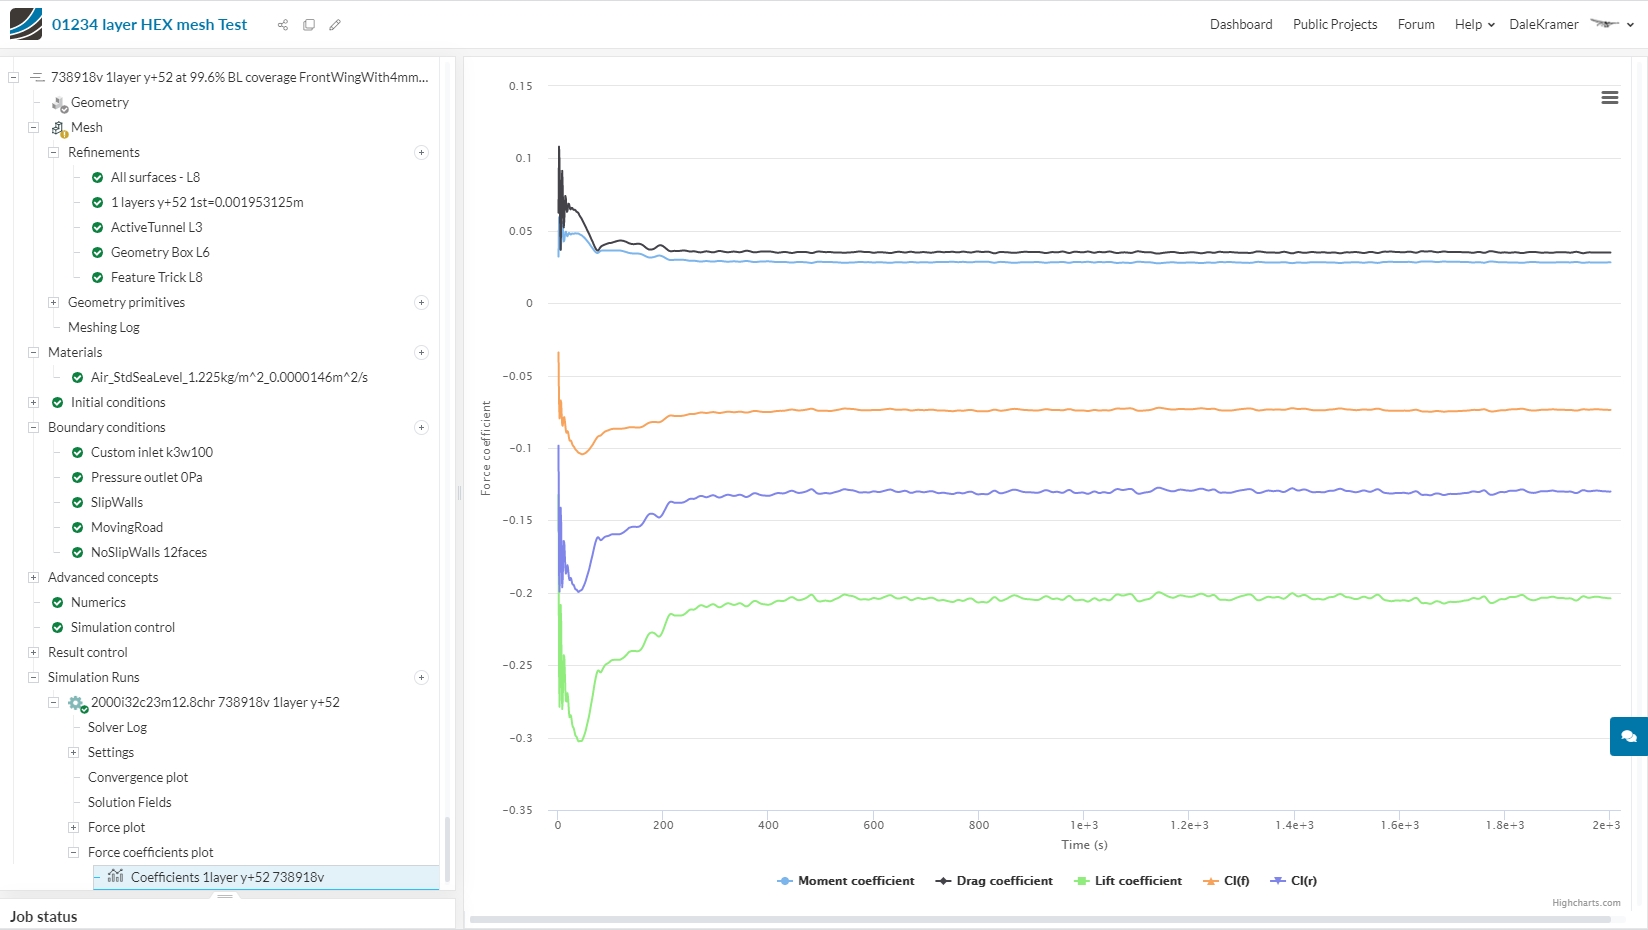
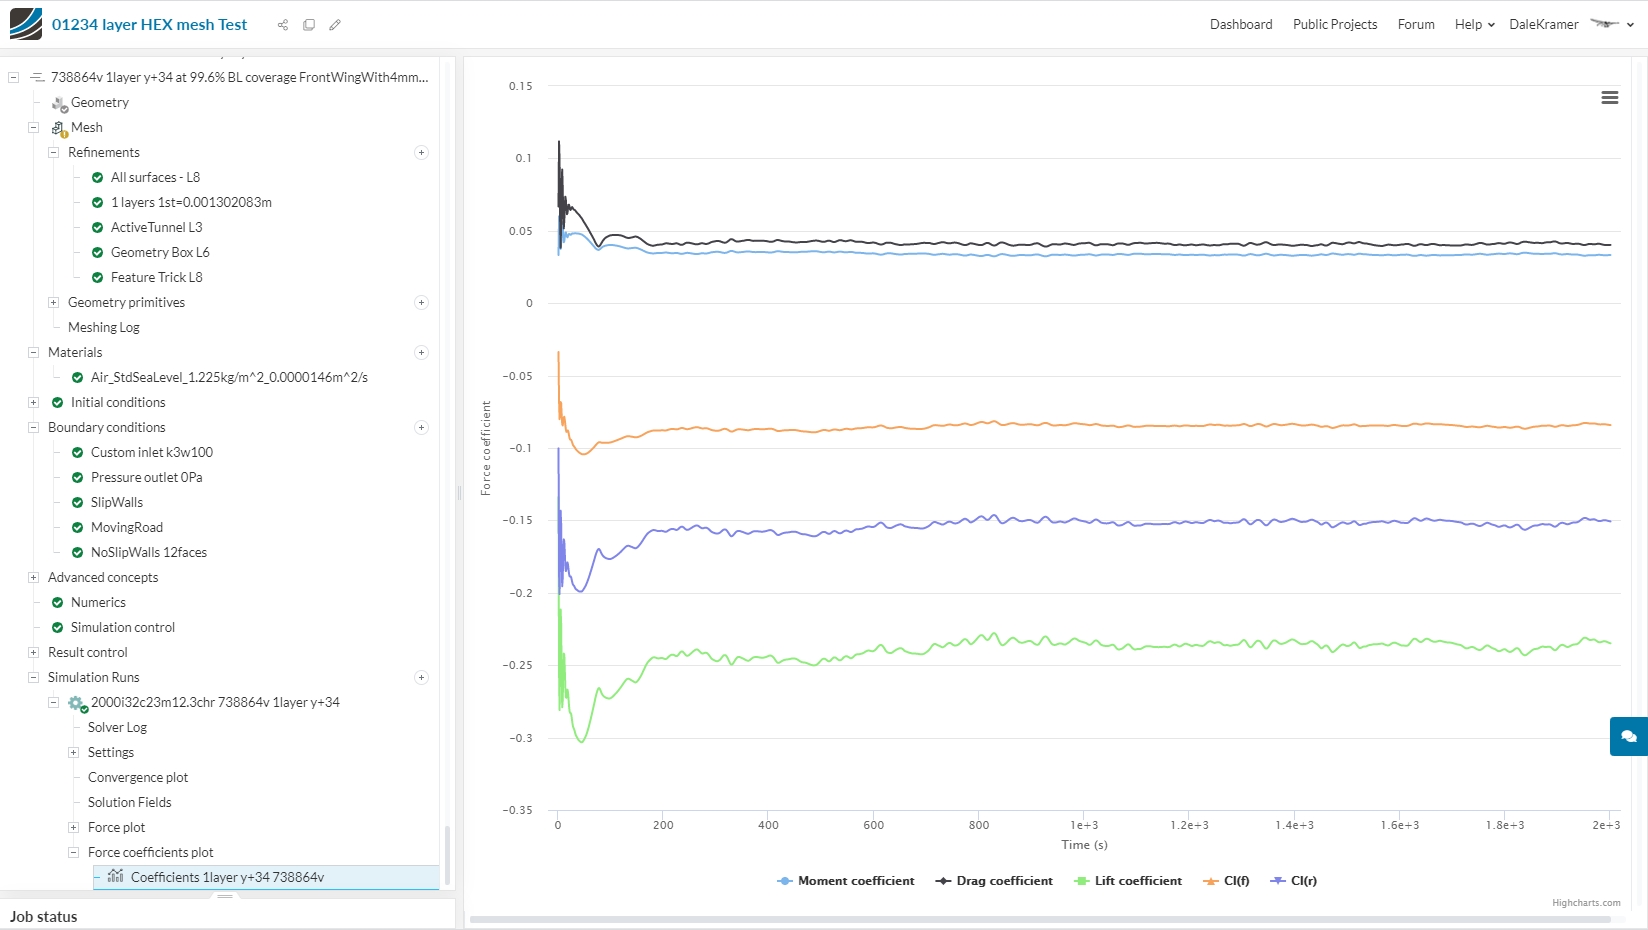
And here are the 5 Coefficient Plots for the 5 meshes of the ‘3 Layers at various yPlus values…’ table:
.
.
.
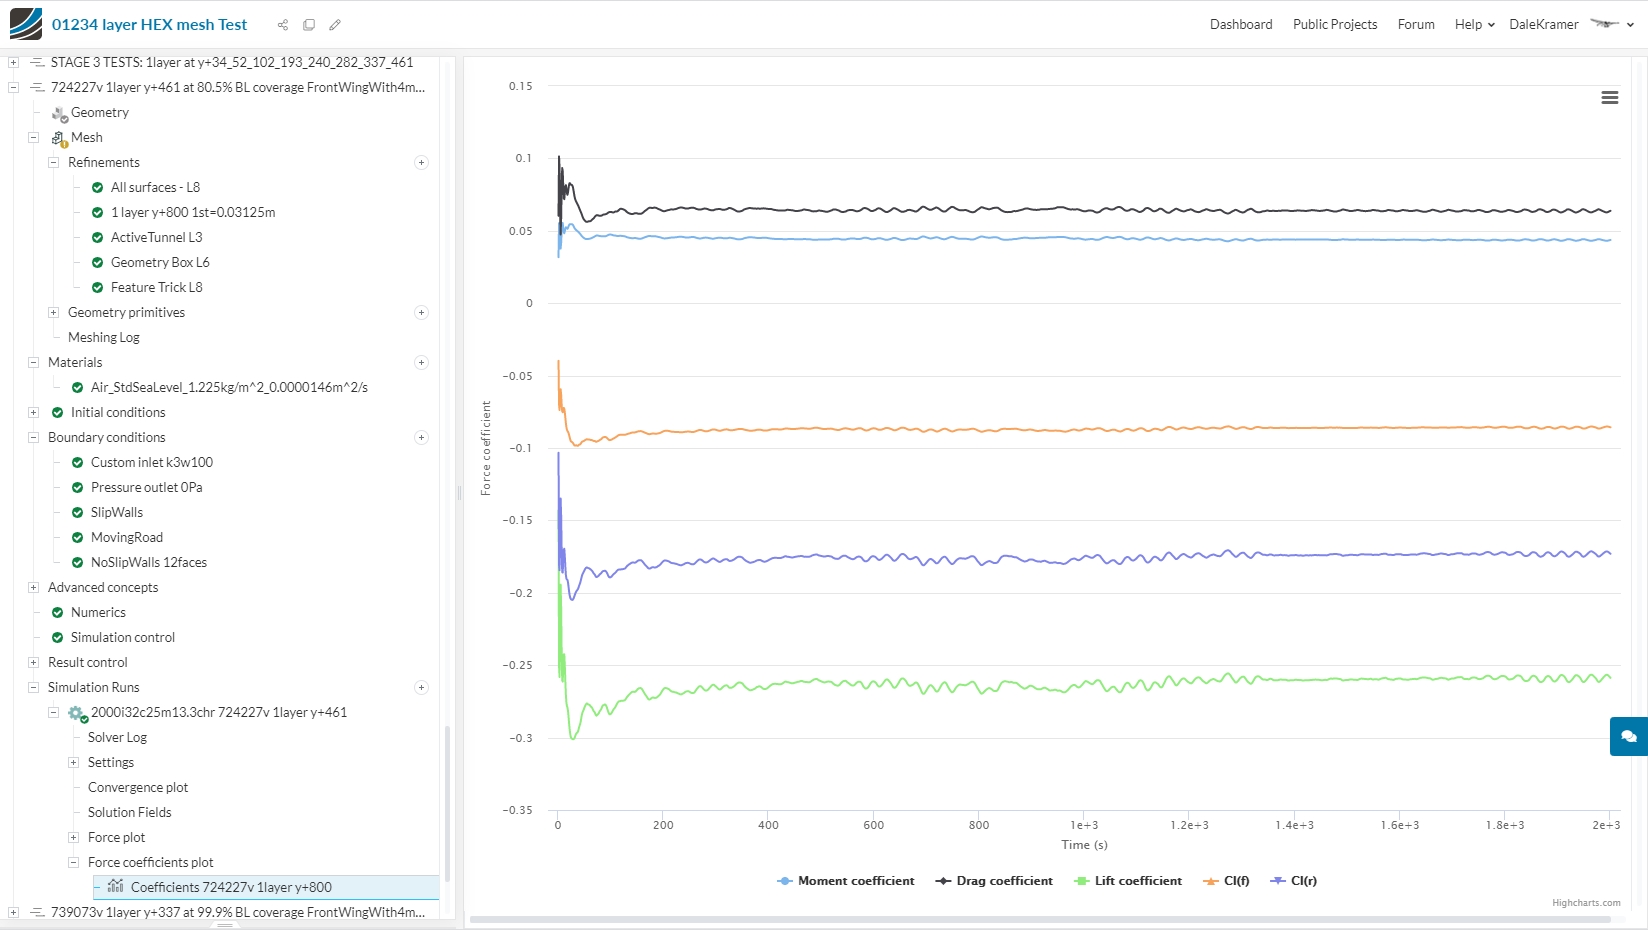
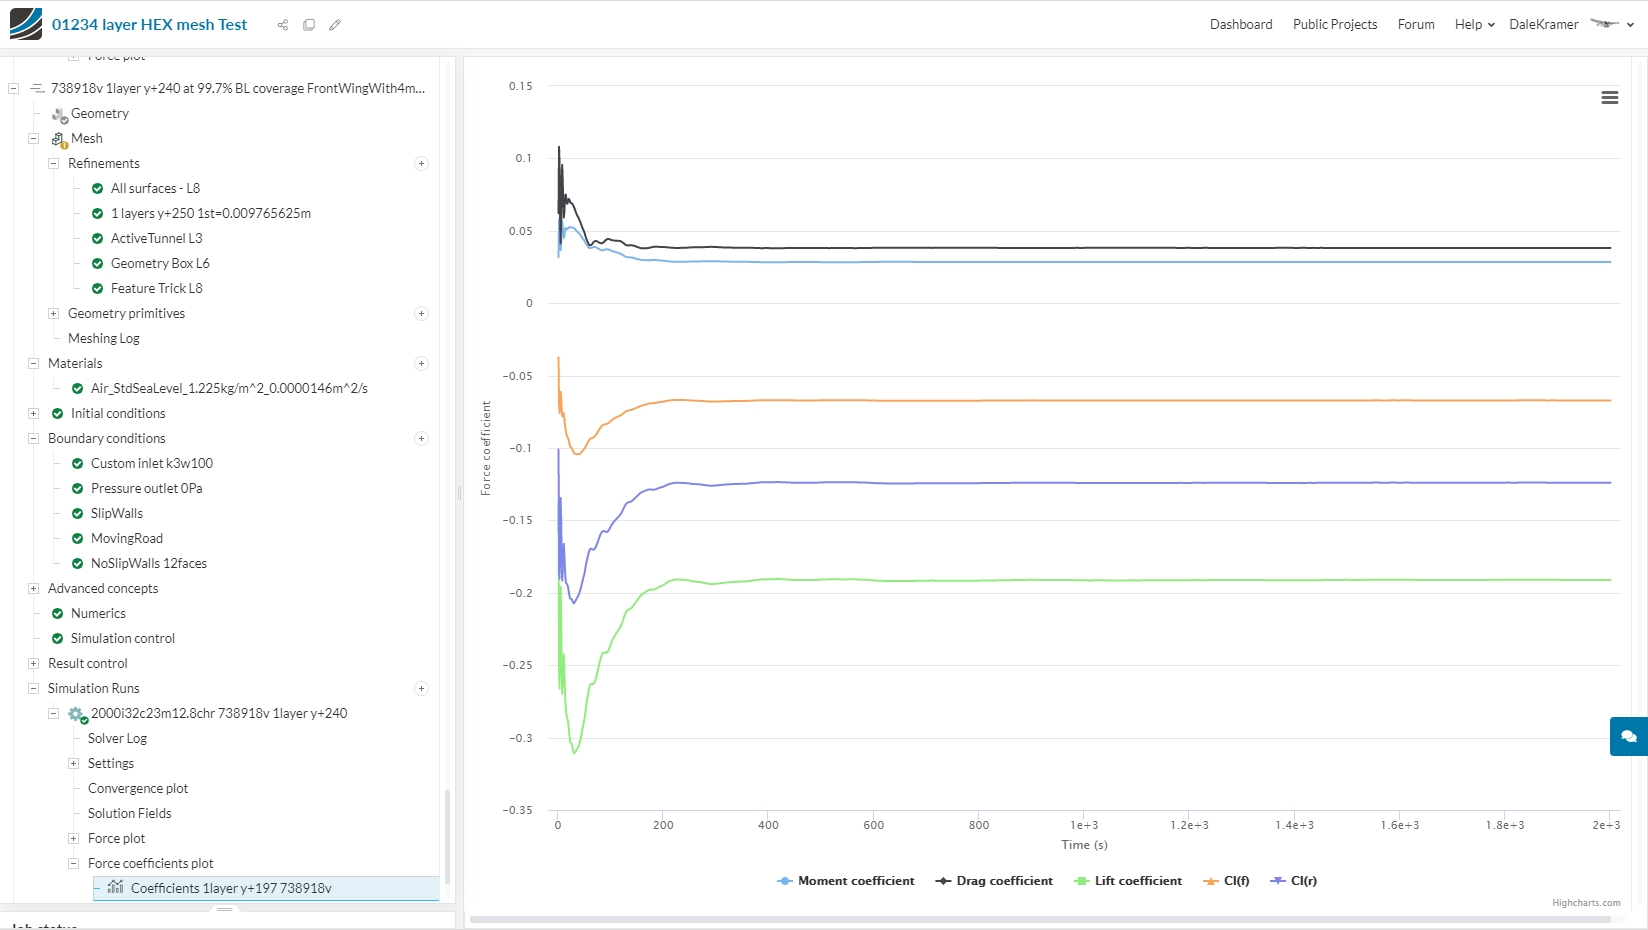
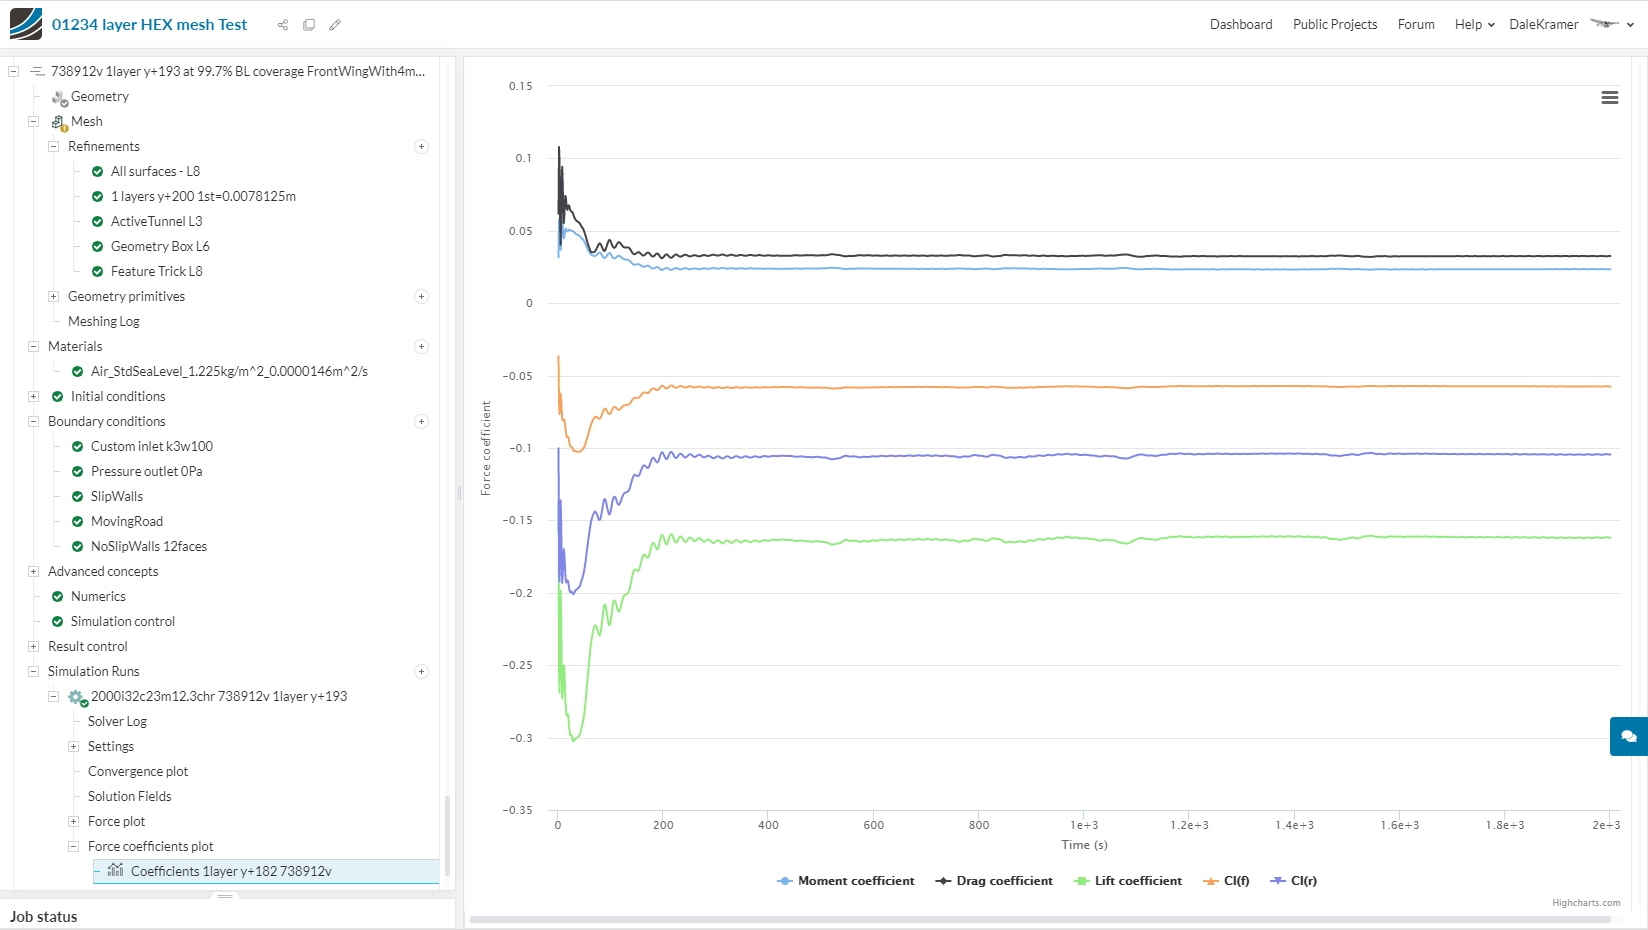
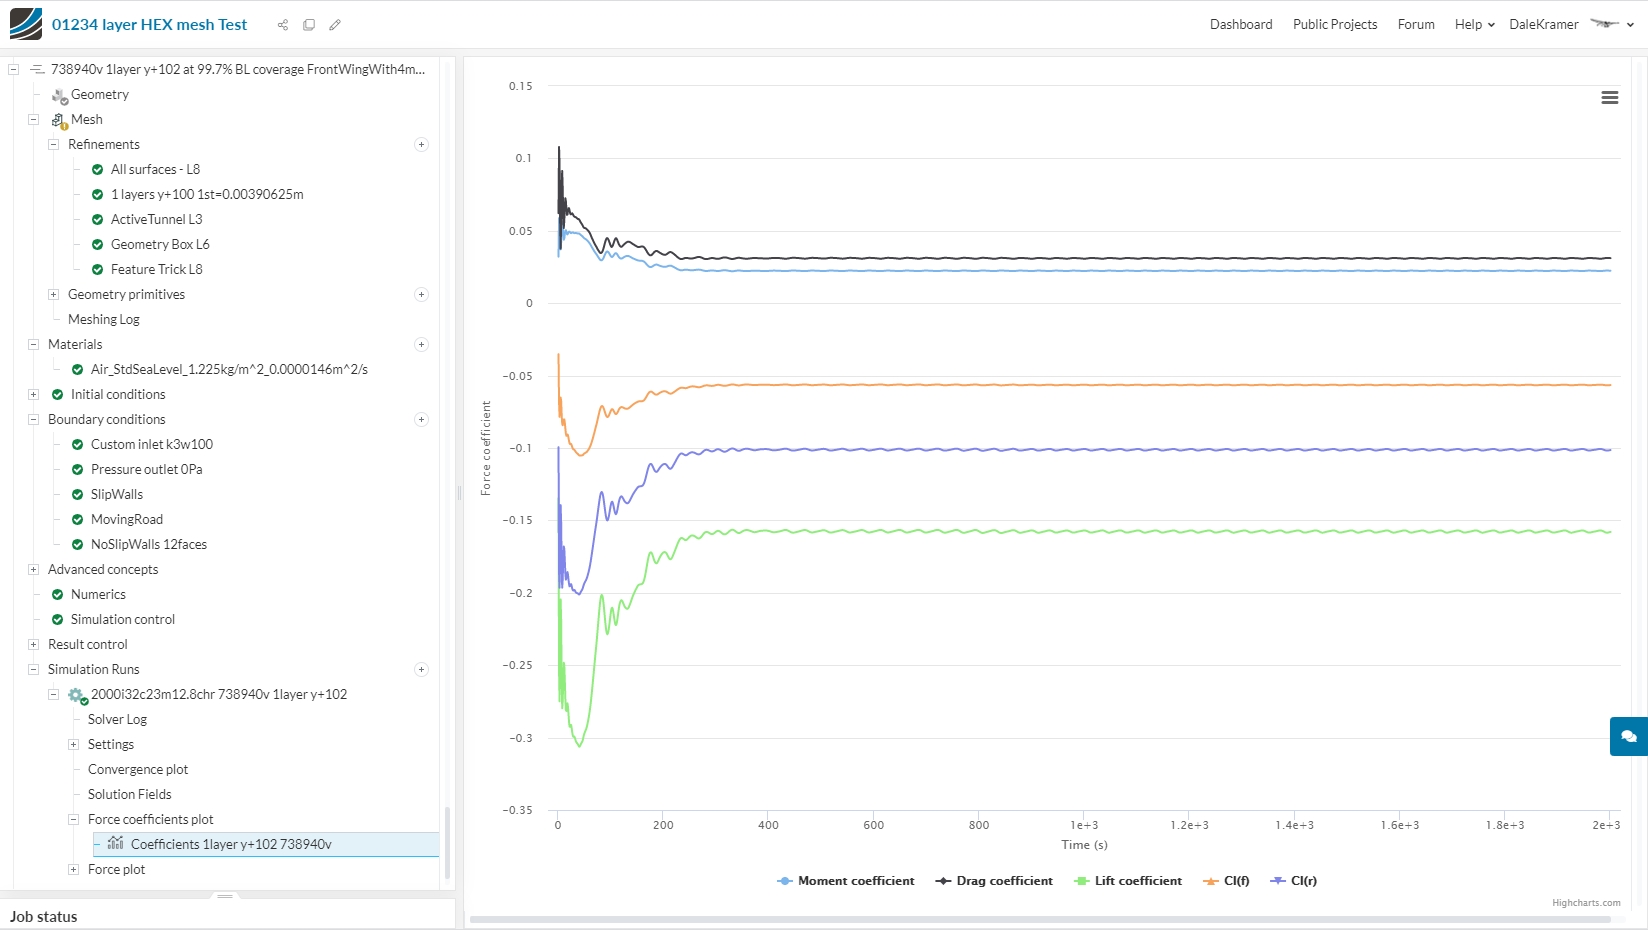
And here are the 8 Coefficient Plots for the 8 meshes of the ‘1 Layer at various yPlus values…’ table:
Dan,
I have come across a 20 year old version of the ERCOFTAC Best Practice Guidelines for CFD…
It is an amazing read and it generally appears to be relevant even today…
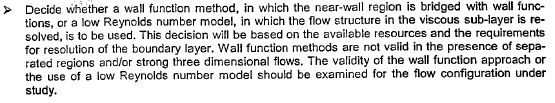
Unfortunately, I am bothered by their 11.6.1 Guideline:
This has HUGE implications for most CFD vehicle studies and even aircraft studies at high AOAs, I wonder why I have not seen this recommendation before and I wonder what Dylan would say about it ?
So this is pretty much saying we need to be careful about using the K-Omega SST model because I know that it DOES combine the near wall functions to resolve the viscous sub-layer. This is also unnerving “Wall function methods are not valid in the presence of separated regions and/or strong three dimensional flows”. Well we definitely do have separated regions, however i think we dont have STRONG three dimensional flows, i would say they are moderate at best. We are not doing Simulations at 600 mph, and the biggest 3 dimensional flow would probably be the rear wing vortex.
Also, i thought the K-Omega SST model was the standard for our FSAE car application. What would we used otherwise, LES?
Can you send me the direct link to this article, i would definitely like to read it, couldn’t find it online.
Also, sorry i havent responded on this thread in a while. I have been working on the porous media and fan simulation and have been having a real tough time in finding the correct Darcy-Forchheimer results for inertial and inherent permeability coefficients. Its more complicated then i thought, i need to get the pressure drop VS velocity graph, and i dont think we got that from the radiator manufacturer.
Nice catch on this one, I think this may have been before K-Omega SST’s time
I will PM you further…
I am afraid I can’t be of much help on your radiator topic, I will follow it tho…
No problem I dont think there is nearly as much info needed compared to this. I dont plan on going in depth at all either, i just need to know generally if im going in the right direction. I think its important to accurately define the drag on the car if radiators and fans are involved. Im hoping the air coming from the fans behind the radiators will help with the rear wake region and reduce drag. I can only hope though haha
1 Like