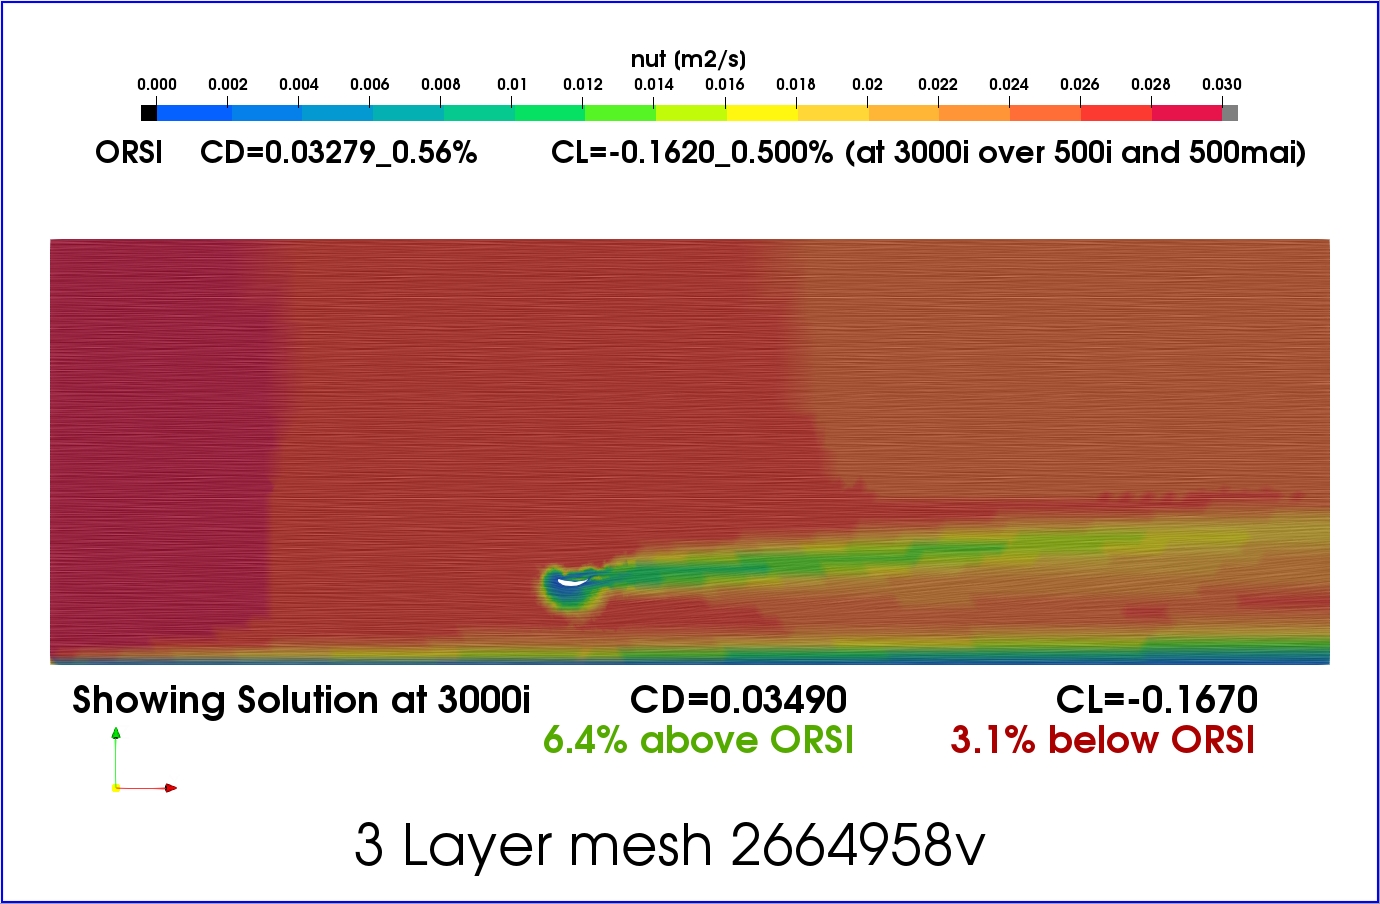
So if i understand you correctly, the fluctuations from the outputs need to be matched with the ORSI results where the exact time step or iteration is showing where we need to take the data from. In the pic below of the oscillating Cd has upper and lower limits. Is the average of these numbers enough or does the “true” value of Cd needs to be matched at where fluctuations are at the 1%, given to us by ORSI.
I understand that the visual aspect of the results is either at the last time step recorded, for what we have done at 1000, or when you manually stop the simulation.
What you are referring to is when the data output is taken when the simulation times out and the data given could be either at the top or bottom peak of the data oscillation correct? Therefore only numerical data can be trusted but the visual indicator of higher magnitude values, like we saw in the 1 layer boundary layer, is not accurate as it could be either the top, bottom, or middle of the oscillating values.
Yes if we want to visualize images and flow patterns etc (anything in a solution set) at the ORSI values. I think ORSI values most accurately represents the solvers idea of what its best guess at the best solution would be (it is always just guessing)…
I would say the ‘best curve fitted’ iteration based numerical values could be most trusted, not just numerical data… (I have shown a visual method of curve fitting and we now have ORSI by moving average curve fitting)… Full solutions sets are just snapshots in the guess process…
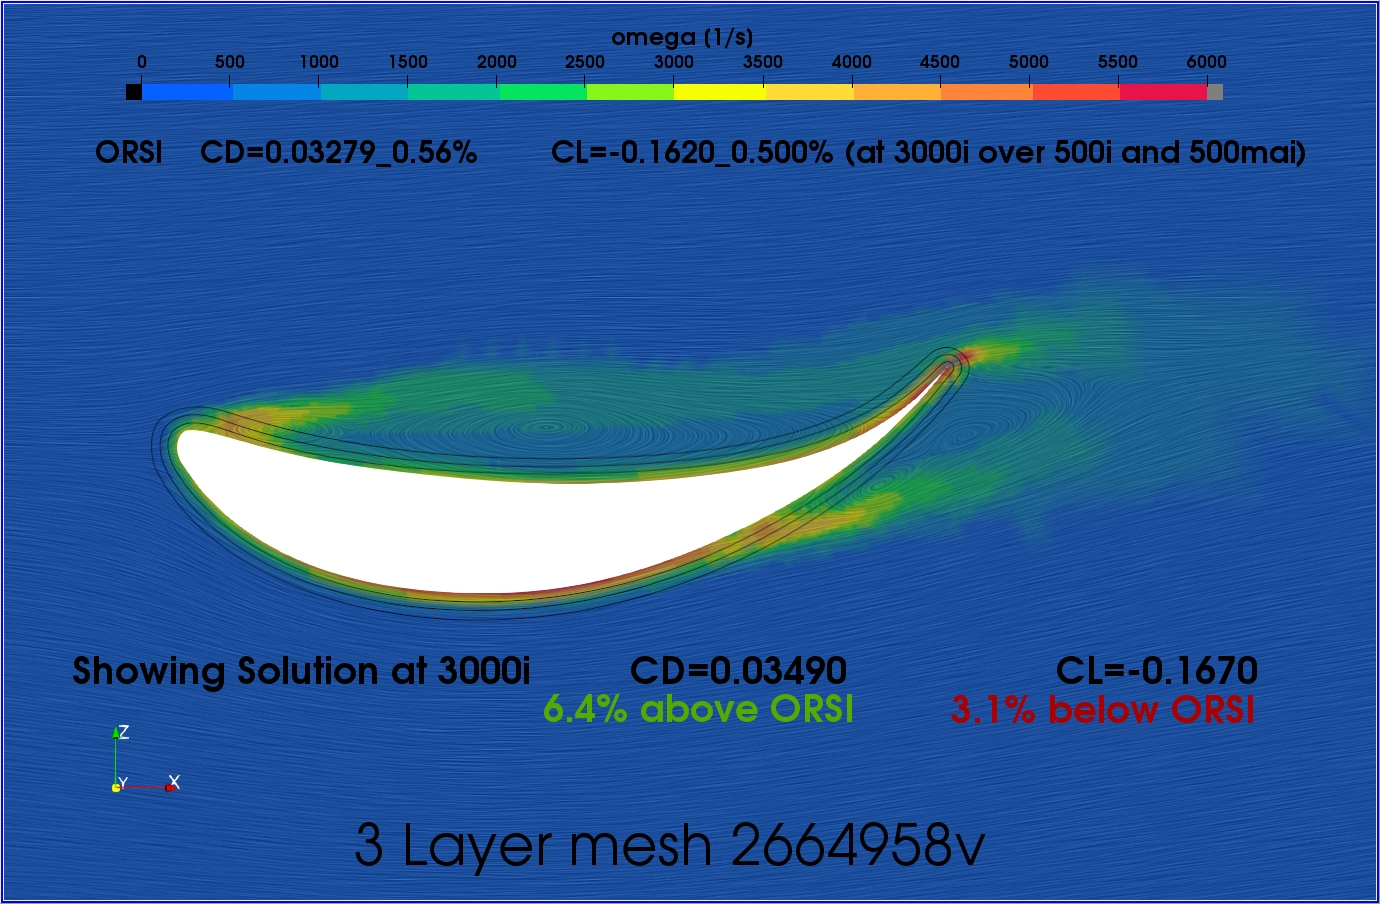
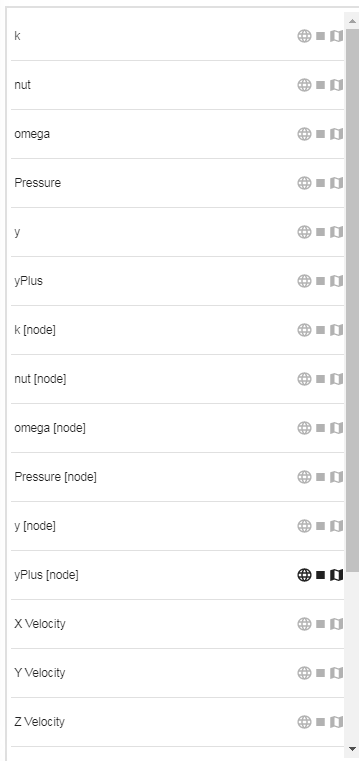
So kinda a beginner question: i see you are using Magnitude and omega for the visuals. Any reason you are not using Velocity and Pressure? If i want to check the post processing in Simscale quick (i will most likely us paraview for almost everything now though) there are a lot of options. There is also normal and node data, i still need to research all of these and i also need to research nut.
There are even more oprtions then this
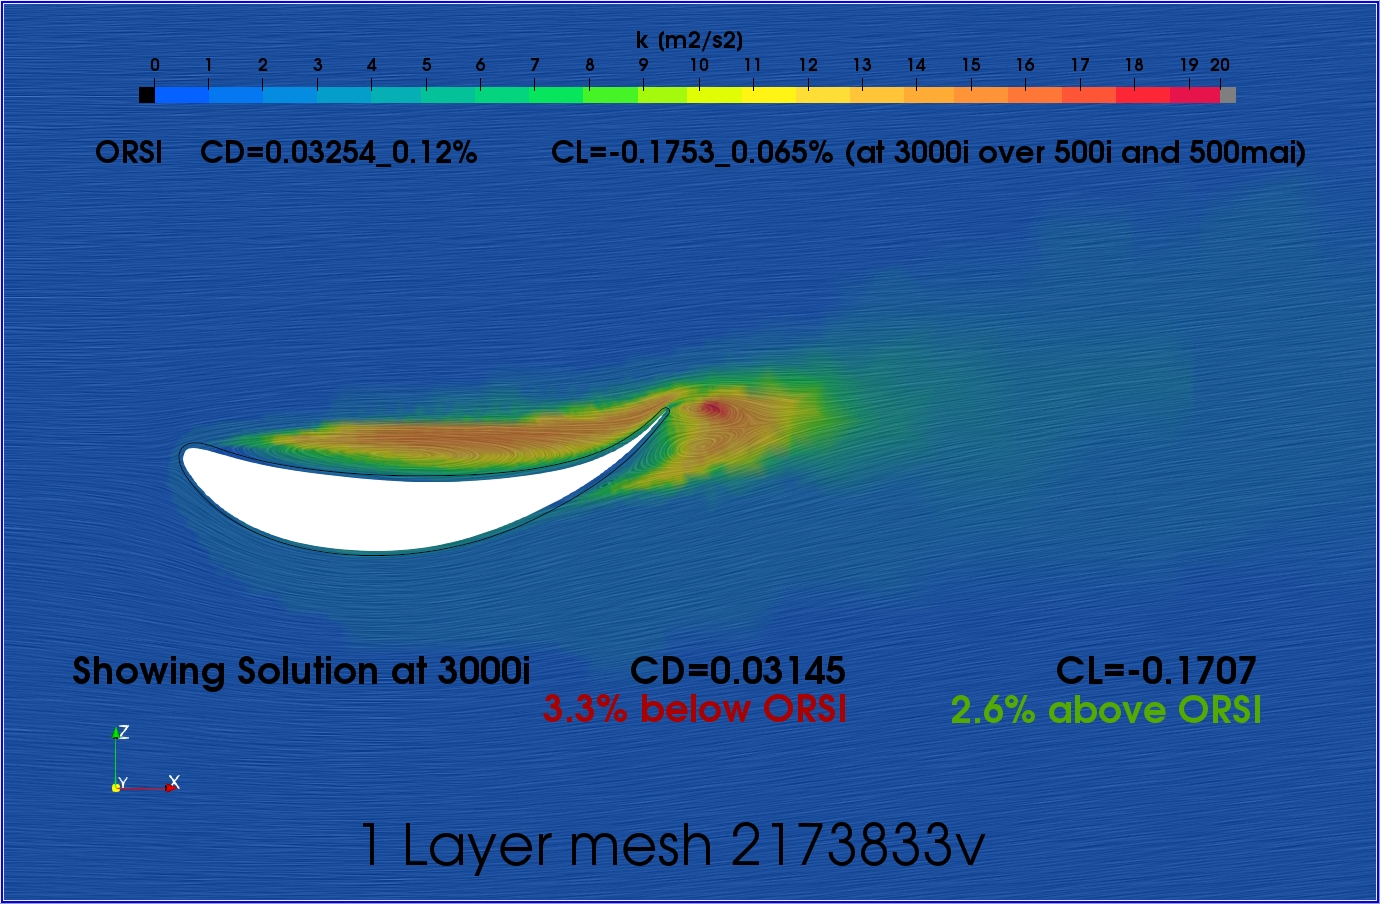
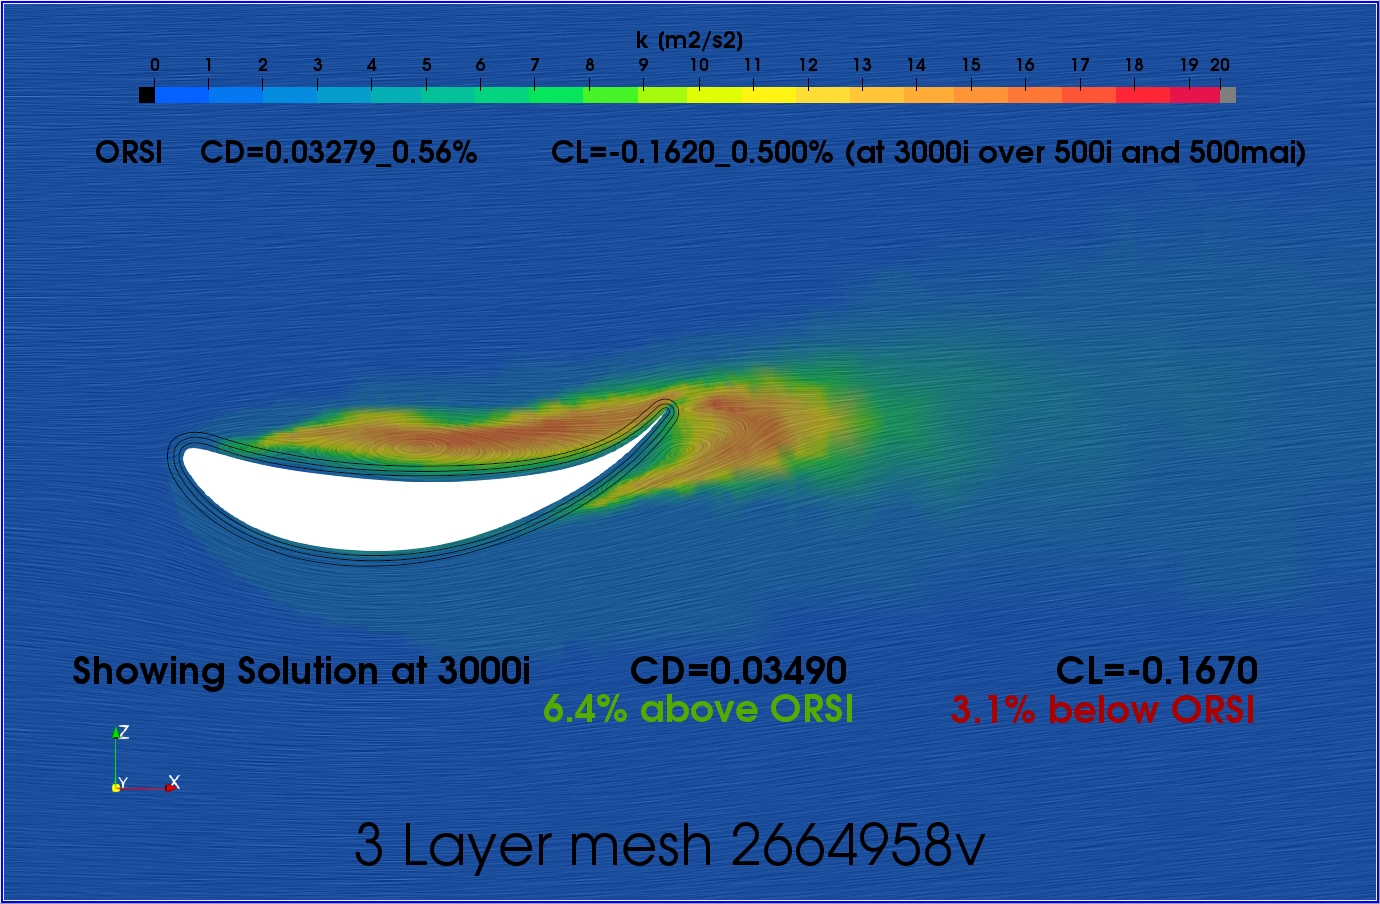
Because I am investigating the effect between 1 and 3 layer meshes and the biggest question I have is whether we are properly calculating properly the boundary layer turbulent area outside that single layer… The turbulence plots will show the turbulent area and as we can see the turbulent area is well outside even the prism cells of the 3 layer mesh (which I think is good if we are trying to justify 1 layer as a good replacement for 3 layers in some cases)… I should add a cell grid overlay to show the extent of the prism cells on the turbulence but it gets a little messy unless very zoomed in…
I showed the U plot, it looked good, so I skipped looking at P (perhaps I should)…
Ok i was just wondering which result selection to look at is best for either turbulence identification, looking at velocity or pressure, or for separation identification. I will research the other selections soon so i know what im looking at haha.
I think the solvers only work on cell centroid data (I think that is maybe the Normal data)… In the end, I think ‘node’/point data is interpolated between cell centroids out to face corners (nodes/points) and this give what appears to be higher resolution ‘node’ results
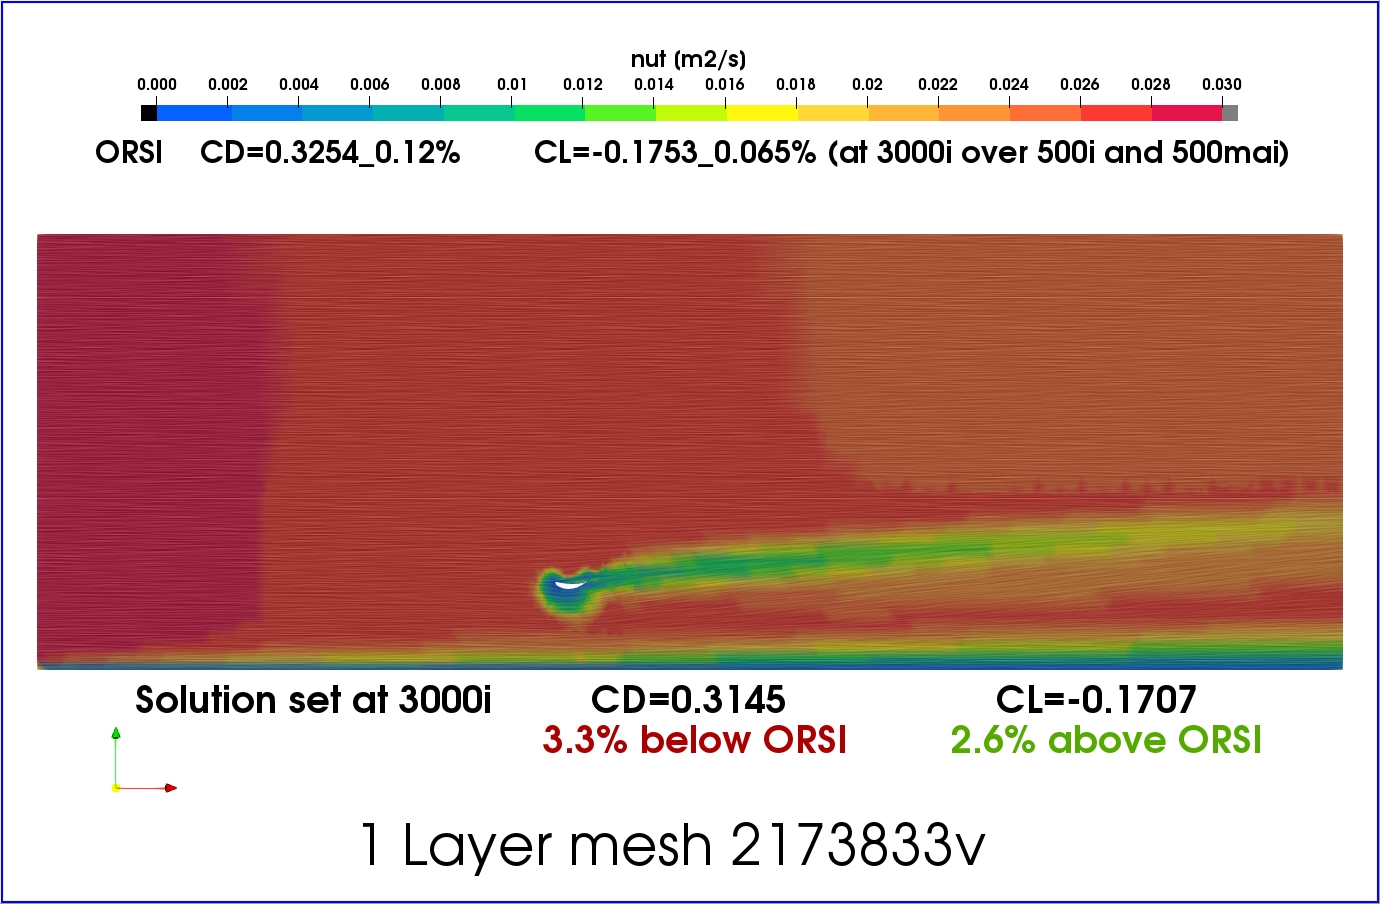
So a quick search for nut info led to this which is the wall functions description from OPENfoam. nut is basically a wall function for turbulent kinematic viscosity conditions and helps determine Y+ readings. Basically way over my head. Ill just understand it as something thats needed but at this point i wont go too deep into this.
A way to use nut/nu to look at boundary layer encapsulation (I still haven’t gotten my nut/nu plots to look anything like theirs ). But since nu is a constant, even the nut plots should look like their Eddy Viscosity Ratio (nut/nu) plots with only a scaling factor difference…
Thanks for the article! I have uploaded a full car model and am now running the mesh using your methods. Here is the link. I have used 1 BL cell for all geometries at 3.4mm and level 9 surface refinements for wings / suspension parts and level 8 for the mono and tires. Hopefully the region refinement areas will not have too many cells.
To combat a potential memory overload problem, if the total cell count is close to 30 million, perhaps your ORSI can help determine the exact iteration zone the sim should run to. Then, I can reduce the iterations from lets say 1000 this run to whatever the ORSI says (hopefully less then 1000).
Like you said it would be great if Simscale could automatically stop the simulation when everything is in the 1% fluctuation range. Would it also work, If I am making successive runs of the same geometry, and know when the simulation should be at 1% to just set the number if iterations to this level so that I dont have to monitor it?
In effect once you have determined a 1% ORSI iteration for a geometry (or very close geometry) and a mesh and a sim setup, I have not found the 1% iteration to change much… Of course, any final runs should be manually stopped at 1% indicated (not the educated guess of the 1% iteration)…
Don’t worry too much about your core hours depleting, I will make sure you have enough for this amazing project… I am also pretty sure, if you ask @jousefm nicely, that you could get some more core hours, heck I think we NEED you as a PowerUser…
Haha those are kind words. Im not sure im at the Power user level but i already have an agreement with Jousef about core hours because im technically sponsored with Simscale for my Masters thesis. I dont plan on needing an excessive amount because my plan is to have 3 simulations to match the 3 skid pad sizes. Then maybe a bit of optimization to change / verify / improve the center of pressure for the car. The entire goal of this project is to improve our cornering speeds through controlling the center of pressure location, which is basically done through increasing or decreasing the down force levels of front or rear wing. This allows the force exerted on the tires to be even on both axles ( if this is what we actually need - only the experimental results will confirm that)
@dschroeder, the offer is active! Good that Dale mentions it as I wanted to contact you anyway If you have the time and like to tinker around (like Dale & Andrzej do) we would be happy to have you as a PowerUser!
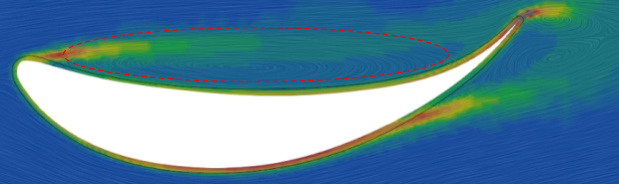
Fist of all i notice two re-circulatory zones in the 3 layer mesh. This begs the questions.
Is this here because if the 3 layer Approach?
Is this here because the iteration shown could be stopped at a different spot of the fluctuation curve? (upper limit of the percent away form ideal ORSI values vs lower limit)
The second observation is that the 3 layer mesh has the BL cells inside of these re-circulatory regions (shown by arrow) Again questions:
Does BL cells in this area give inaccurate results?
Would BL cells in this area give better results. I ask this because this larger BL encapsulates more area transitioning from the log-law turbulent region into the free stream velocity, especially in the more important Low pressure side (shown in green arrows)
@jousefm I would be very interested in becoming a PowerUser! I definitely plan on continuing using Simscale for my other projects after my thesis is completed as i am very interested in learning more about CFD. As you may have seen I am currently asking more questions then answering, but over time i hope to change that.
Even in steady state simulation the flow is ‘alive’. Re-circulation will change shape and transit from two to one seed and then back. On my simulations I usually set a series of snapshots and when playing with E423 airfoil and it’s modifications I’ve seen such a transition systematically. I believe it should be considered normal with strongly cambered shapes… So not a BL 1 or 3 layers are the culprit, it is a nature of flow.
Ah that is extremely useful to know! Its interesting how such data can be misconstrued as evidence for something that is or isnt actually there. Seeing these differences could potentially alter the design flow if these results were accurate. I guess this is why experiments take data from a minimum of three trials, so that results are validated.
Now would i be correct in assuming that if we did a couple of sim runs for each, and they were still different, that we could use this as evidence. A better method might be to take data from time steps at 925, 950, 975 and 1000 iterations and compare those results together.