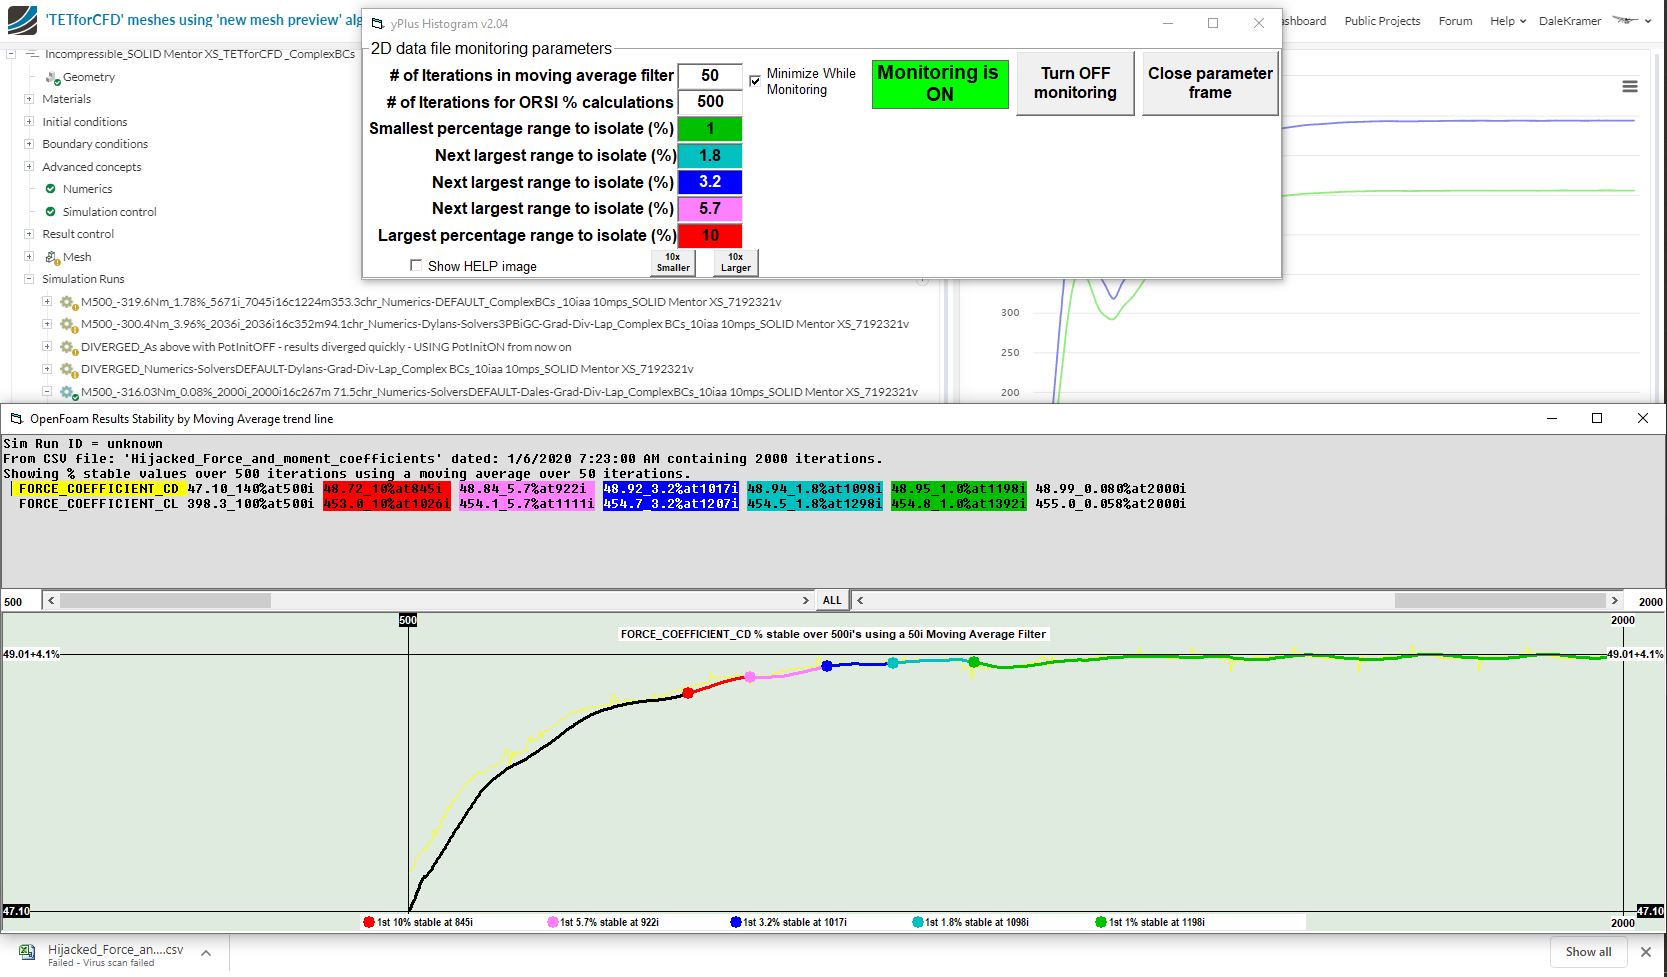
EDIT: ORSI convergence analysis has been added as a feature to my yPlusHistogram program available here: Introducing yPlusHistogram program with ORSI as a new metric for y+ mapping evaluation and convergence analysis
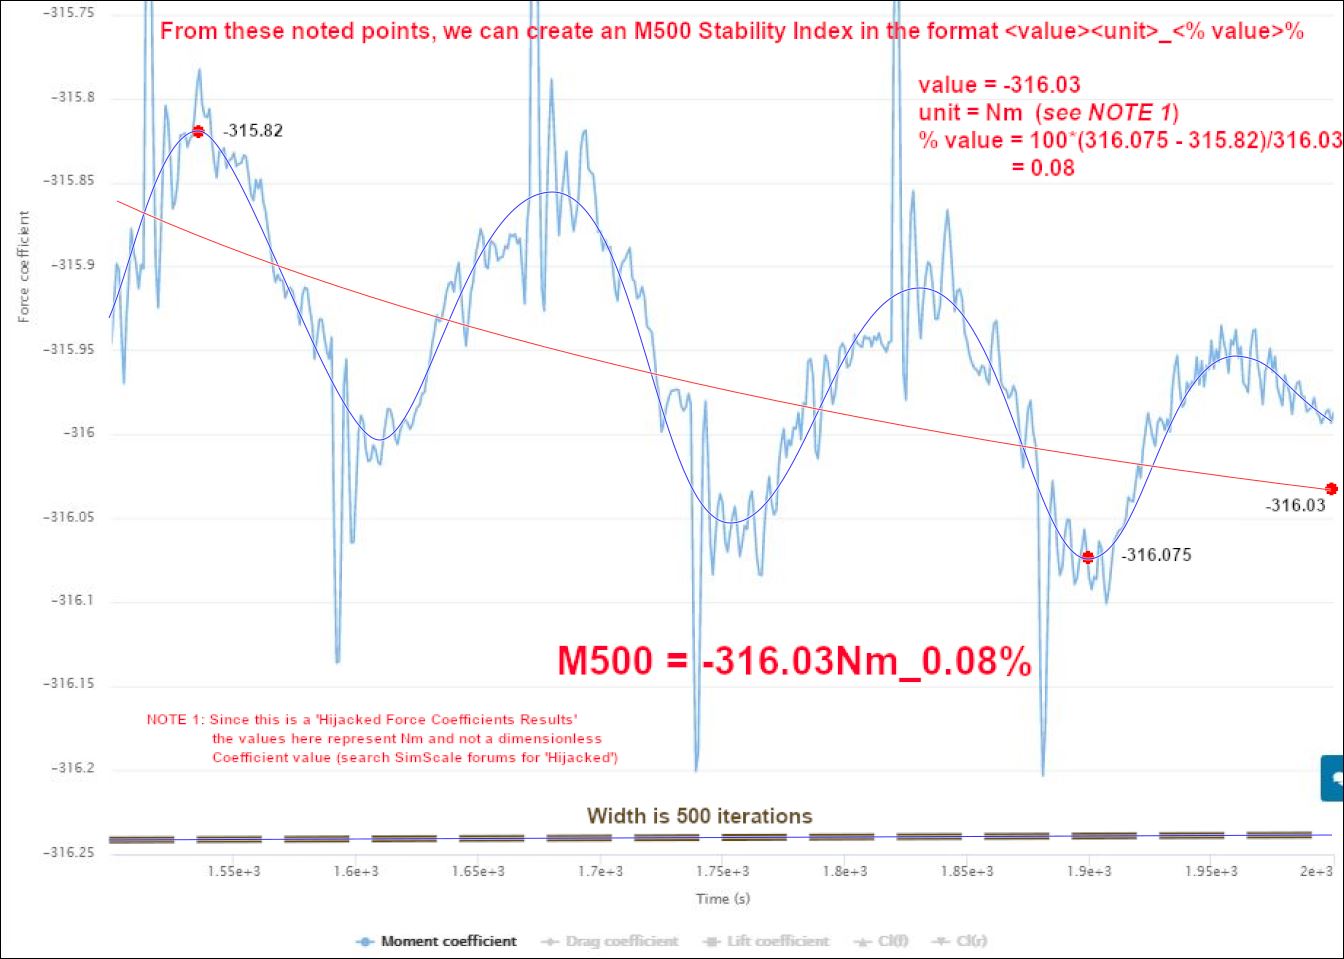
ORSI M500 = -316.03Nm_0.08%
Here is what that means:
- This is an ORSI (OpenFoam Results Stability Index) where the ‘M’ prefix signifies that it is with respect to ‘Moments’ results from a Hijacked OpenFoam Coefficients Results data in the Solver Log. Other valid prefix’s could be L, D, Pfx (pressure force x), Pfy, Pfz, Vfx (viscous force x), Vfy, Vfz, Pmx (pressure moment x), Pmy, Pmz, Vmx (viscous moment x), Vmy, Vmz, Mc (moment coefficient), Lc, Dc.
- 500 is the number of convergence iterations over which this ORSI has been calculated.
- -316.03Nm is the most likely ‘results value’ for the Moment value over the 500 iterations which we are evaluating. In this case it is ‘Nm’ since this is a Hijacked moment coefficient result and is not dimensionless.
- 0.8% is the smallest range, with respect to -316.03 Nm, in which all values for Moment can be contained in over the 500 iterations. Consequentially, -316.03 Nm must reside in that range.
Here is why an ORSI provides a good confidence metric for quantifying the quality of Simulation Convergence.
Lets look at this pretty nasty 2000 iteration Residual plot for a Simulation run on a 7M cell TETforCFD mesh, that has 5 boundary layers:
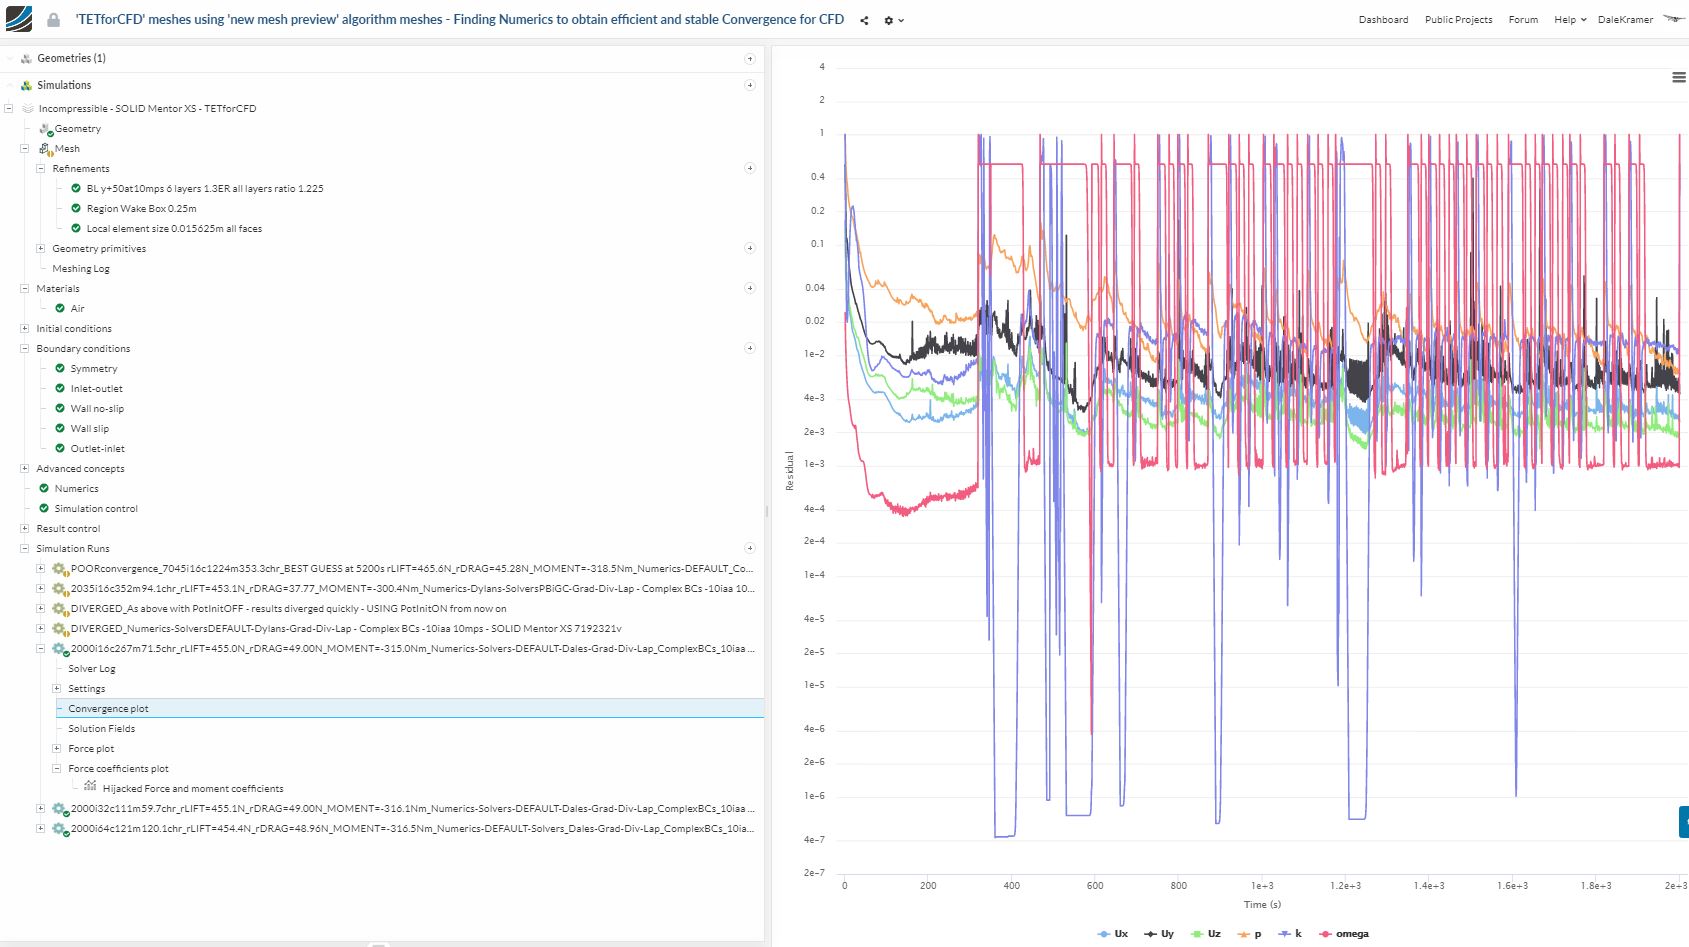
First impression is, the results will be horrible…
BUT, here are the Hijacked Coefficient results:
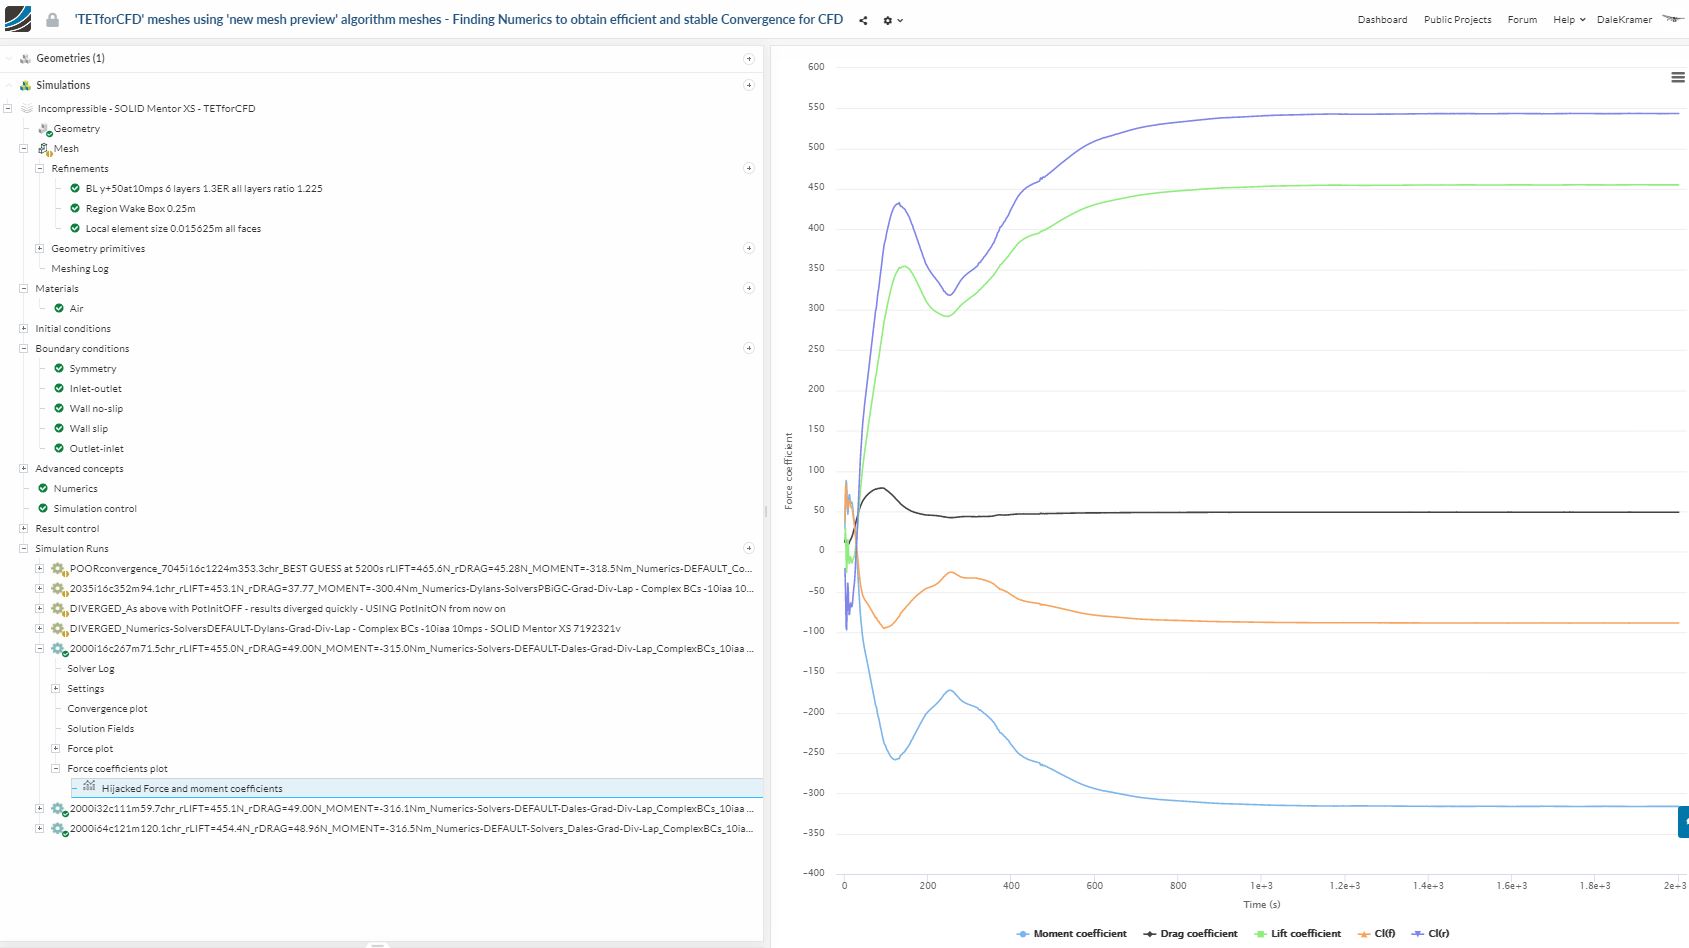
Those results, are in fact, MORE stable than any CFD results that I have ever seen in ANY of my simulations!
In fact this is what inspired me to come up with ORSI, I needed to quantify how stable these results actually were…
Some background:
- About a year ago, @dylan (a former PowerUser here, and someone that I believe should go down in our ‘Hall of Fame’ and be granted perpetual Power User status) chatted with me in a private SimScale PM session (about simulations on a proprietary (at that time) aircraft design of mine). He freely shared a very small percentage of his vast OpenFoam knowledge with me (a lot of which can be found in his old forum posts here). He obtains result accuracies from OpenFoam simulations that are within 1% of experimental (WOW).
.
With that background, Dylan shared that if you want to have results that will match experimantal results to within 1%, not only do you need to have your simulation properly set-up (that is a whole other topic than ORSI’s), you need to get results that are at least 1% stable over 500 iterations … It is that simple ![]()
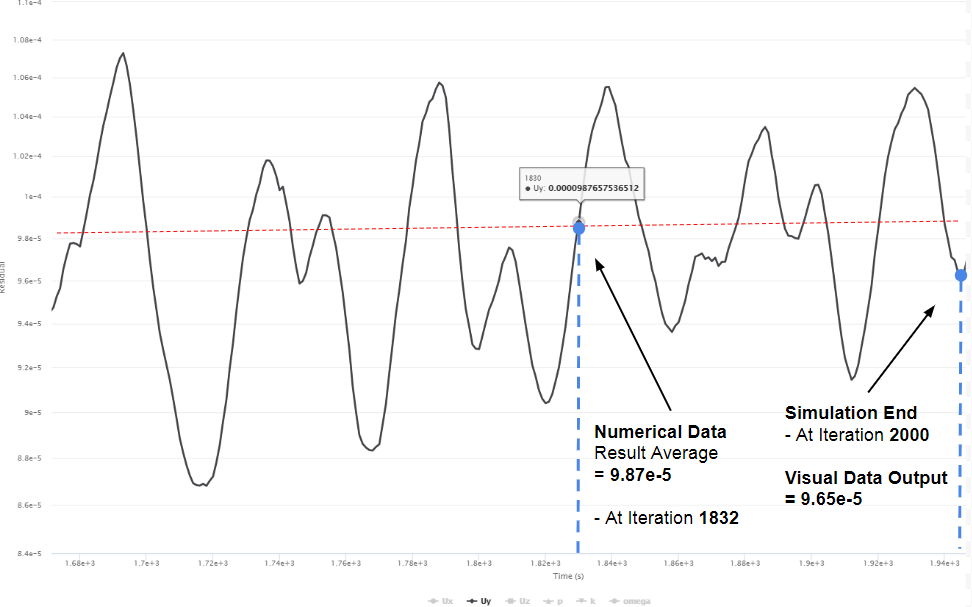
So, I began by looking at the last 500 iterations, and by only having the ‘Moment Coefficient’ variable showing on the plot:
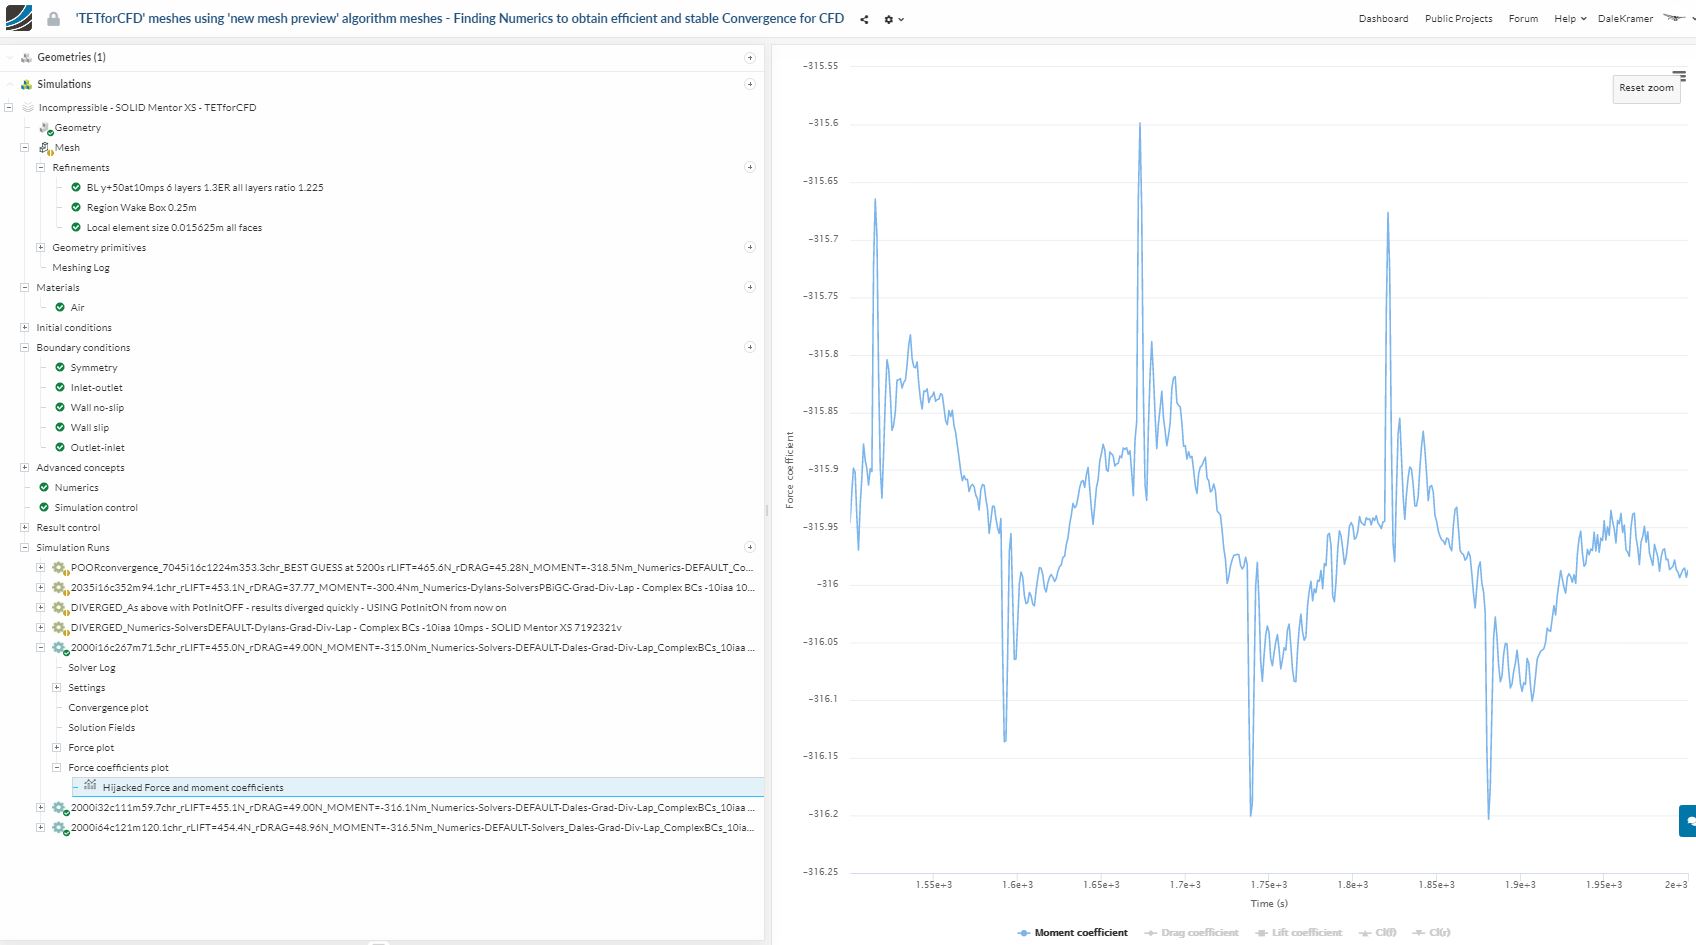
Uck, that does not look stable, does it?
But it really is, what we see are oscillating values that are descending from left to right. There are even damped ‘spikes’ of data thrown in there for good measure. I have found that those spikes are generally irrelevant and are caused by the weird residual behavior, at the spike iteration.
This image shows how to calculate ORSI, and it turns out that generally you do not have to actually make the Dark blue and the Red curves to get a very close estimate of the 3 red dot values that are used in the ORSI formula. You would be surprised how accurate that your brain can visualize and interpolate the curves. You generally can extract the 3 values needed for ORSI calculation by ‘eye’, a fingernail on the screen and/or your mouse pointer ![]() …
…
And a quick note as to why I have chosen only to specify ORSI on data from a ‘Force and moment Coefficient’ result… It is my opinion that a ‘Moment Coefficient result’ value, is the value that is the most difficult of all the results values to get stable in a simulation results. Not only does my experience validate that opinion, but I think the fact that a moment coefficient is a scaled combination of all 3 axis of Pressure and Viscous forces could also validate that opinion ![]()
EDIT: One issue that I have found with using ‘Moment Coefficient result’ value as an ORSI that generally represents all the values that an ORSI can be specified for in a sim runs’ results, is that, since a Moment value is always relative to a rotation point, if the rotation point results in a Moment that is close to zero (at the Aerodynamic Center of the geometry), then a Moment ORSI could be almost impossible to specify that has meaning as compared to all the other ORSI values for that sim run. SO, for the moment (pun intended ![]()
![]()
![]()
![]() ), be careful when the Moment Coefficient Result value is close to zero (for example, use ORSI for other results values to specify ORSI for that sim run). I am looking for a way to ‘normalize’ ORSI values to get around this issue…
), be careful when the Moment Coefficient Result value is close to zero (for example, use ORSI for other results values to specify ORSI for that sim run). I am looking for a way to ‘normalize’ ORSI values to get around this issue…
SO, a big question in my mind right now is…
If you have very stable output results, how much do the actual ‘values of residuals’ mean, as to whether the value of the stable results are any value as to whether they can be relied on, as being ‘GOOD’ results ![]() (I wish Dylan were here
(I wish Dylan were here ![]() )
)
After all, I have 0.08% stable values over 500 iterations, but (if you ignore the ‘long grass’ on the residual plot) only ONE residual even gets down to 1E-3, which itself is 1000 times the 1E-6 nirvana …
OK, flame away ![]()
EDIT: ORSI convergence analysis has been added as a feature to my yPlusHistogram program available here: Introducing yPlusHistogram program with ORSI as a new metric for y+ mapping evaluation and convergence analysis
 Will share it with my colleagues from engineering, maybe they have a comment on that!