How can I get the nodal solution results from single nodes? I made a thermal calculation but in the post processor I think I cant solve this issue. I installed ParaView also but I didn’t succeeded it until now to get the necessary function neither! Is there a quick solution for that in SimScale? My goal is to plot the nodal results vs. the coordinates of the nodes (the tool is actually irrelevant).
Thanks in advance for the answer.
The nodal solutions are identified as “Points data”, as opposed to “Cell data”, which refers to solutions on elements. You can switch the field visualized in the pos-processor using the dropdown menu with the field name. Example: “T [Points Data]”.
To make the coordinates vs nodal results plot you will have to make use of Paraview. In there, you have some options to achieve it, but my preference is to use a spreadsheet program (Excel, Libreoffice, etc.). For that:
- Visualize in the Paraview 3D viewer the relevant field and “Surface With Mesh” or “Points”; this is to be able to see the points location.
- Use the “Select points on” tool to select the desired points to extract data. This is located among the small buttons on top of the 3D scene.
- Create a Spreadsheet view. You do this by “splitting” the view using a button on the top left of the scene which is a rectangle with a line in the middle (splitting the rectangle), and form the options displayed, the last button says “Spreadsheet view”.
- On the spreadsheet view, choose to display only data on the selected points with the button “Display only selected”. This one has a square made of a dotted line and a little cursor.
- Export the data as a CSV file, with the command “Save Data” of the “File” menu. Be sure that the spreadsheet view is selected.
- Open the CSV file with your spreadsheet program. There you can order by coordinates and plot what you want. The coordinates are in the “points” array.
Hope it helps.
@ggiraldo Thanks a lot for a quick and detailed reply! ![]()
@potyka_csaba As @ggiraldo has already explained pretty well. In addition to that I made this small animation with your results to show you how to exactly do what @ggiraldo actually explained.
Furthermore, you can also plot a Point data in SimScale but that data will be plotted against time. In order to do so:
-
In order to do this you need to change your solver to Uncoupled thermomechanical - advanced since plotting data over entities is only available under advanced solvers.
-
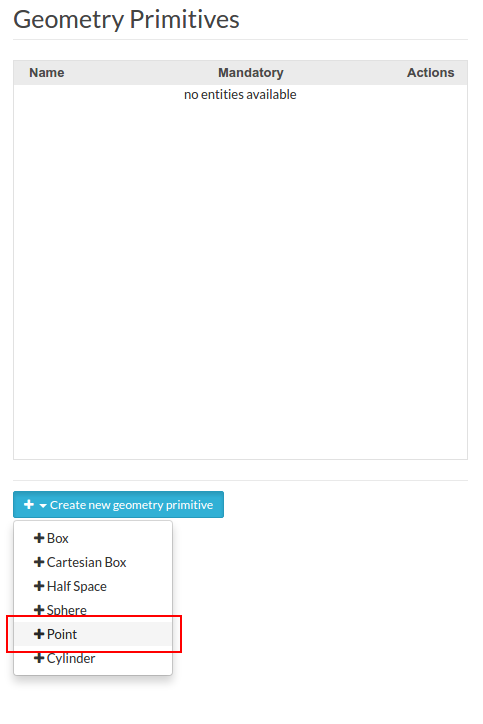
Create a point under Geometry Primitives as shown below.
-
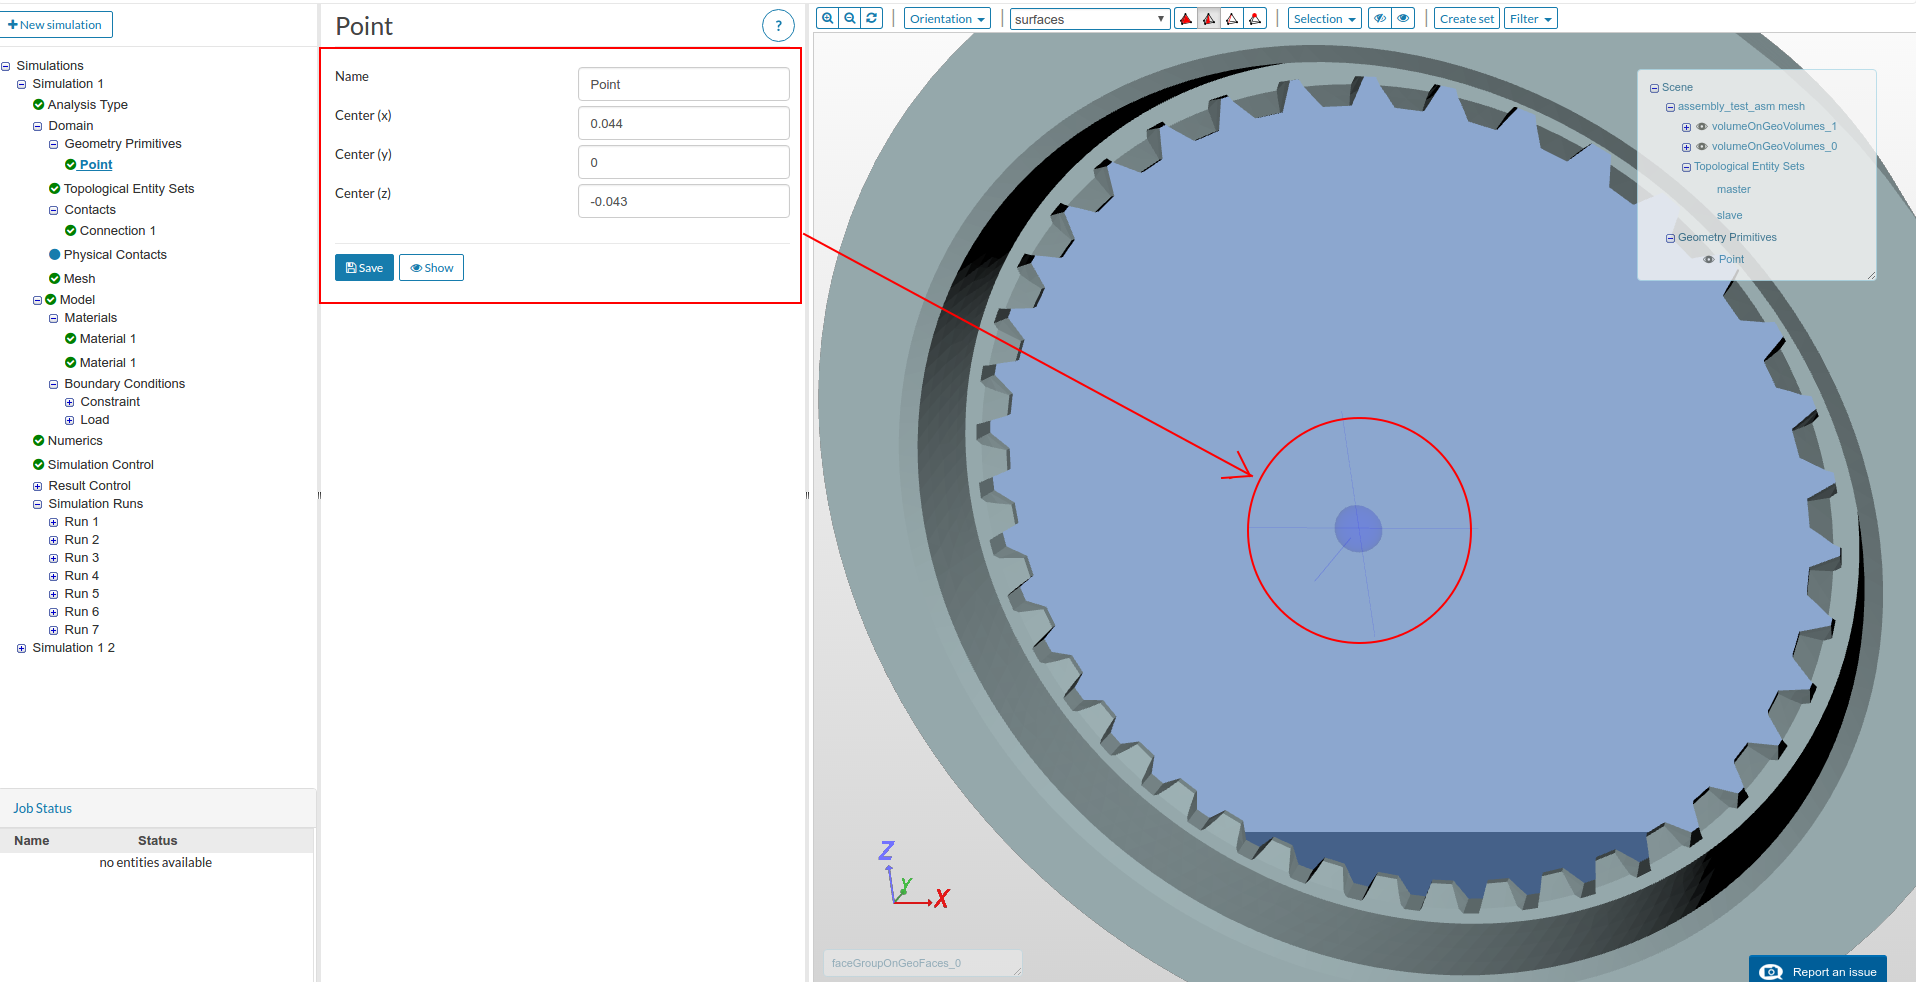
Provide the coordinates of the point you are interested in and then click save. You will see the created point in viewer as shown below.
-
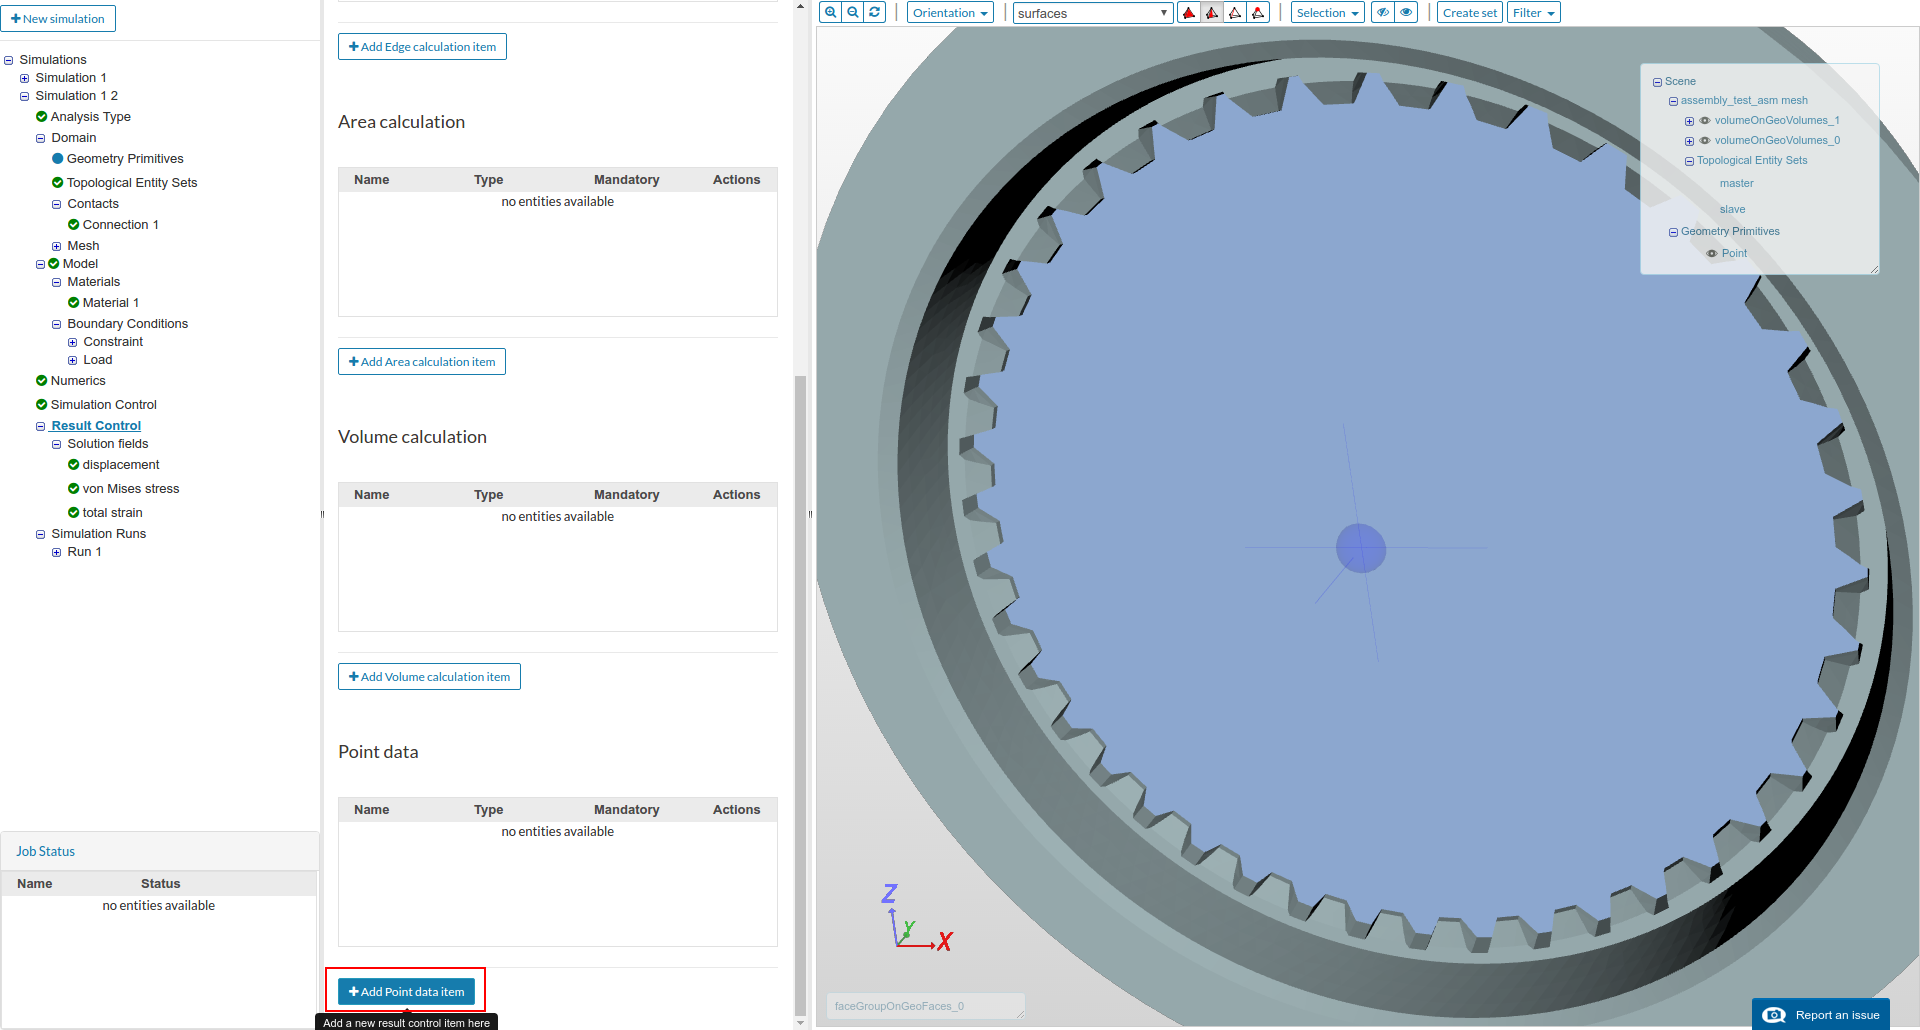
Now go to Result Control and scroll all the down to select Add point data item as shown below.
-
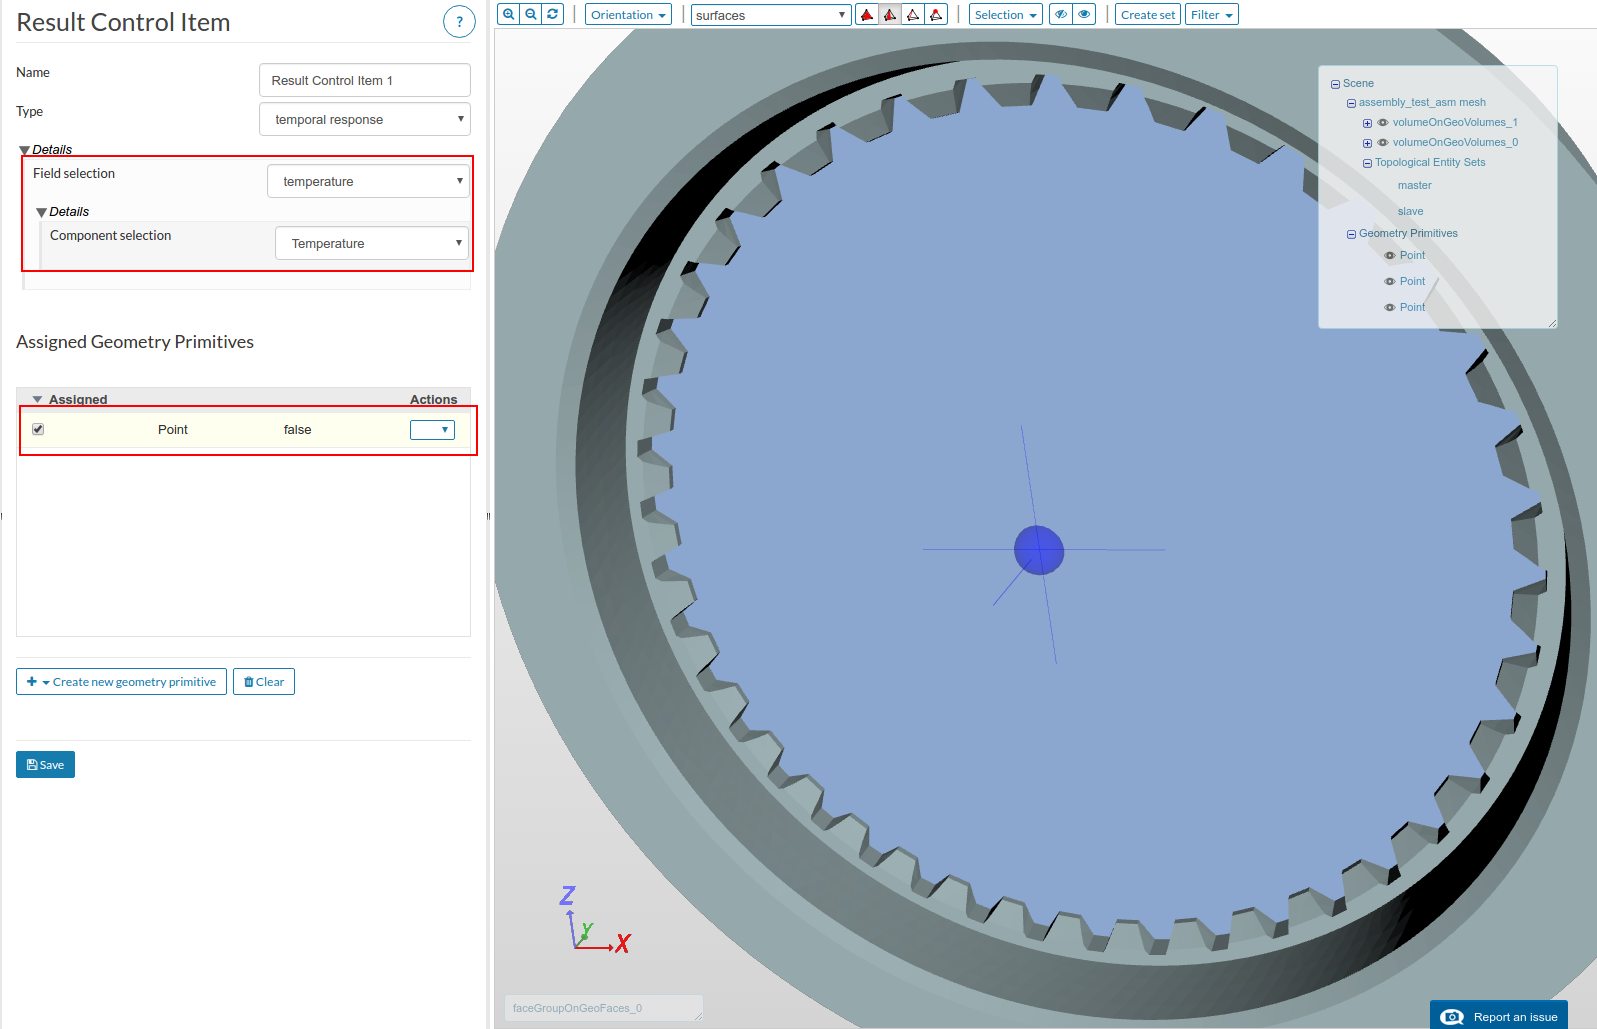
Select the desired field data to be plotted against time. Next select the desired point on which you need this to be plotted. Click save.
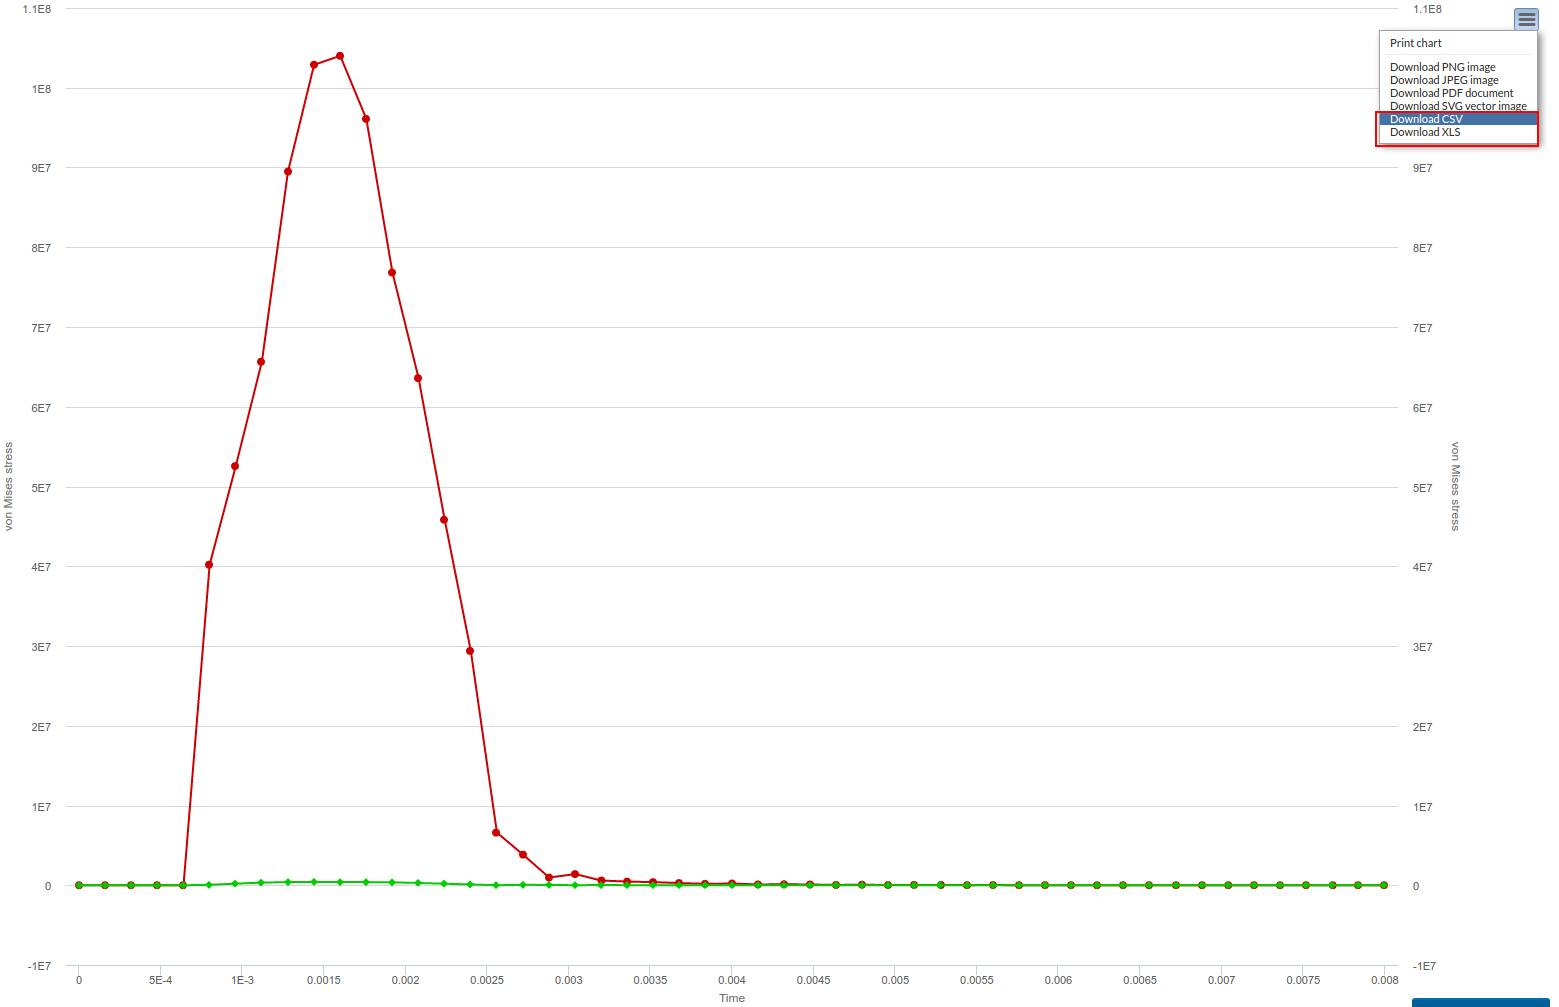
You are done! Now after completion of your simulation, you will see the plotted data under your results in post-processor. You can also download the plot data as .csv or _.xls file from the right corner as shown below.
Hope this helps. If you have any question/s, feel free to ask.
Best,
Ahmed