Hi,
I have been working on constructing a model to assess the aerodynamic benefits of tapering and helical forms to tall buildings., namely the CAARC building.
I ran a simulation to check if all seems okay but came up with some problems in my simulation. I wanted to check with the forum before running the analysis again as to not waste core hours.
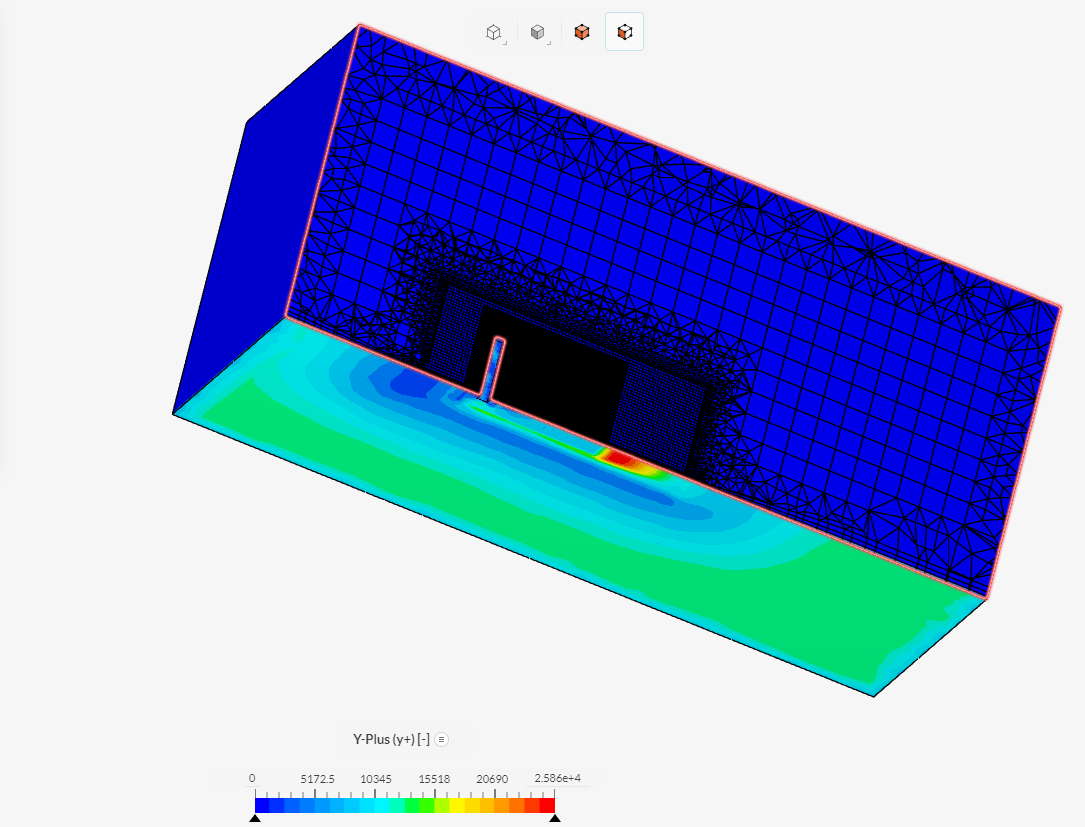
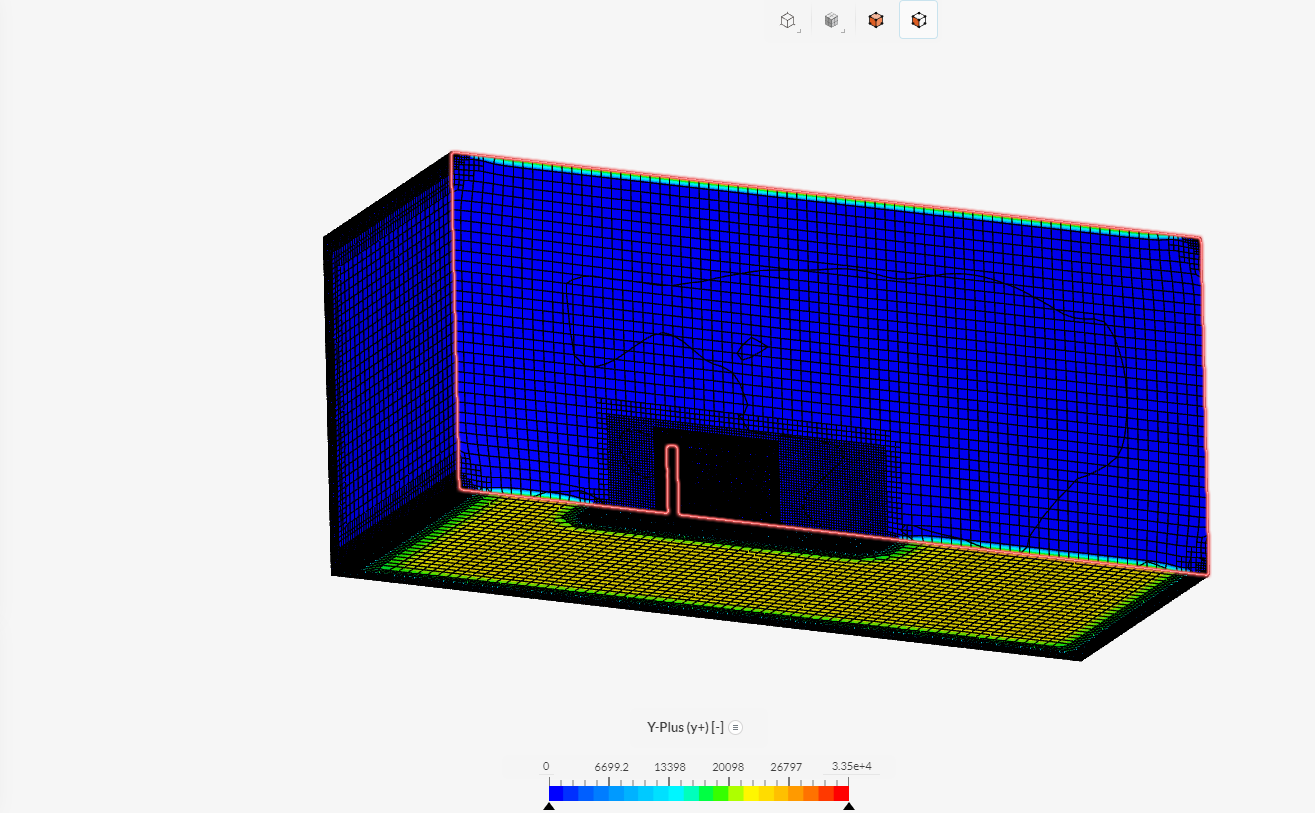
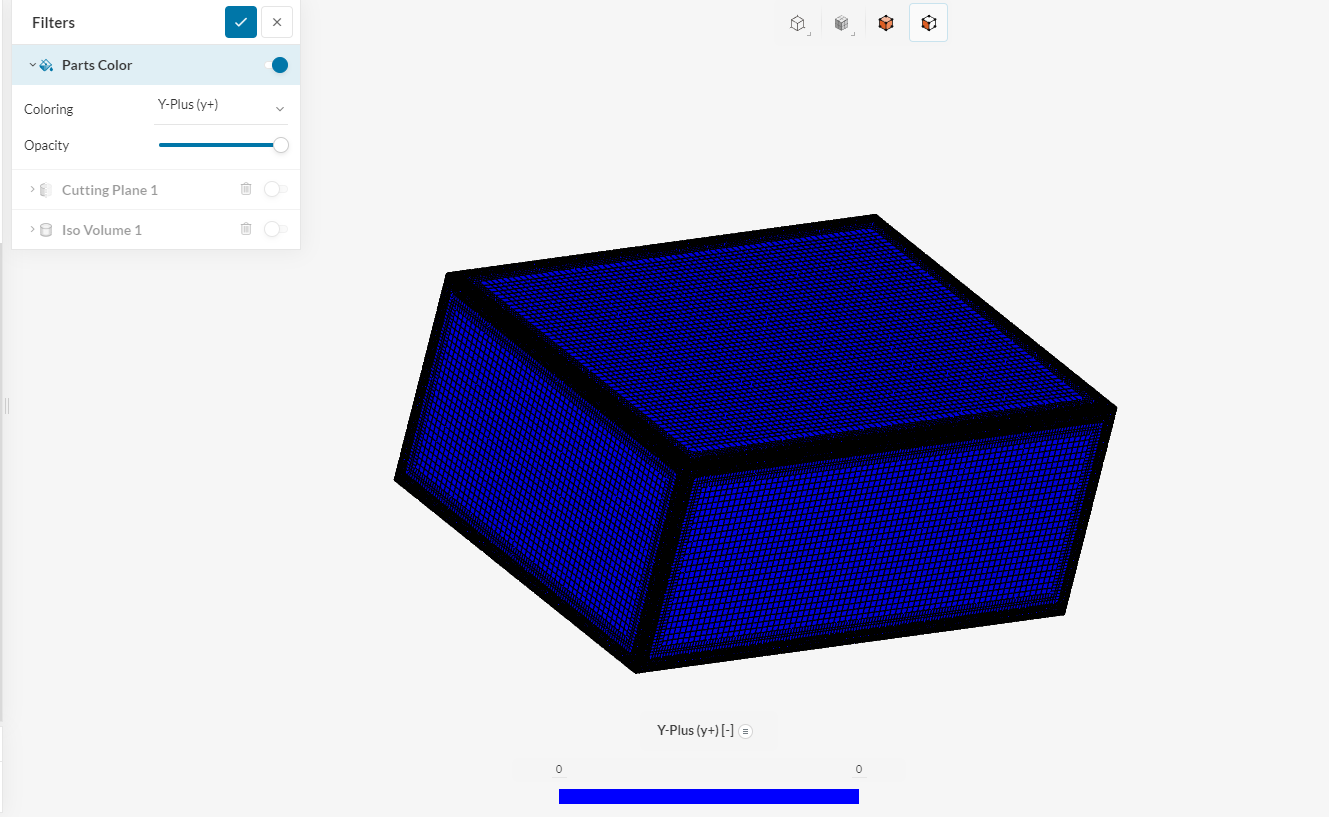
The first issue is with the y+ values, as seen in the image they are not accurate in the slightest, I have recently refined the mesh density to 7 in the standard mesher (in the unrefined area) but unsure if this will resolve the issue. Looking at the mesh it does not seem very well structure and possible need help to tidy this up. I have done a lot of reading to try to resolve this my self but feel as tho I am going around in circles and am now stuck with what to do, any help with this would be appreciated.
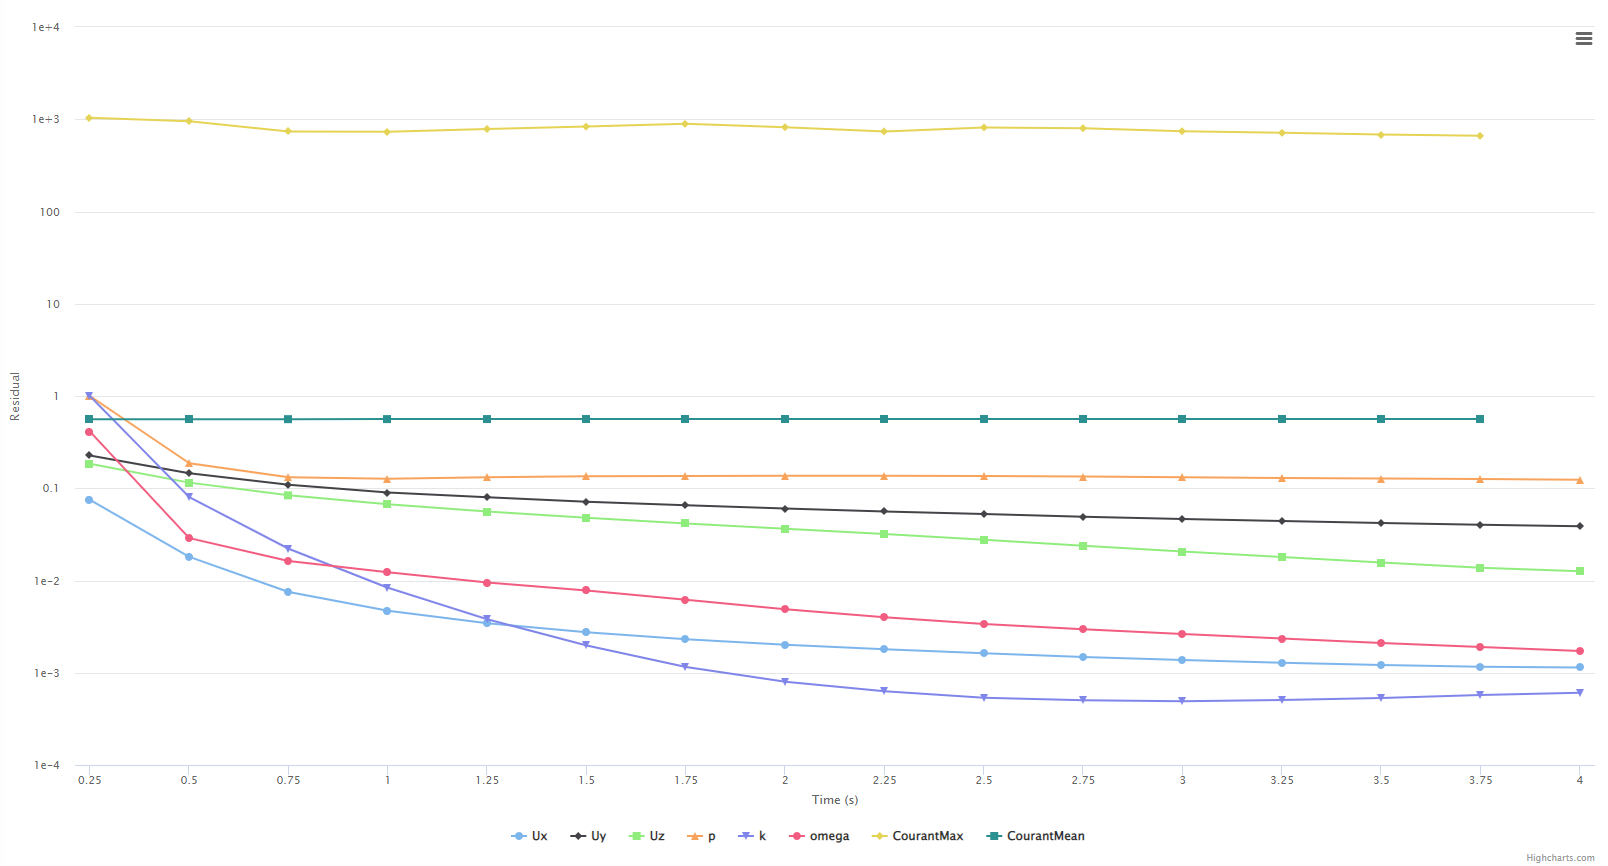
The second issue i am having is with the convergence of my data, I partially believe this may be due to needing the simulation to run for more iterations (which i have now changed). I am unsure on what values need to lie below the 1e-3 values suggested in the documentation. With regards to the Courant number i have made the simulation apply the max Courant of 0.7, which was not done before.
I have also made the relaxation type automatic, will this help? Or would the best thing to do is to make it manual and lower the relaxation factors for parameters that are not showing convergence?
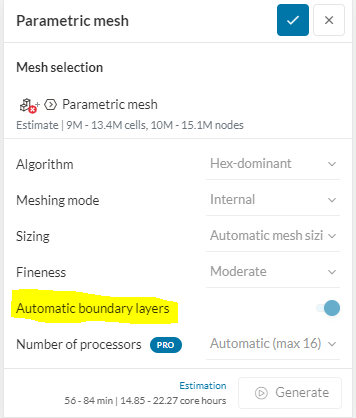
IN regards to the mesh I would suggest you switch to the hex parametric meshes. It’s a bit more tricky to set up but should give you better results, especially for transient. Hex-Dominant Meshing | Simulation Setup | SimScale
Also maybe you can use a half blinding simulation with a symmetry plan, until you have filed in the mesh and then switch to full building when everything look good, so that you save core hours.
Do you believe that a steady state analysis is suitable enough to accurate figures for the Base overturning moments, pressure on the building face and overall drag coefficient of the building?
If I was to use the steady state analysis, would a hex dominant parametric still be required?
I am going to later add new geometries for the building, this will include tapering and helical forms to the CAARC building so symmetry may not be acceptable. Rather are you suggesting this to validate the basic model? @SBlock
EDIT
To add, when you suggest the new meshing option would this be for the entire domain, i.e, remove the refinement zones and simply use the new meshing option?
For both standard and Hex-dominant, you can manually set the boundary layer height to get the correct Y+ values. If you are concentrating on drag then consider measuring the viscous sub-layer using a Y+ less then 1. If you are trying to measure overall turbulence then concentrating on the log-law region would be better, this is a Y+ between 30 and 300.
You can set this by adding a boundary layer refinement to your model. You can use an online calculator to determine your 1st layer height, which is based on wind speed, temp etc…
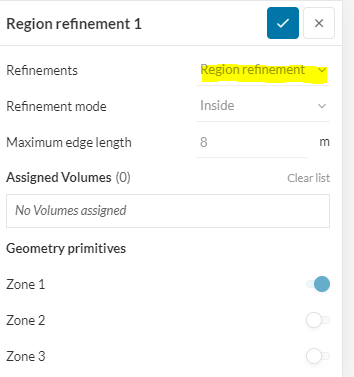
Thank you for your help, with regards to the boundary layer should this be applied on the surface of the building or for the region you have shown (Zone 1).
Also would it be possible for you to send a link to a reliable calculator please?
EDIT
I believe i have found a calculator here, aiming for a y+ of 30, using velocity of 43m/s and a length of 180m (building height) i get a value of 9.195e-4m (0.9195mm)
is this the correct use of the inputs, sorry if this is a silly question, I am still getting to understand CFD analysis.
i guess for the load analysis is should be enough to perform a steady-state analysis.
In regards to the Y+ calculator. I would aim for a Y+ value of 50 so that you a bit clearance to y+ values of <30. I think the values are correct though I’m not sure if you use the height or length of buildings for the calculation of the Reynolds number. I personally would think it’s the length in the flow direction.
I have tried to click on the project to look t the mesh settings but am unable to do so. I tried to copy the project but cannot access the mesh refinement?
Also to add, I used the hex dominant with a fine mesh and ran the simulation, my y+ values remain very high, what would the best course of action be to try resolve this? I might add that i only ran the simulation for 5 seconds, could this be an issue?
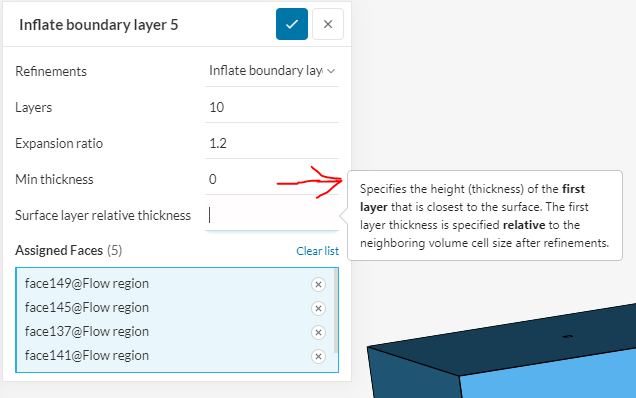
I have adjusted the parameters you recommended and wanted to check with you before running the mesh calculation. I used an online calculator to determine the first cell height for both inflation layers.
HERE is the Y+ calculator that I use. Whichever calculator you use just be aware if it measures the Total cell height or cell centoid. This one does total height.
You apply the boundary layer condition to the surface. This will inflate layers away from the building surface in relation to the local mesh size (relative). This can be a bit confusing so do a little research within the forum.
A Y+ of 30 is minimum, as @anon41772514 said, around 50 is a good target, possibly higher based on your simulation speed. What is important is that the Cell centroid is above the Y+ 30 mark as this is what is measured. You also would use calculate using the building width ( parallel to flow)
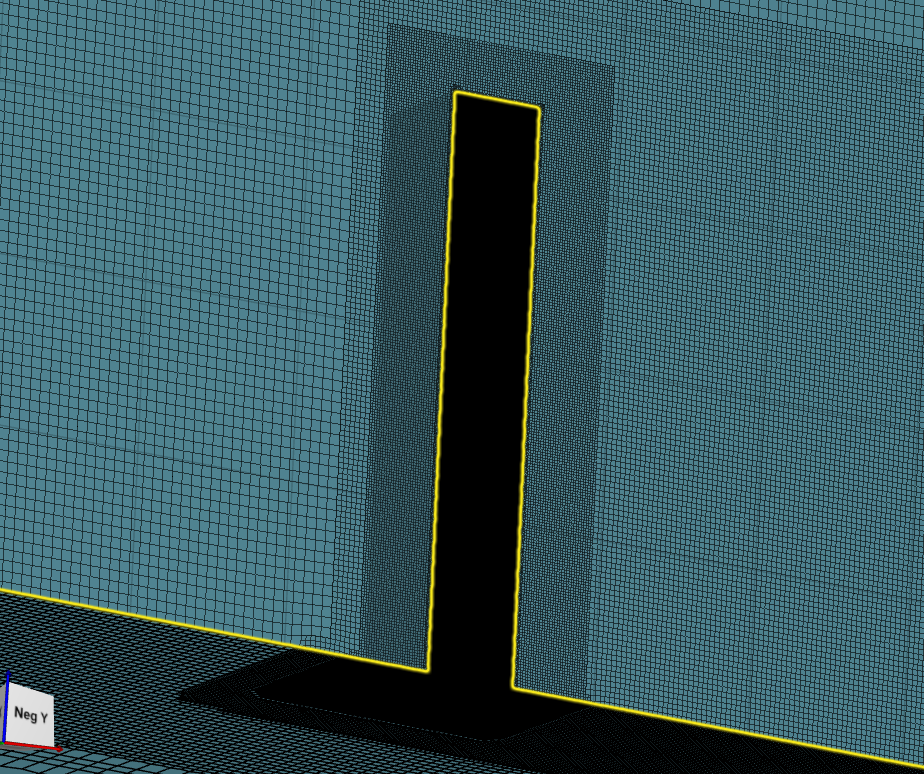
Cutting your model (0 deg setup steady state) it appears that boudary layers were not inflated at all.
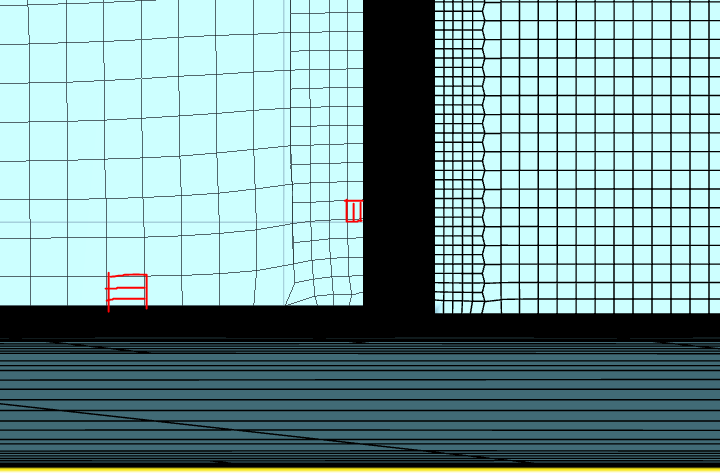
If you did have inflation, there would be thinner layers (rectangles) that are progressively thicker, until the normal mesh resumes. You have to check for this before you try a simulation.
The second inflation is correct. The first one has too many layers and is maybe why they didnt inflate. 3 is a good starting point an i have had success with even just 1. Based on the local cell thickness you need to calculate the relative thickness.
EX; if you have a 2mm local cell size and want a 1mm thick first boundary layer, you would put 0.5 for surface layer relative thickness. With a 1.2 expansion ratio, that would be 1mm + 1.2mm second layer, + 1.44mm third layer.
@dschroeder
Hi thank you for this information, i have used the suggested calculator and get a total cell height of 1.1mm (rounded). How can i check the local cell size of my mesh?
Also when you gave the example and said the surface layer relative thickness is 0.5, is that simply from dividing the desired first boundary layer thickness by the local cell size? (1/2).
Thanks again for you patience and assistance, it is much appreciated.
Hi ss02150,
you can use the mesh quality scene for the mesh analysis.
There is also a filter for the min edge length under the cutting plane section.
And yes a first relative thickness of 0.5 would give you half the size of the first neighboring element cell.
@anon41772514
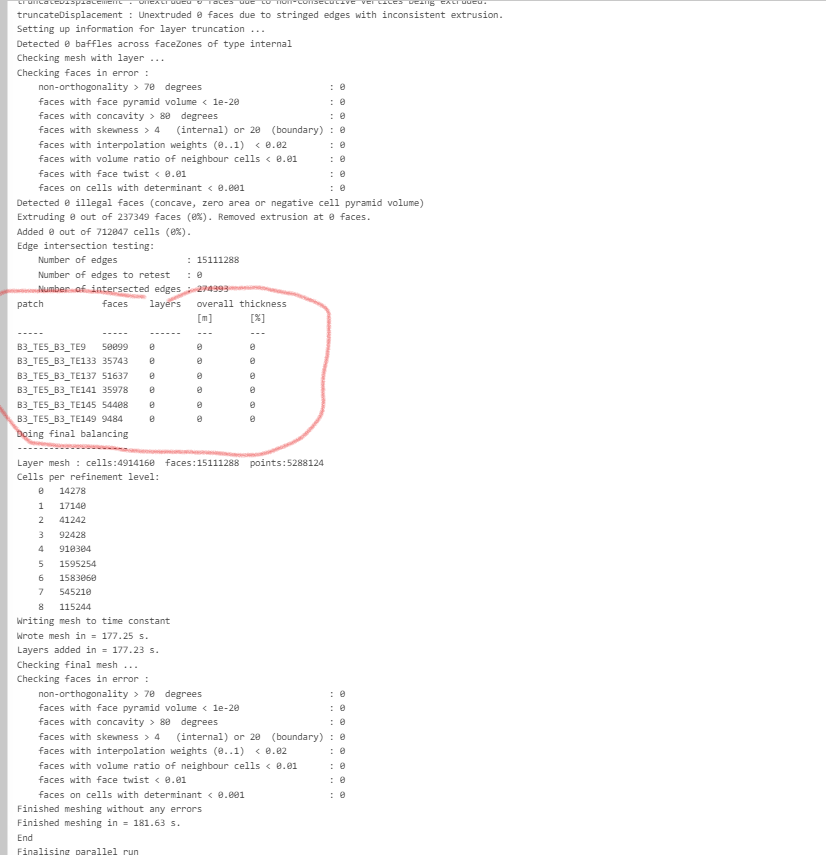
I was looking around in the forum and noticed that a prelimary check that can be done is to look at the moshing log, it states if the values in the table are 0 then the layers have not been applied, in my case the table values are zero, does this mean the inflation has not been applied
Yes I forgot to mention that. In the meshing log you can check if they inflate. In your picture, this is the correct place to check and it appears that you still dont have inflation. The solution is to play around with the inflation settings.
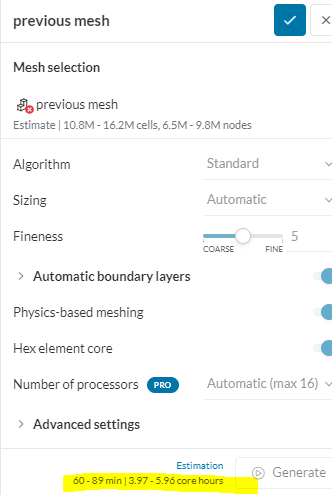
I would also recommend that you try to get the settings you want using a smaller bounding box and building geometry. That way you dont use so many core hours and the mesh is created in a few minutes. When you have settings that achieve inflation you can apply them again to the full size model. Just be aware that the settings are not always successful when scaling back to the normal test size, so you might have to adjust them again slightly. You can also try very easy settings to achieve inflation and build from there.
After playing around with the inflation layers I decided to let the model run, I applied the slip condions to all boundaries excluding the inlet and outlet. After running the model the y+ values came out as zero? Which i did not expect. Can this simulation be deemed okay?