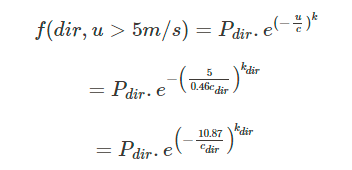
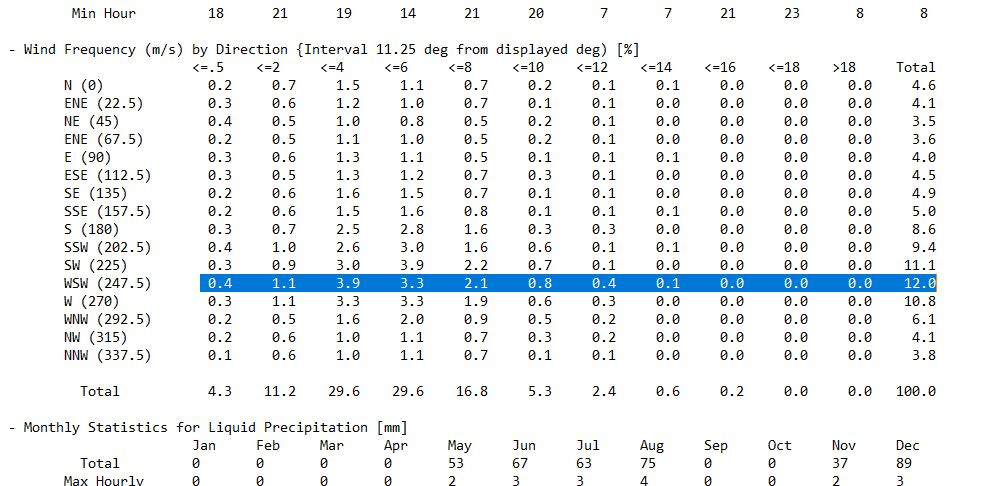
The bit I’m not clear on is the k_dir and c_dir, which are the Weibull distribution constants for a particular wind direction, so (in the wind data below) does this mean literally the distribution of the blue highlighted data, where the peak value is 3.9% ? …or does that line of data first have to be normalised (so that the total probability of that line equals 100%)
You can understand the construction of a stat file as taking a series of wind data, “labeling” each one of the data points with respect to velocity and direction, and then placing each one of these into “buckets”.
For example, say that you have a total of 1000 data points for wind direction and velocity. Out of the 1000 data points, only 2 of them show a velocity less than or equal to 0.5 m/s with a north direction. This “bucket” (north and V <= 0.5) is the very first entry of the table, where you see a 0.2% probability.
For the second “bucket” of the first row, the wind velocity is now going to be less than or equal to 2, but greater than 0.5. This gives you a 0.7% occurrence.
By following the same logic, you can fill the rest of the entries from the table. So yes, the data that you see there has already been normalized.
Hi @garcfd ,
for getting the c_dir and k_dir parameters for a specific direction you indeed have to normalize the data and then compute the Weibull Distribution parameters using a parameter fitting algorithm.
Can you recommend any particular method for obtaining the best Weibull curve-fit?
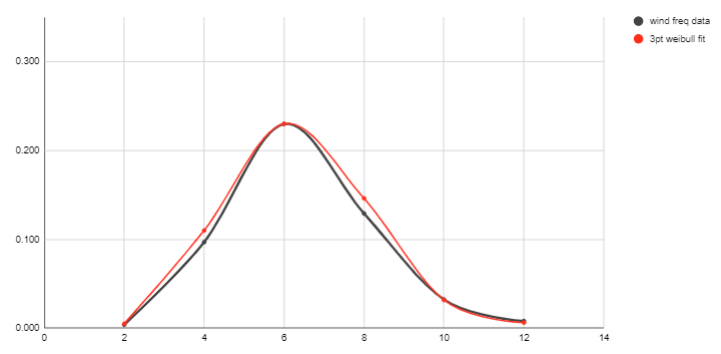
I have some sample wind data (just 6 values), and can get a good curve-fit by trial and error,
using 3 parameters for the Weibull curve (c, k & location), but need an automatic method.
Hi @garcfd , I usually use python, I actually have something publically you can use here:
And an example here:
Input is wind data in an hourly continuous format (EPW in this case), the output is a statistics file and wind rose (based upon the fitted Weibull distribution)
If you want to know the Weibull parameters for each dir just do something like this:
print(weather_stat.weibull_parameters)
and that gives you a table.
Also, weather_stats.plot_cumulative_distributions() actually plots the cumulative distribution for each direction.
Wow, that looks like a gold mine of information - could be really useful.
Interesting that you work from the .epw file rather than the .stat file…
(which also contains the wind frequency data)
Hi Giles (@garcfd), yes, I tend to use hourly data because I can actually define the periods I want to assess for, so for example, seasonal assessment, winter or summer or even between typical working hours 9am to 6am or something. Then do the Weibull distribution on the filtered hours.
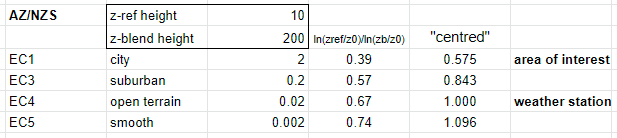
I think the number for AS/NZS are all wrong
for blending height 200m I get these factors
EC1 0.39
EC3 0.57
EC4 0.67
EC5 0.74
which when centred gives this
EC1 0.575
EC3 0.843
EC4 1.000
EC5 1.096
Hi Giles,
Thank you for the feedback.
I am wondering if you could kindly elaborate more as to why you think it is wrong? possibly some information on your method of calculation would be a good point to start.
I will double check this part of the documentation page myself again and come back to you once i collect the necessary info.
Best regards,
Khairi
thanks for reply - the method I used is roughly described below,
Using this method I got the same values (as Simscale) for the
previous example 5.1 Eurocode. But when I use same method for
the following 5.2 NZ/ASS example, I get different values from Simscale.
Thanks for sharing the methodology you used. I checked the information present in our documentation and I can say that it is indeed correctly reported.
I’ll explain below:
I did a re-calculation of the correction factors for both the Eurocode and AS/NZS based on the methodology you used above and I can confirm that I get the same values as you.
However, we need to remember that the AS/NZS standard utilizes a completely different approach in modeling the wind profile which is based on the Deaves and Harris formulation and not the openfoam formulation. (This is also stated in our documentaion)
The blending height approach you took does apply for the Eurocode as you found correctly. However, it does not apply particularly to the AS/NZS standard.
For the AS/NZS standard there are tables defined in the code that specifies the terrian correction factors based on the building height. For example, in the AS/NZS 1989 standard you can find those corrections in page 40 here (this is a free online version of the AS/NZS 1989 code available on the web). When you center the values at 10 m height in that table around terrain category 2 you will get the same values provided in the documentation. The reason we use this approach for the AS/NZS correction factors is simply because it is the code recommendation on how to approximate the terrain correction factors.
I hope this clarifies your concern.
Best regards,
Khairi
Hi Khairi,
Thanks again for your clarification of this documentation.
I just had a look at the reference p40 you described, and I can agree with your values,
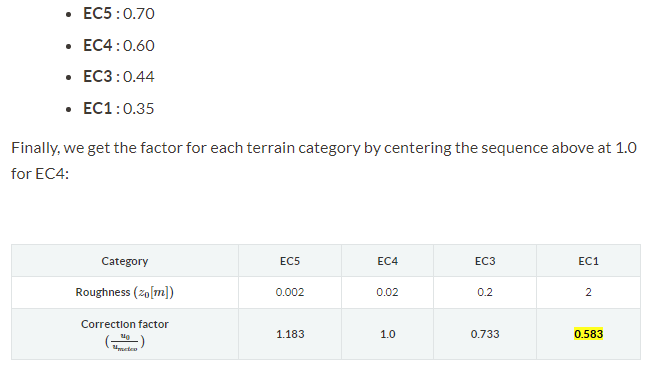
for the building height of 10m, however it looks like your documented value 0.7 should be 0.71?
Also the earlier equation in your documentation (I think) should be corrected below,
by deleting the bits highlighted in yellow.
You’re absolutely right, it should be 0.71 and not 0.7. Thank you for pointing that out, I corrected it and it will be updated on the website by end of the day.
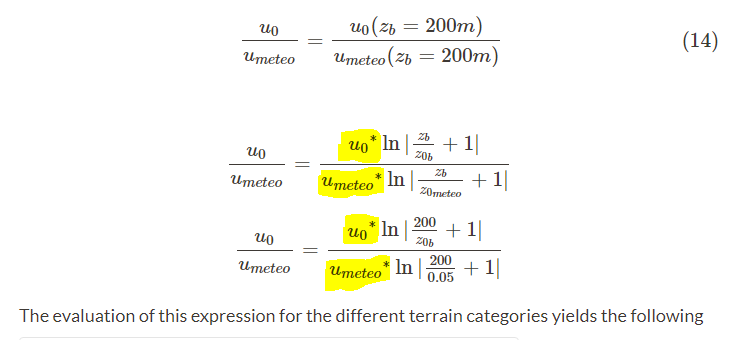
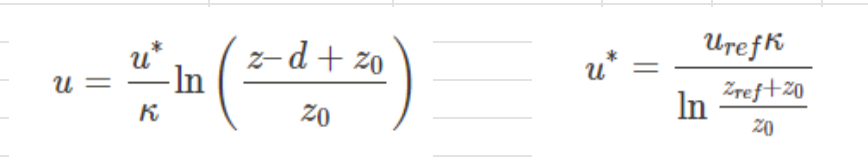
Regarding the formula, it is correct the way it is, and also your methodology too. The only difference is that you simplified the equation. For example, u_0 represents the velocity distribution at the site of interest - how can we find it? Well, using the velocity profile formulation associated with that wind standard, hence why it was written in its raw form here for the purpose of being clear.
I am sharing here an excel sheet in which i implemented the formula above to get the correction factors for the Eurocode. It provides the same results as reported in the documentation and also the same results as your method.
I hope this clears the doubt!
Best regards,
Khairi
I still think the equation is wrong and the yellow part needs deleting… otherwise it doesn’t make sense (to me). What you have put in that equation is the equivalent of saying a/b = (ax)/(by)
In reality, the ratio of the velocities (u_0/u_meteo) equals the ratio of the ln() terms. So doing it your way, if the velocity fraction is on the rhs aswell, then the ratio of the ln() terms must be =1? That cannot be right. Or maybe I am missing something obvious?
Hi Giles,
I appreciate your concern and willingness to be sure. This also helps us in improving the quality of our documentation.
To make sure we are on the same page, the * in the right-hand side of the equation you highlighted above does not refer to multiplication, but rather it refers to the actual velocity term u* (u star, aka. friction velocity).
If that is clear, then there is a small detail that would result in the ratios not being equal to 1. The logarithmic term in the u* equation shown below uses the reference height and velocity. On the other hand, the logarithmic terms in the velocity profile equation use the actual height as an input and not the reference height. This means that the terms won’t cancel each other.
I encourage you to take a look at the excel sheet I shared above, as that could clear any doubt that you may have. In that excel sheet, I basically implemented this equation as it is to get the Eurocode correction factors.
Let me know if you think this is still confusing or if you think I did it wrong (possible). I feel though, we are getting closer to common ground!
Ah OK - thanks for the clarification.
I admit that I thought it was a multiply symbol.
If it’s the friction velocity that makes sense.
Thanks, and sorry for the confusion
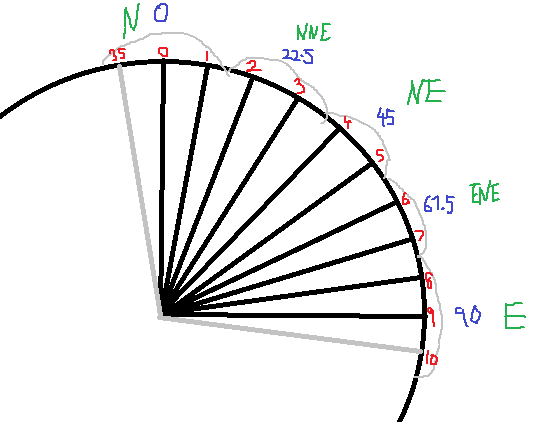
I think I have figured this out now - I was bit confused about how you get from the EPW file wind data (10 degree segments) to the N, NNE, NE, ENE, E etc data (22.5 degree segments). But then I realised that its just adding up the neighbouring segments, which kind of makes sense now…