I have been looking into your epw_to_stat method so that I can code it myself. I have been looking at the ladybug data for new york central park, and (using my python code) I can generate data from the EPW file which is in good agreement with the STAT file for this location.
BUT if I use the Simscale method for epw_to_stat, it seems to give different values for the wind frequencies at given directions. I have been using this setup for your python script:
I mean its probably a logical explanation but in the end it means I’m getting different Weibull parameters (using my method compared with yours). So it would be interesting to know why the 2 methods are different. Could you use your method epw_to_stat, on this testcase to get good agreement between the calculated values (annual.stat), and the reference STAT file?
PS. for this testcase/location the dominant wind direction is 180deg (southerly), and the highest wind frequency for that direction, is 5.7% (for the wind speed range 4-6m/sec). So I have been using that as a reference point. Your method seems to give a peak value of 4.7% for the same wind direction/speed, so there is significant difference.
So just to clarify, there is no ‘SimScale method’, since it’s not supported by the product. The code here is my code that helps me automate my workflows, just to make sure readers are aware of that
It’s great that you are comparing this to ladybug techniques. I am not so familiar with the ladybug code for the same thing so maybe you could summarise it? Let me summarise mine:
Take EPW file and read the time stamp, speed and direction
with a given set of centre directions and intervals, bin the data into directions (for example, north 0 degrees, for 8 uniform wind directions, is actually 315 - 45 degrees)
for each of those now directionally binned data sets, fit the Weibull distribution and store the values
based on the size of each of these bins, create a directional probability Pdir
Using the cumulative Weibull distribution, calculate the probability of occurrence for each direction and the given speed bins. Store it as a standard table
I suppose it’s worth mentioning at this point that I remove 0m/s entries as they cause errors in the Weibull calculation. However, I do not add anything back to probabilities. Is this similar?
Hi Darren, thanks very much again your thorough reply - thats very useful.
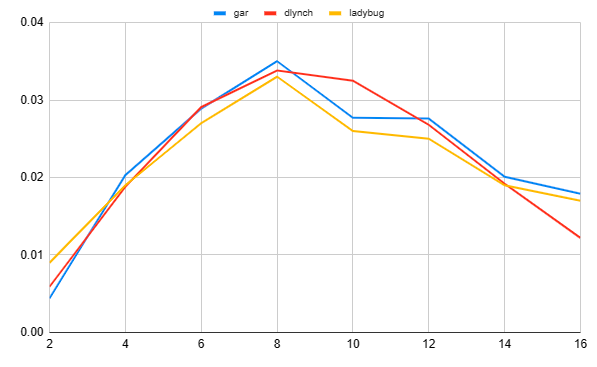
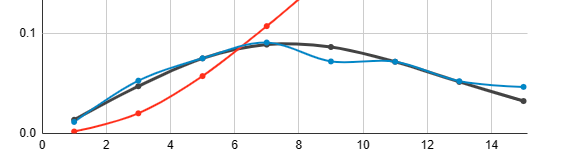
I was able to get an exact match with your directional probability numbers, but (for me) the speed bin probabilities did not match your values - but your explanation explains that for me. I did not realise that you are printing the probability stats after the weibull curve fit. So this means your data is a kind of sanitised version of the actual wind frequency data. I just created this plot for the GBR Hartland Point data at 270 deg, and compared my data (gar) with yours (dlynch) with the ladybug data. And yes - I also had to remove/ignore the zero wind speed values.