@jousefm
Can you please have a look at the error.
Thank you
@jousefm
Can you please have a look at the error.
Thank you
@jousefm
I setup the simulation as mentioned but after about 20 minutes i got an error saying continuity error occured. i have tried to fix it but i am still unable to proceed with simulation. Here is a link to the project : https://www.simscale.com/workbench?publiclink=e8783b92-57a7-44bc-aaab-dc27924b1aba
Really need some help as the deadline for submission is really close.
Best
Nishank
i am having same problem …!!!![]()
Hi @nishank_a!
You assigned the outlet face to the symmetry BC. Please choose the correct face and re-run your simulation. Should work! 
Cheers!
Jousef
Rookie mistake 
Thanks for the help.
Hi, my simulation run will run over the deadline. will it be ok to submit the homework and finish post processing the vehicle after the deadline? I don’t really have much choice haha. P.S i have been really impressed with the workshops so far!
I’ll submit what i have before the deadline
Hi @hamza02!
You have some wrong definitions in the Mesh. The Inflate Boundary Layer Refinement is missing some faces and the bounding box layer addition is applied in the wrong direction.
Cheers,
Jousef
Hi @jkendrick!
What exactly is the problem you are facing? Also some numerical instabilities or is it something else I can help you with?
Cheers!
Jousef
hi @jousefm , It’s just taking a while to compute and was wondering if they will be ok if i submit it whilst it is finishing the simulation run? Cheers for your reply
Hey @jkendrick!
I mean if it is some minutes after the deadline…should be no problem imo.
Cheers!
Jousef
Dear Simscale Team,
Thank you for putting on the workshop and being so helpful in the comments. I have a small question about your Result Analysis Highlights photos, specifically the Total Pressure/Coefficient of Pressure (Cp) plot.
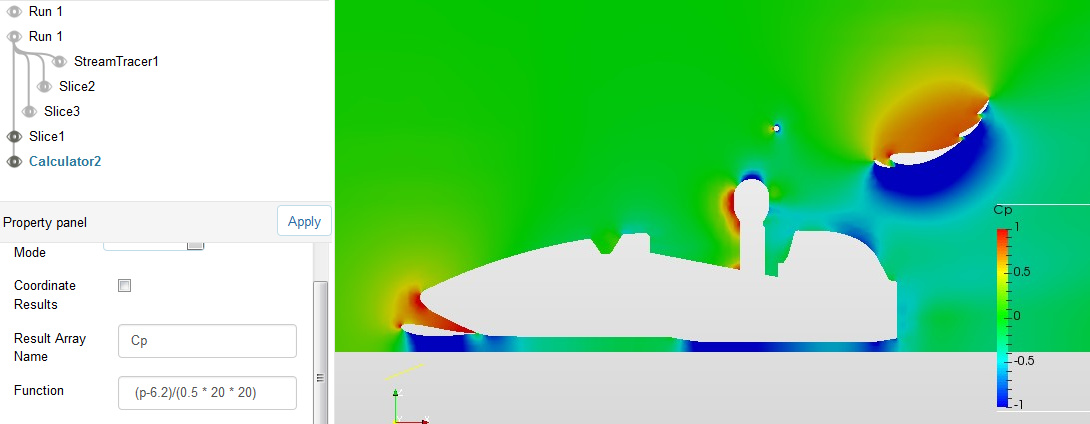
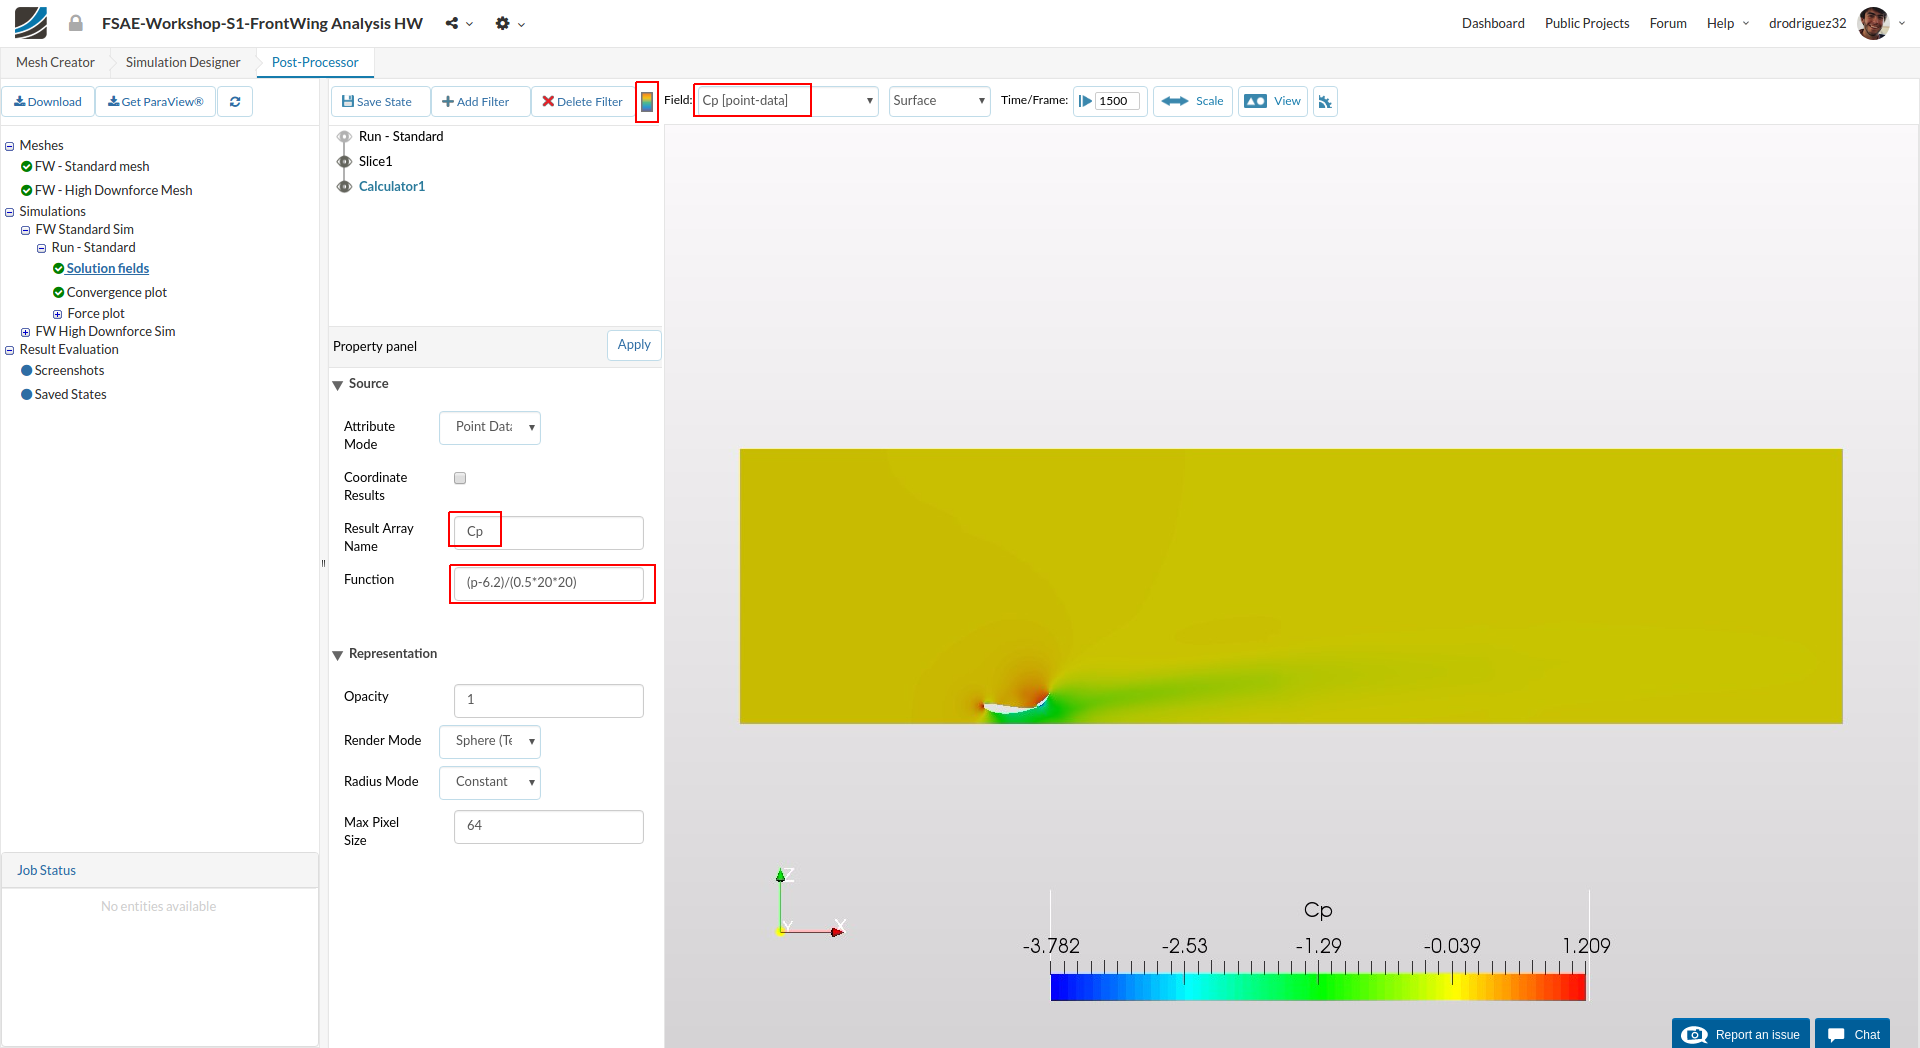
I tried to make a calculator as per the first tutorial using the equation (p-6.2)/(0.5 * 20 * 20), however this did not produce a plot similar to the highlights photo, even when the scale was changed to -1 to 1 (see below). The plot more closely resembles a normalised pressure plot than a representation of air “energy” (as this is what I understand Cp to be, please tell me if this is incorrect).
Many Thanks,
ldm
Hi @kshitij!
I saw that some definitions like material etc. are not the same as in the tutorial. Maybe you start having a look at the mesh again and counter-check everything else afterwards.
Cheers and good luck!
Jousef
Hi @ldm_simscale!
The pressure coefficient has no dimension thus is no energy (can be seen by just looking at the units). It is usually less than 1 and in general bigger than -3 (don’t know a case where it can be below -3 at the moment  ). Would have to see if I we missed some quantity here. By the way: Can you tell me which picture you are referring to?
Edit: Does that picture from you not exactly tell what we would expect? Cp is 1 in the stagnation point, negative in the wake and zero when parallel to the body. Maybe @drodriguez32 has a good idea on that one.
Cheers and thanks a lot for your feedback!
Jousef
Hey @jousefm , @drodriguez32
Thanks for the quick reply! After some research I think I have found the source of my error, but would welcome your confirmation/knowledge of this subject.
From your previous tutorial I had completed this step OK and produced the plot seen in the image
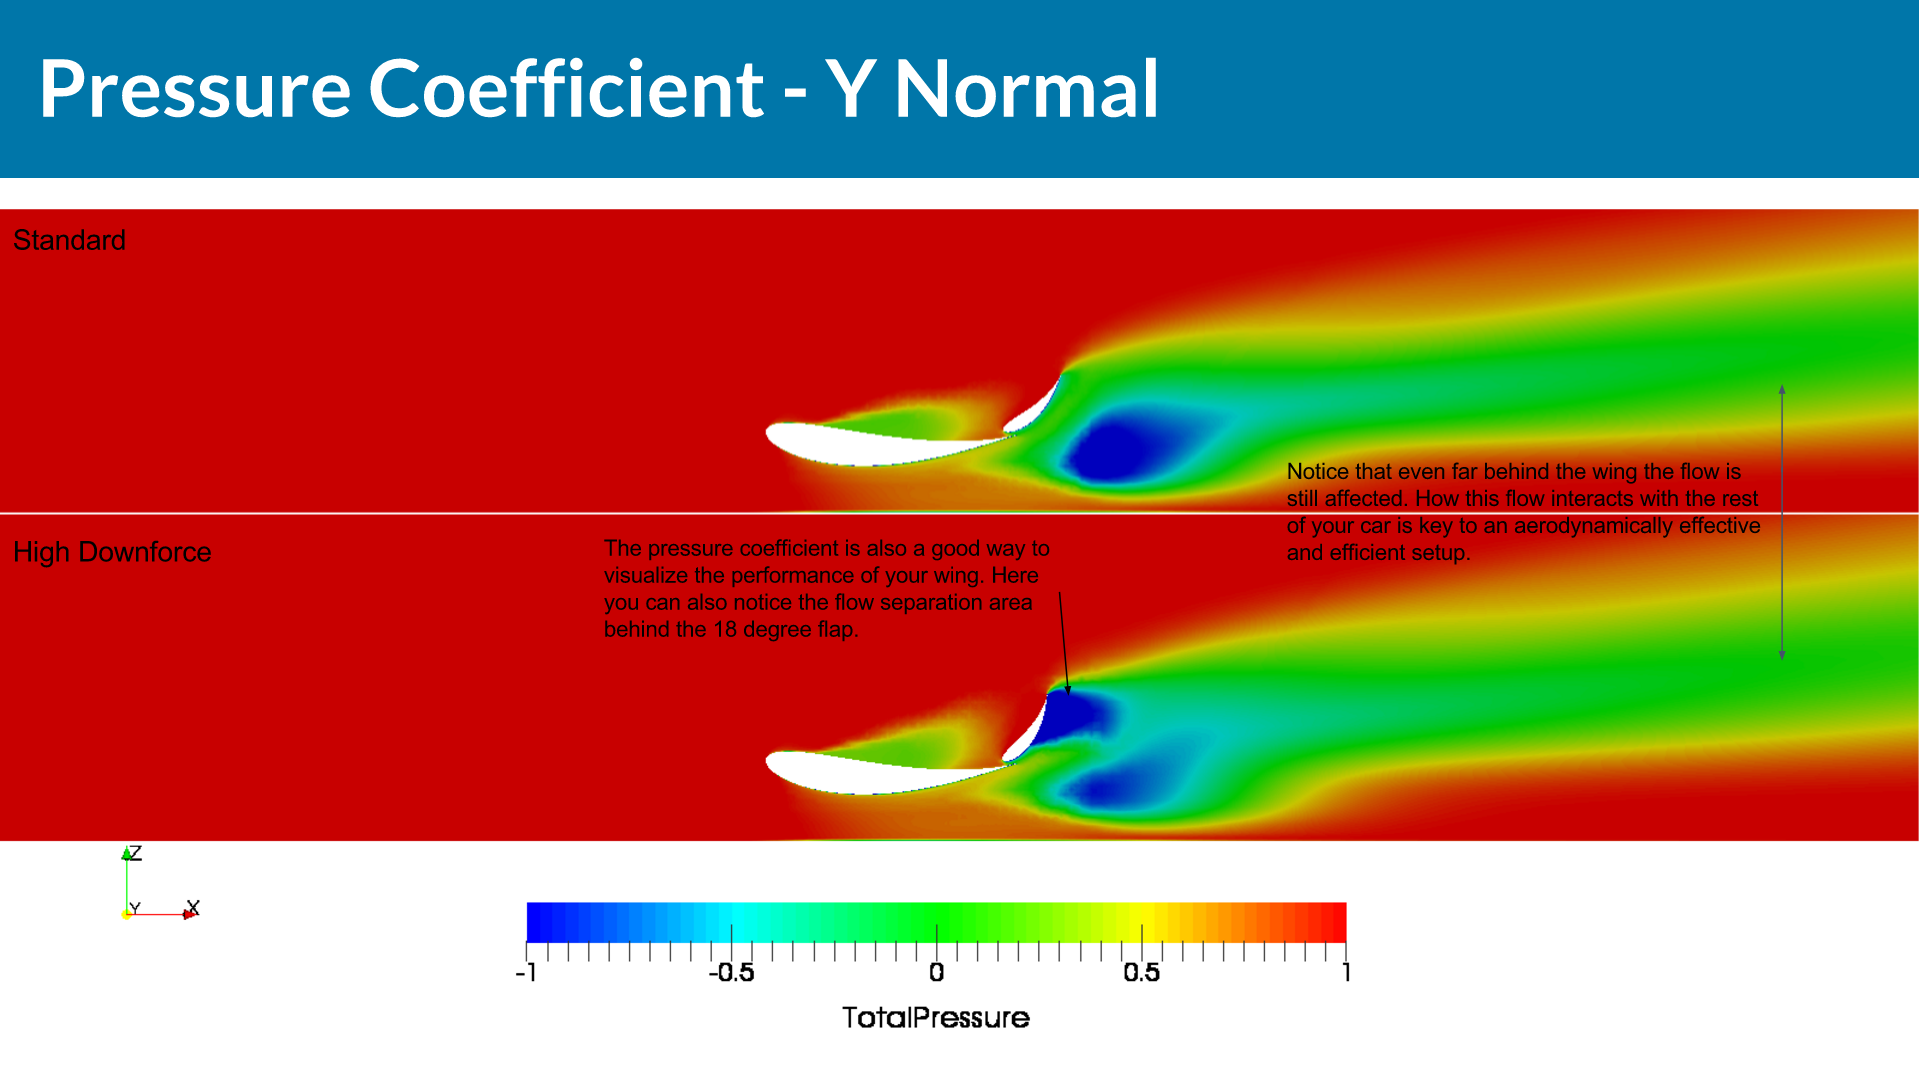
However when it came to the “Highlights” plot below it you showed this image:
I was not able to replicate this particular plot but unfortunately did not have time to investigate it. I noticed that the plot is identified as Total Pressure (the sum of static and dynamic pressure?) and I assumed this was the same as Cp at the time due to the above title (though now I see this was my mistake).
Now for the full car model I similarly used (p-6.2)/(0.5 * 20 * 20) and got the above posted image, and I could not replicate your Total Pressure plot below (in stationary form).
To summarise, I understand Cp is normalised pressure (though not fully the derivation of your supplied formula); I suppose my question is really just how to calculate total pressure in the post processor and what this represents/what is it used for? (Total Pressure is what I had understood to effectively represent “energy” as a colleague had described it to me as the “quality of the air stream”.)
Many thanks again, your answers and time truly are appreciated!
ldm
Hey @ldm_simscale,
Sorry for the confusion regarding the slides, it’s tricky because both can be seen as coefficients, but I didn’t realize the titles could be misleading. These pictures are of the Total Pressure Coefficient which is different from the Pressure Coefficient you know as Cp, and hence their derivation is different.
I’ll try to answer everything as clear as possible.
Regarding your first comment about the Cp slice not looking similar to the Highlights:
a. The pressure coefficient we know as Cp is in fact a way to normalize pressure, not visualize energy. The Cp represents the relative pressures in a flow field, so it will be close to zero in the freestream, negative when air is accelerating under a wing or the car, and positive near the stagnation points.
b. The location of the slice you posted is not the same as the one used in Highlights so inherently there will be a difference if you compare it to the Cp slice.
Regarding the formula for Cp in the first tutorial:
a. We used the standard formula that you know: , where freestream pressure near the inlet is 6.2 (that’s where the 6.2 comes from). Then, because the density is ~1.1, we decided to approximate the formula and leave it out (hence why there wasn’t a density term in the formula).
b. If you want to apply this to the results for the second session you have to check what is the freestream pressure near the inlet and use that value (which probably won’t be 6.2). You can also approximate it using P_inf = 0.
c. The Pressure Coefficient slices from Highlights were calculated using P_inf = 0
Regarding the Total Pressure Coefficient
a. This is the measure of the energy in a flow field. This is a great way to see how your design impacts the flow. For example, where the Total Pressure Coefficient is -1, you will most likely be visualizing the creation of vortices.
b. The formula we are using to calculate this is: 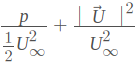 , where the U in the numerator is the magnitude of the velocity vector (which means you probably have to apply an RMS operation to the vector).
Hope all this helps!!
Cheers ![]()
Diego
Hello everyone, I am facing a problem with the simulation run. This is what I get from the Solver log:
mpirun noticed that process rank 0 with on node 366240f6dd08 exited on signal 9 (Killed).
And here is the link of my project.
Thank you in advanced.
In step Visualize the car we add the result to the viewer but what exactly we are adding by doing this step the velocity and pressure data transfer through one? how?