Link to part 1 of the tutorial:
Step-by-Step Tutorial Session 1 - Front Wing Design Study (Part 1)
Introduction
Welcome to the second part of the step-by-step tutorial for the simulation of a Formula SAE front wing. In this part of the tutorial we will show you how to do the post processing directly in SimScale, and we will dive into some of the results so that we can compare both wing setups.
Post-processing
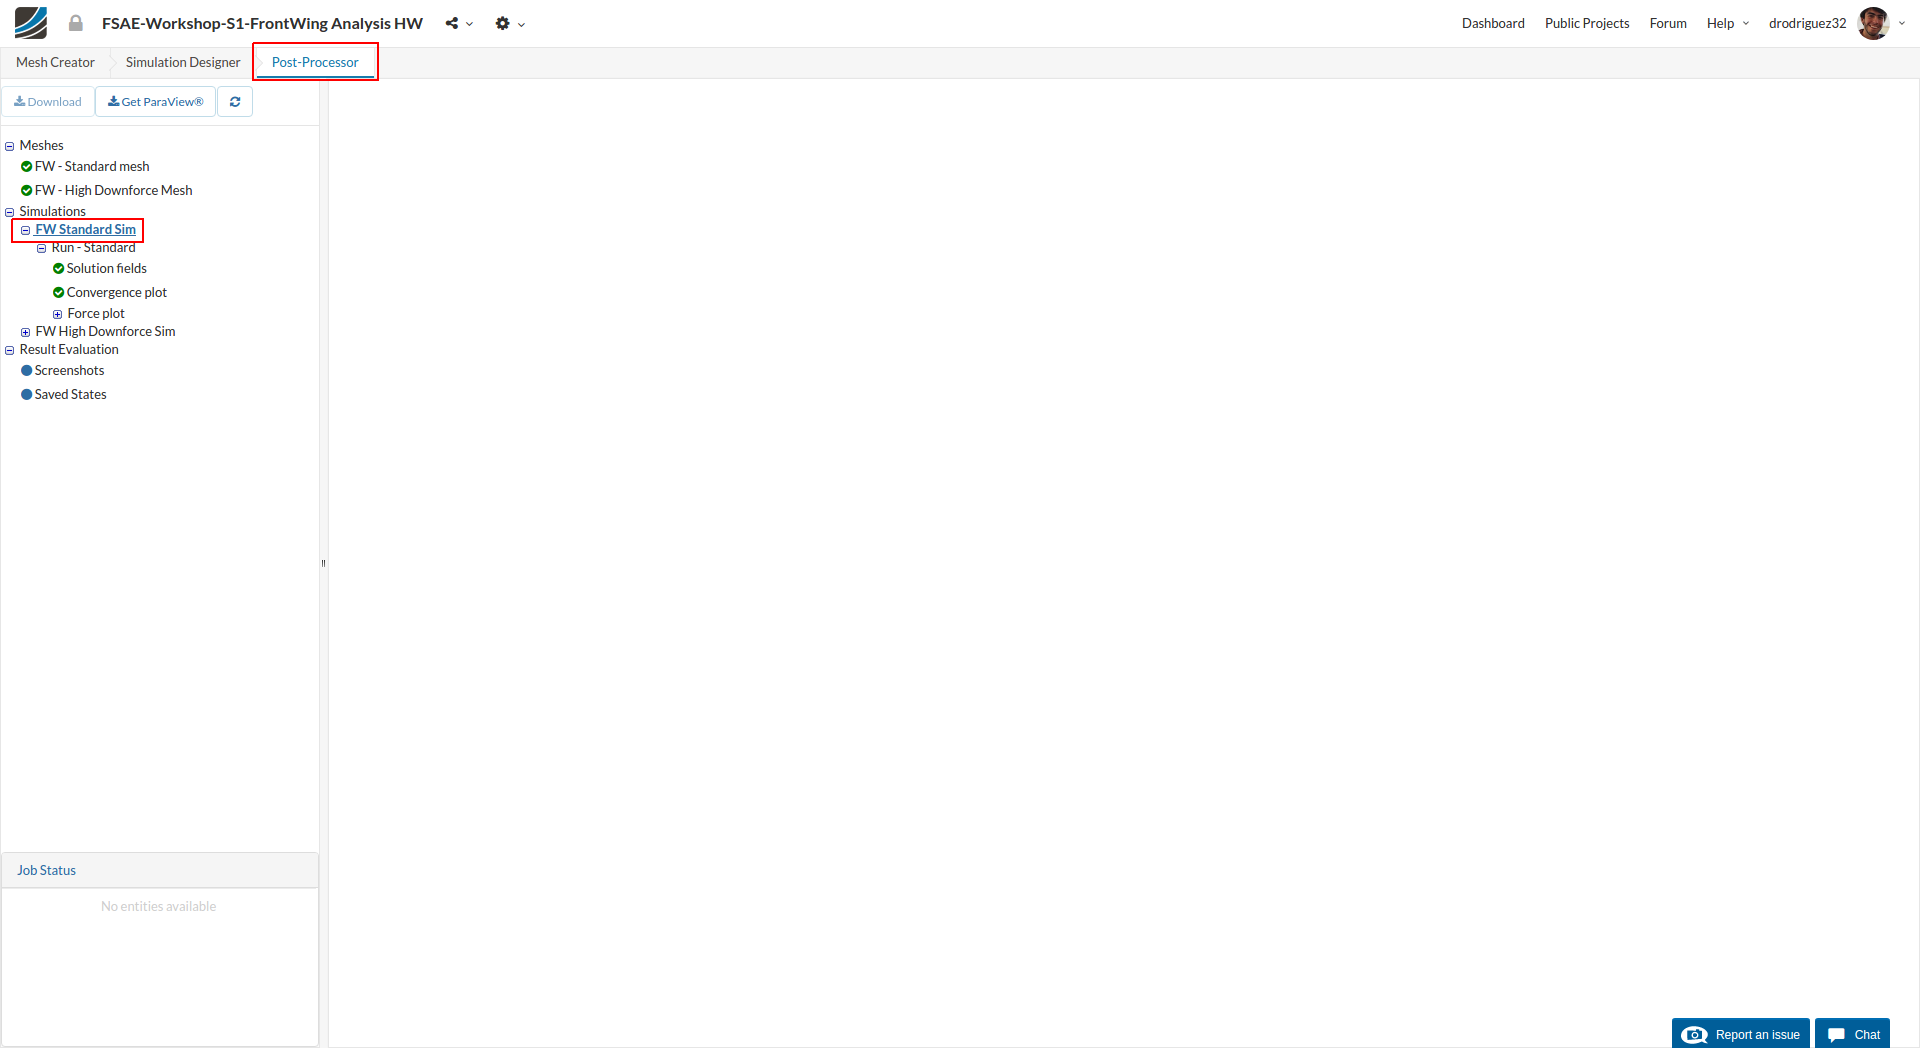
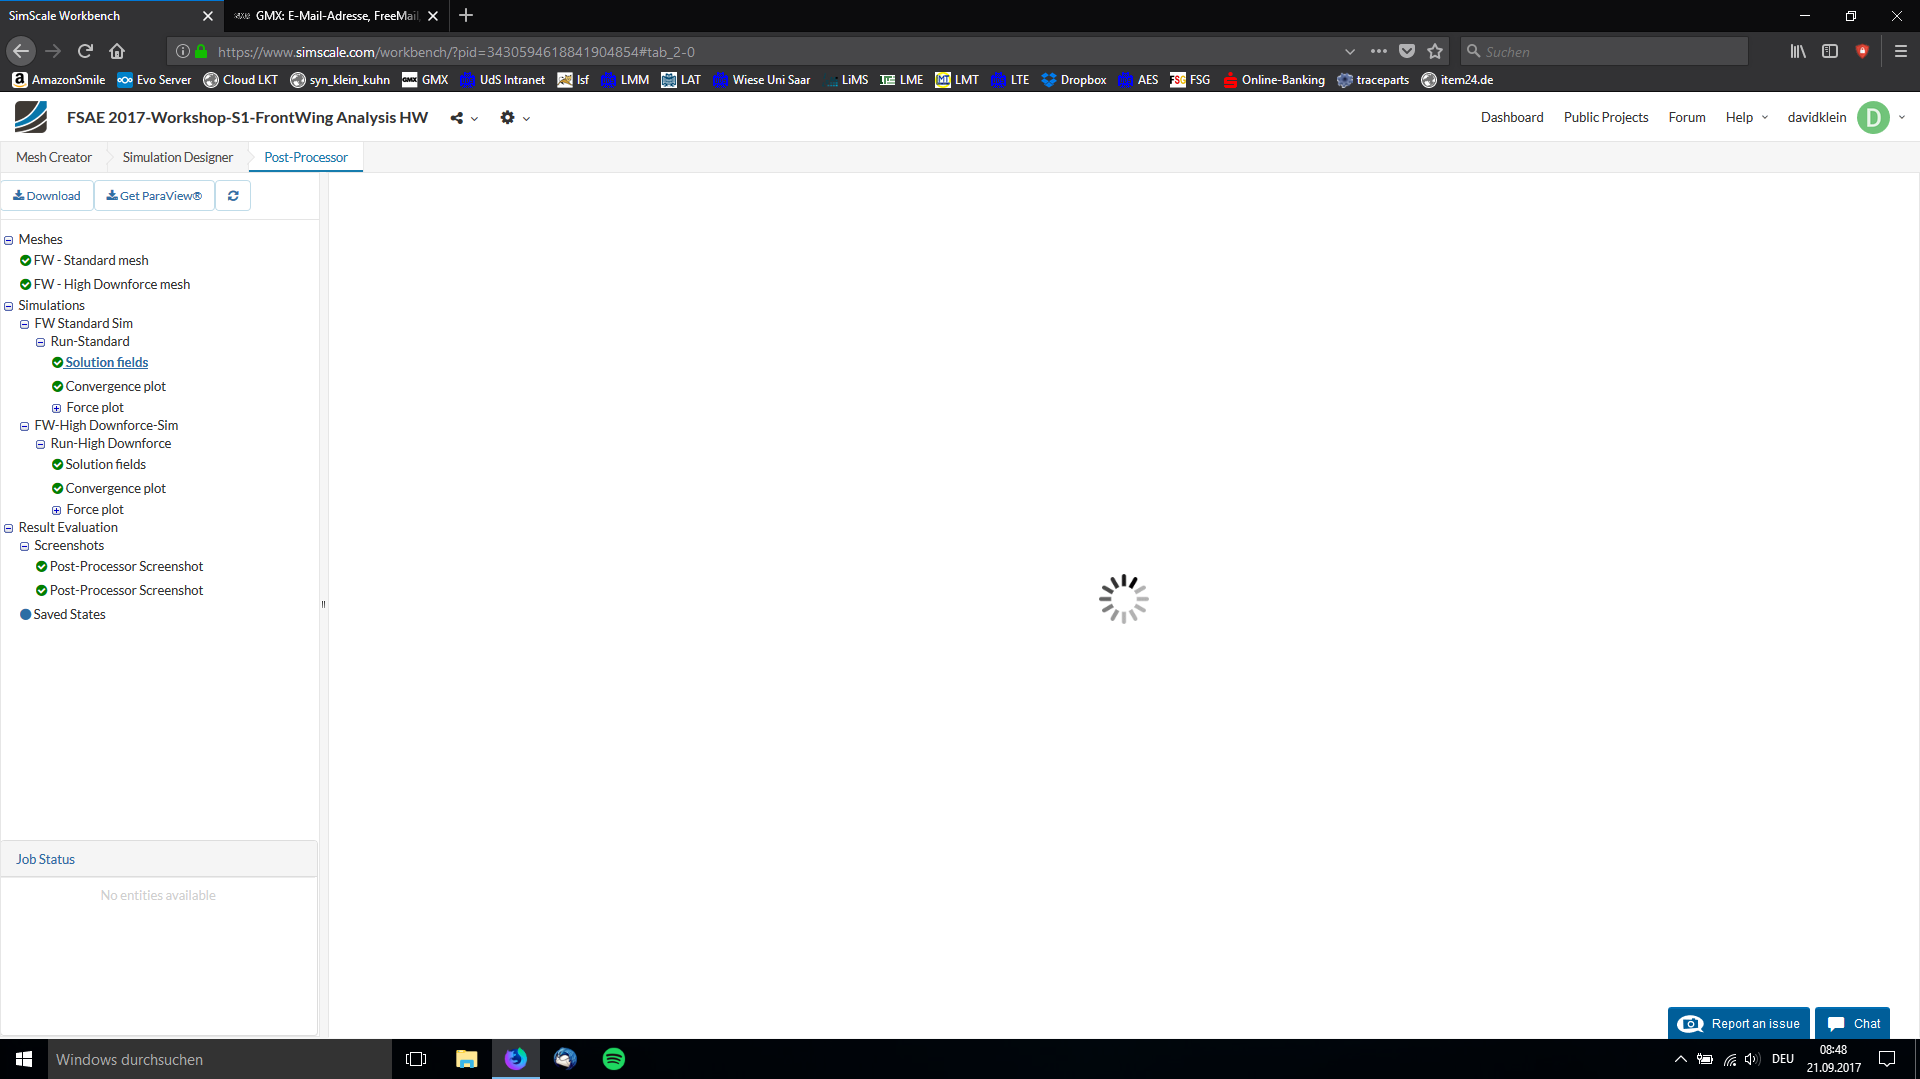
When your simulation is completed, proceed to Post-Processor tab in order to post-process your results.
We will show the post-processing only for the first simulation results. You can then follow the same steps in order to post-process other configuration results
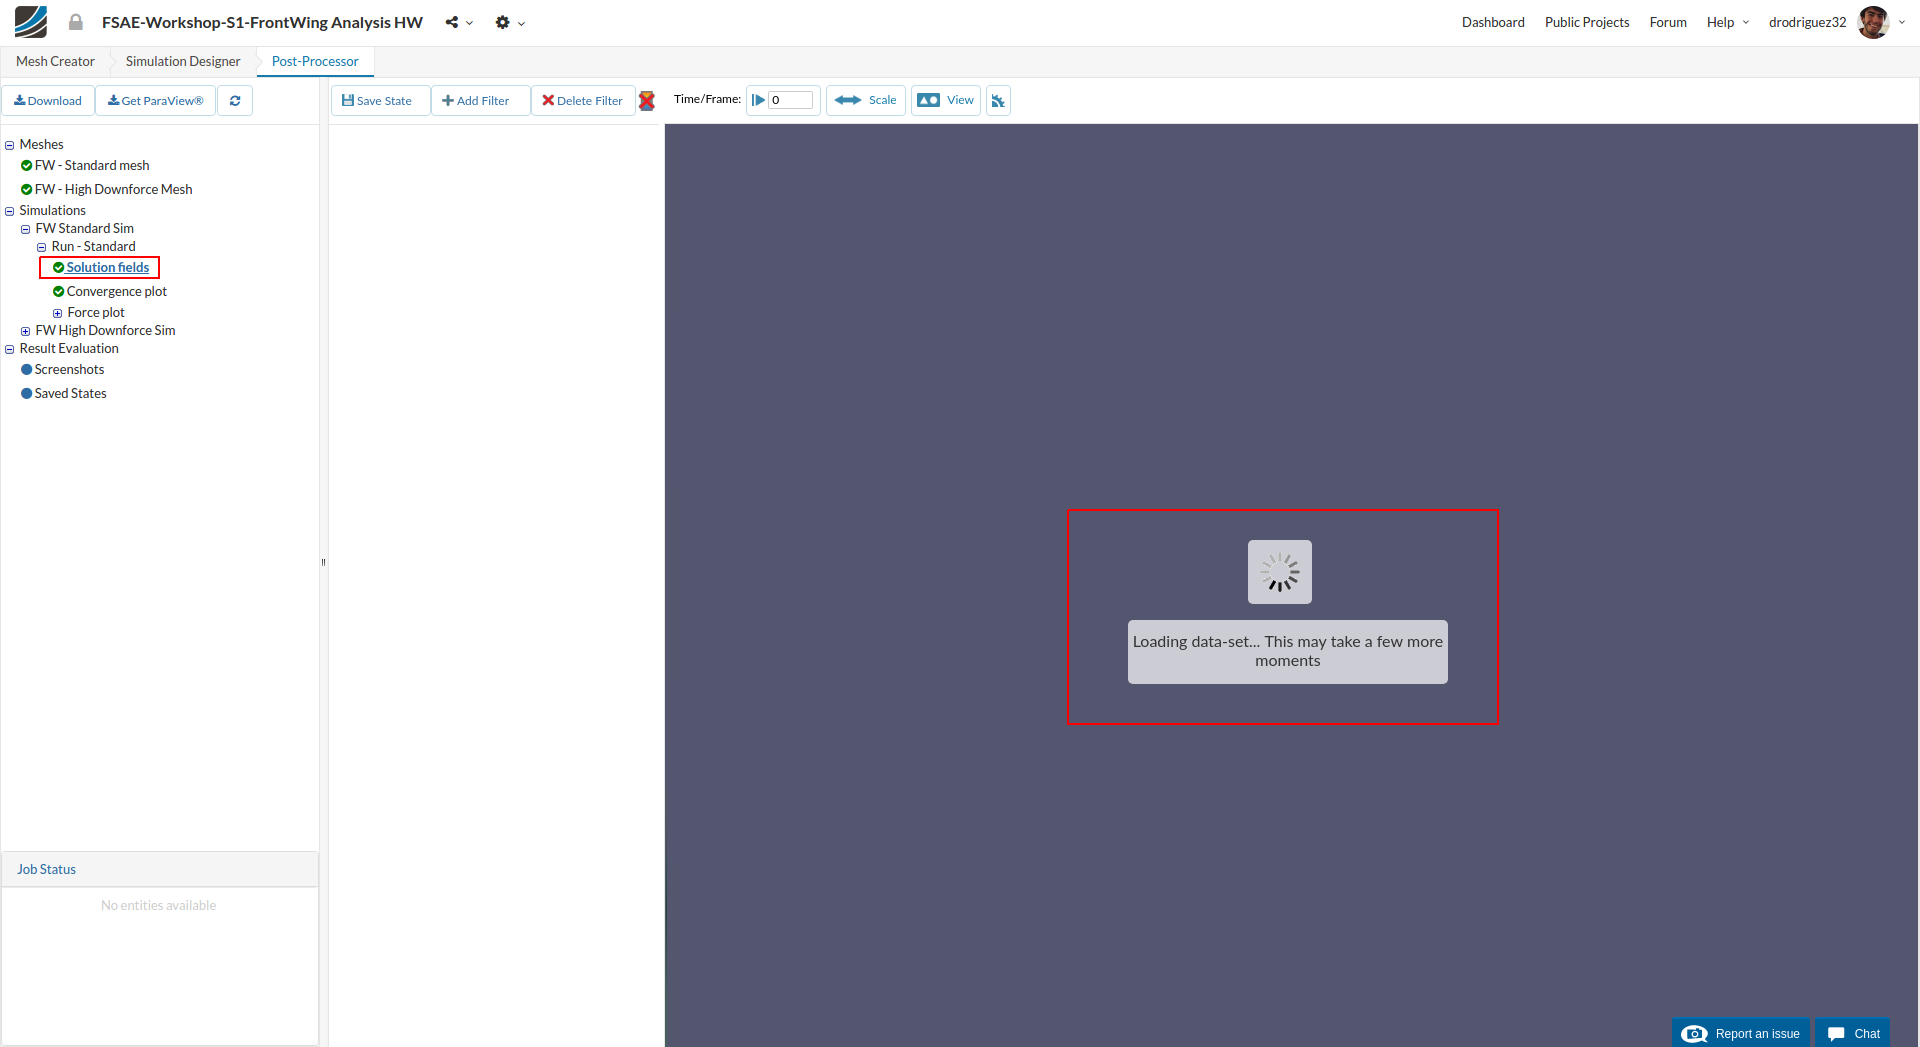
Once in Post-Processor, click on Solution fields under Run-Standard in order to load the results in the viewer. Due to fine mesh it can take up to 5 minutes to load the results in to the viewer.
Filters/Visualization
Slice
For faster and efficient reviewing of the results, we will use slice filter. In order to add the filter, do the following:
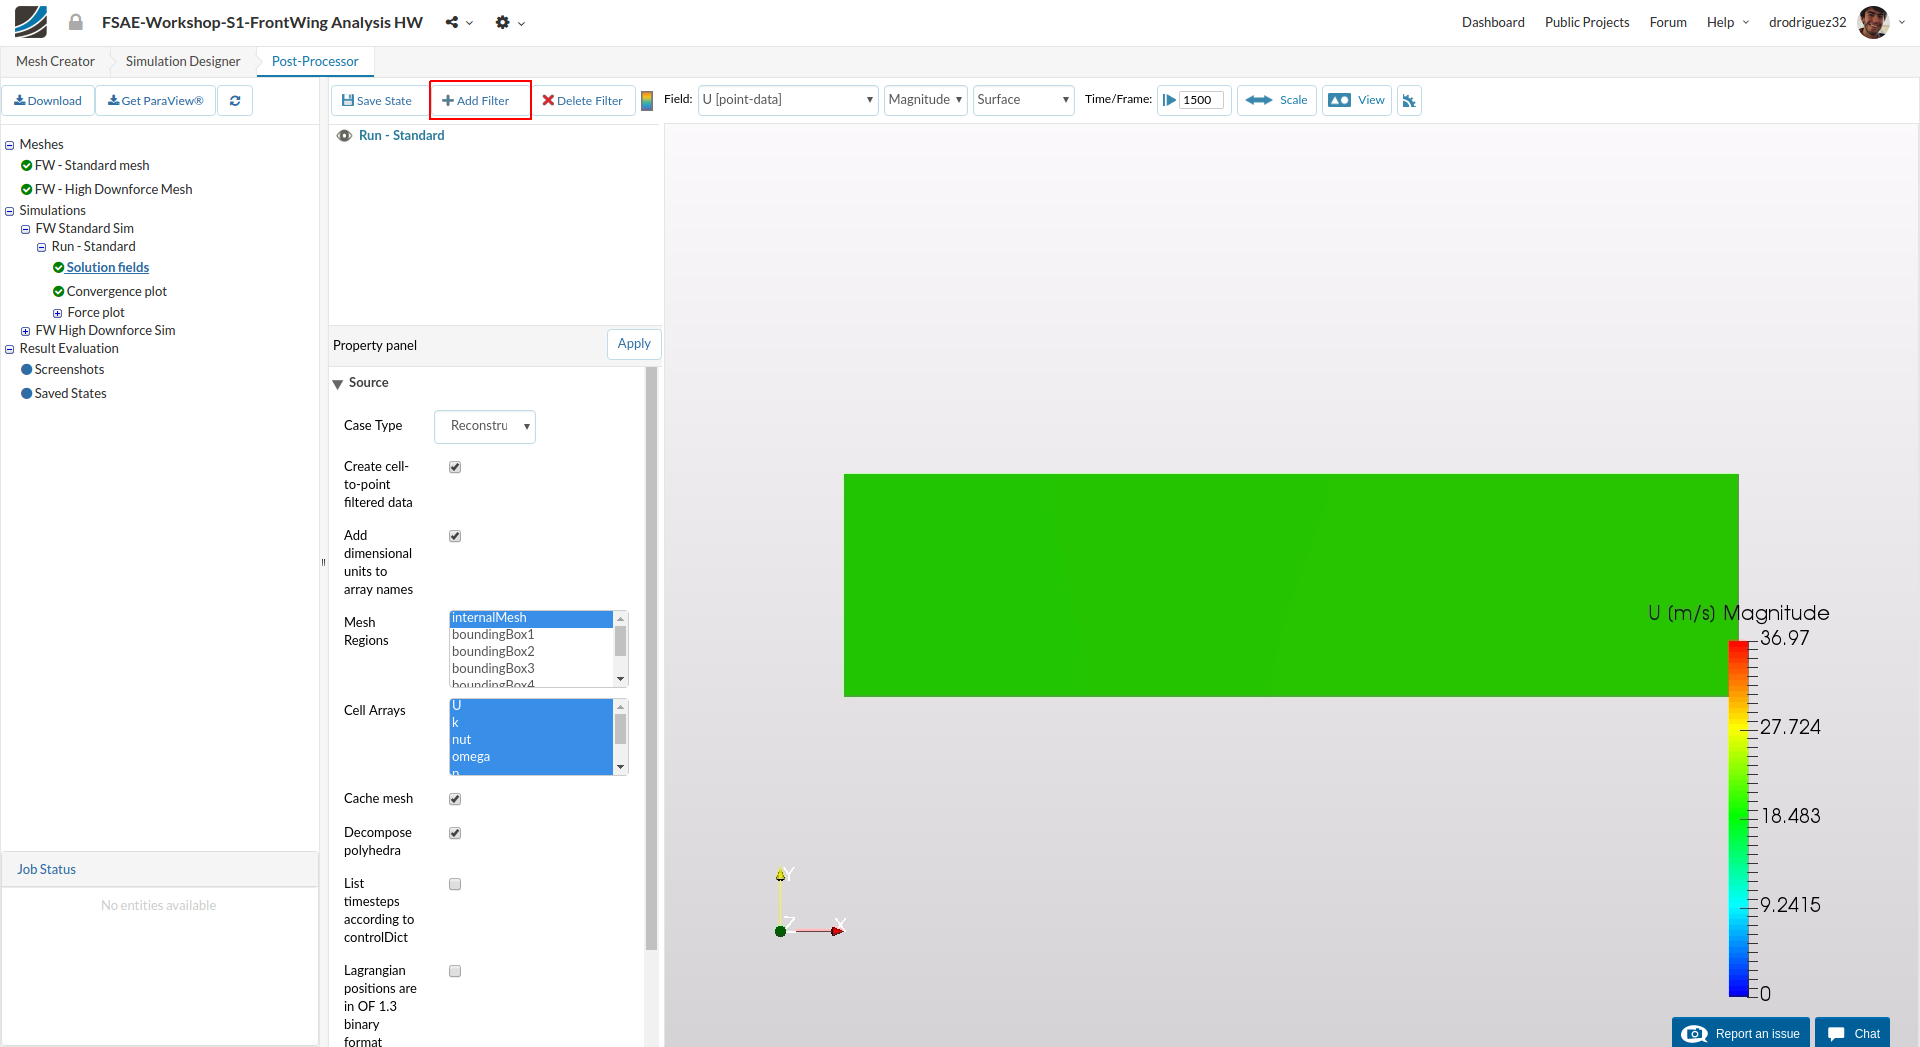
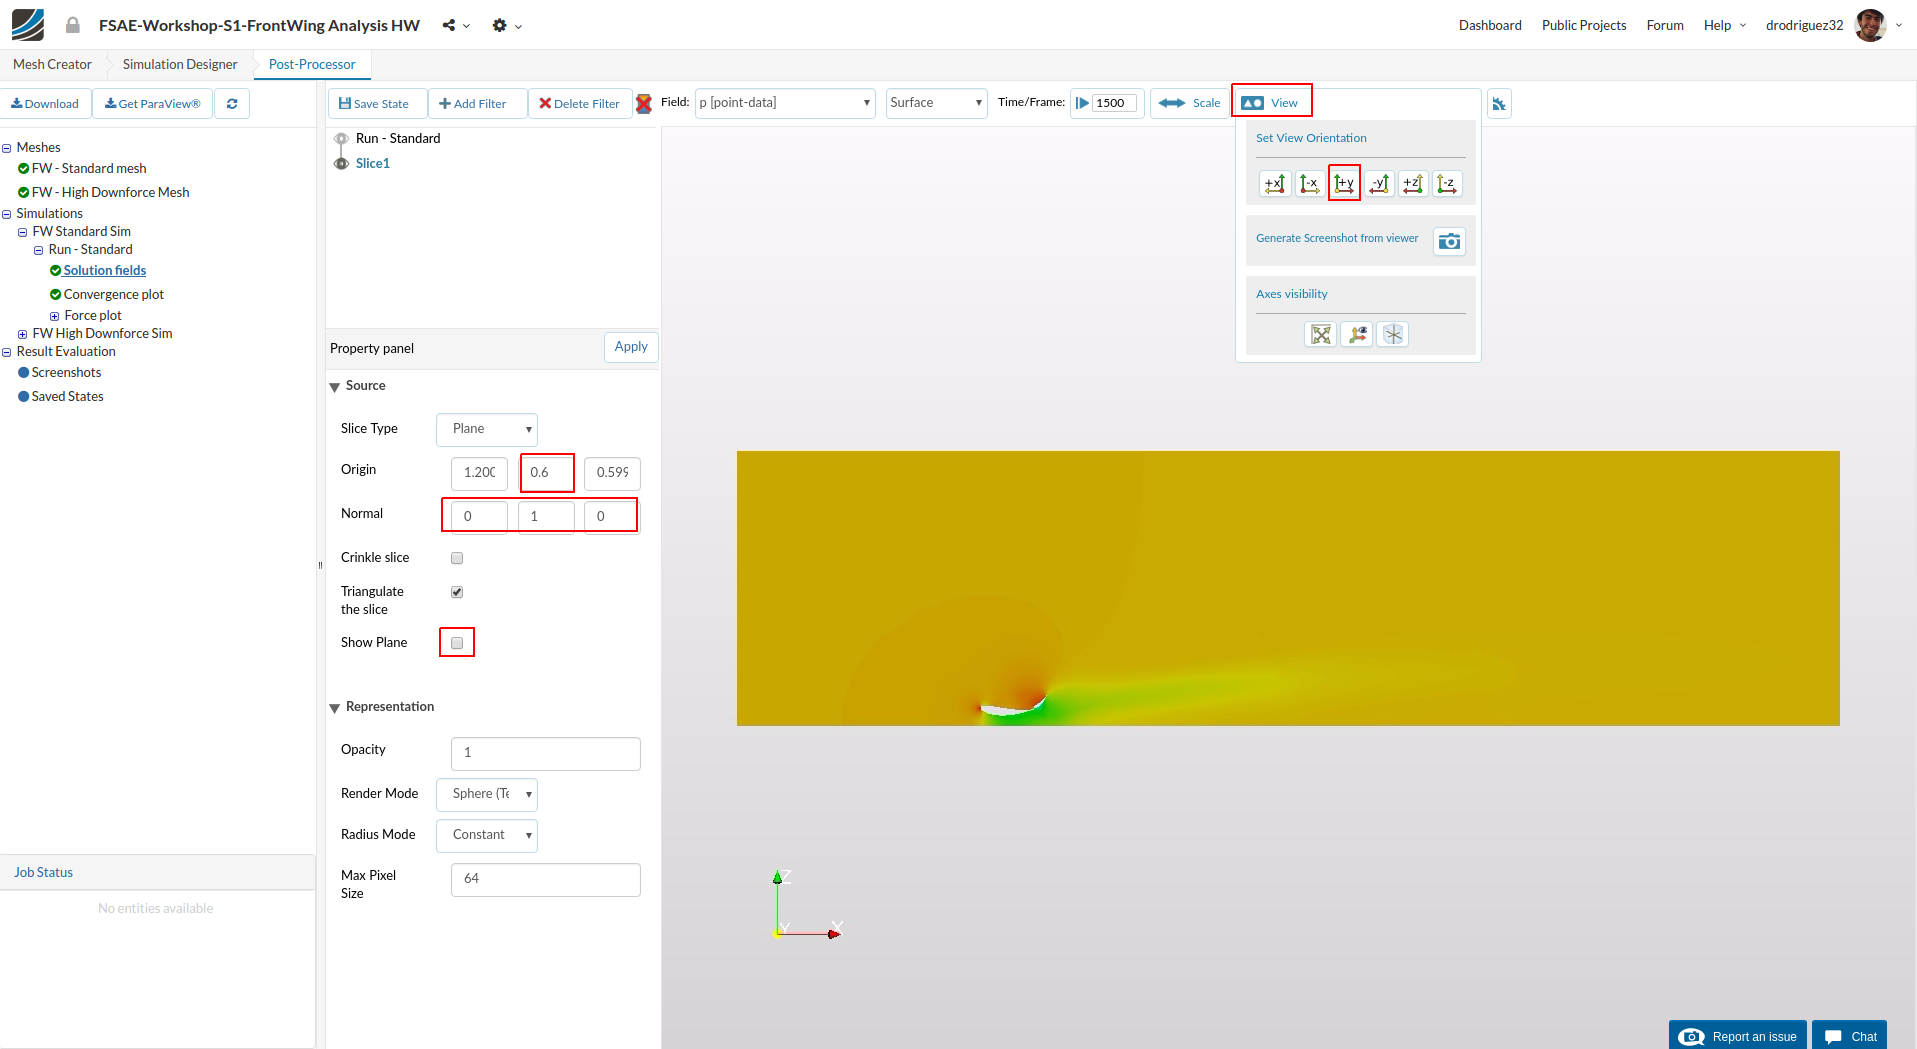
Go to Add Filter and select Slice
-
Change Origin middle value i.e. y value to 0.6
-
Change Normal to (0,1,0)
-
Uncheck Show Plane.
-
Click Apply to save the changes.
-
Next set camera orientation to +Y from the View tool over the viewer to get a proper view.
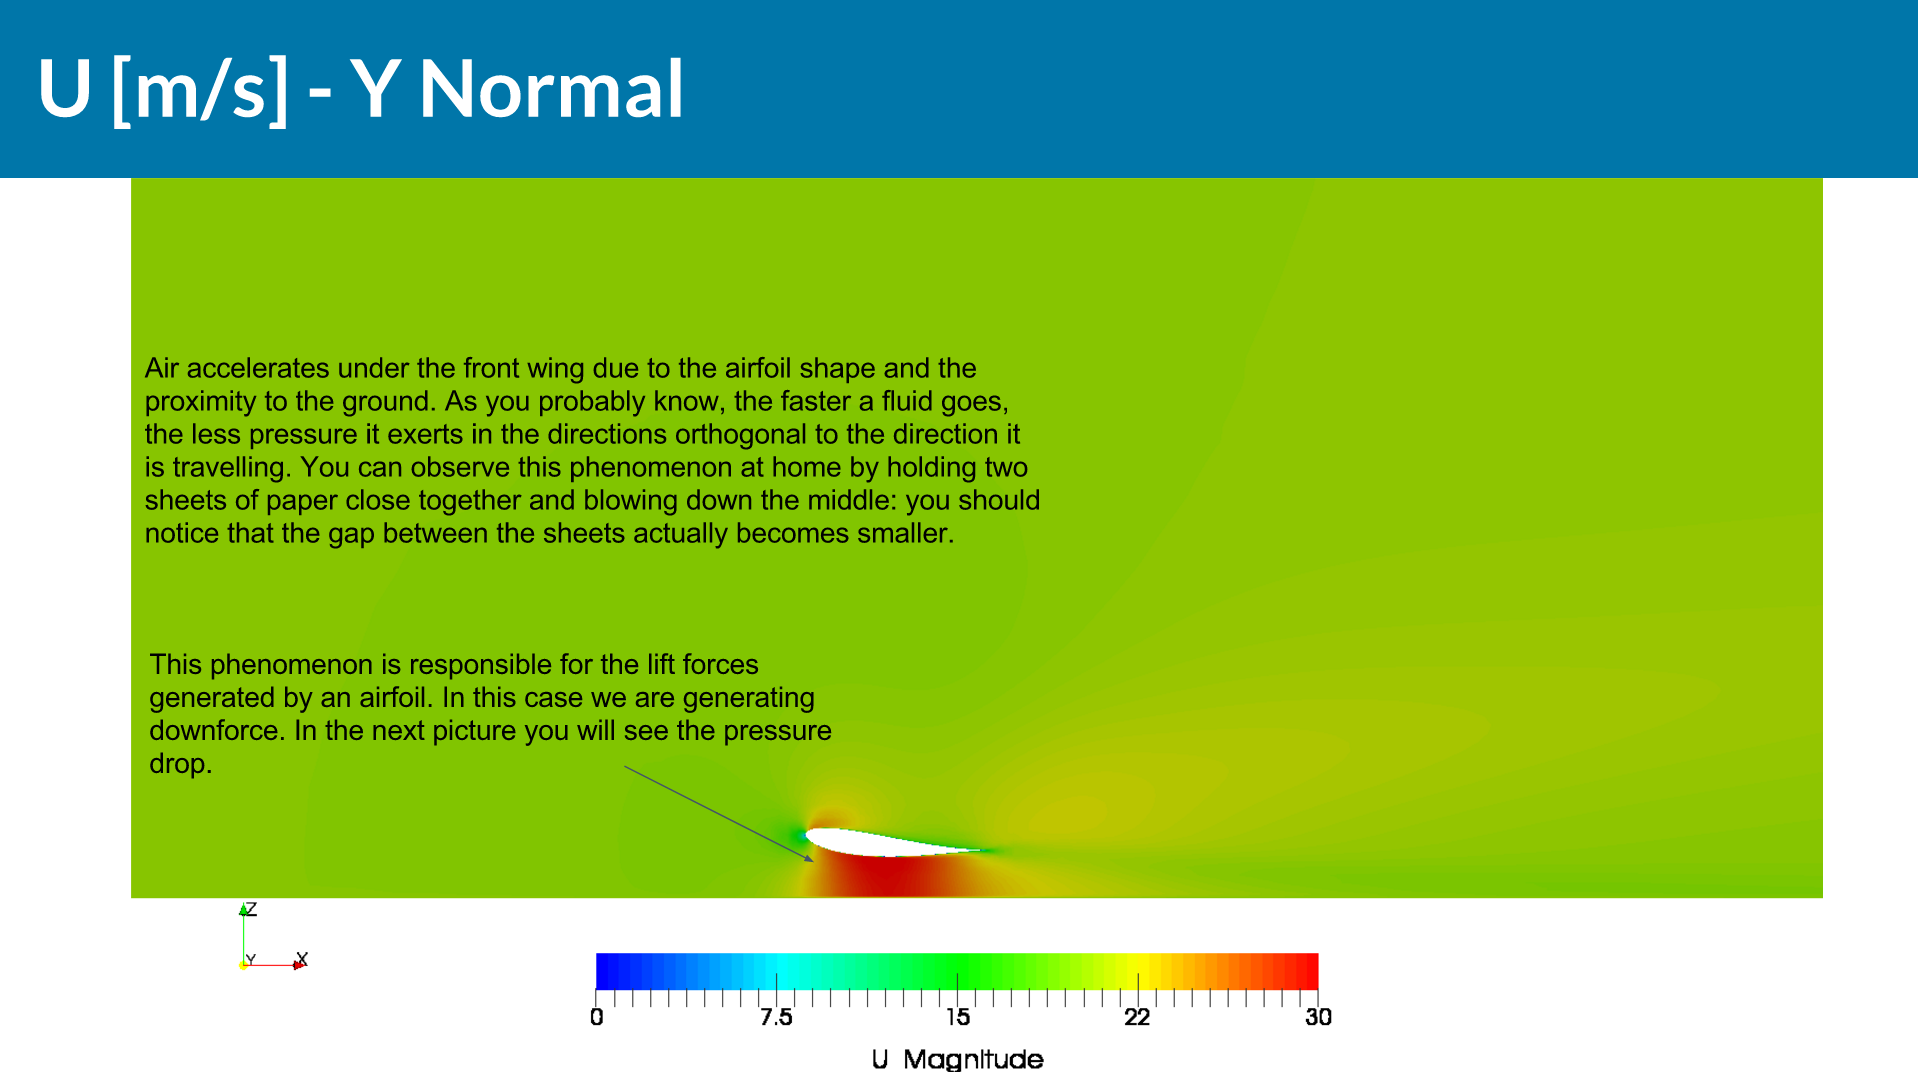
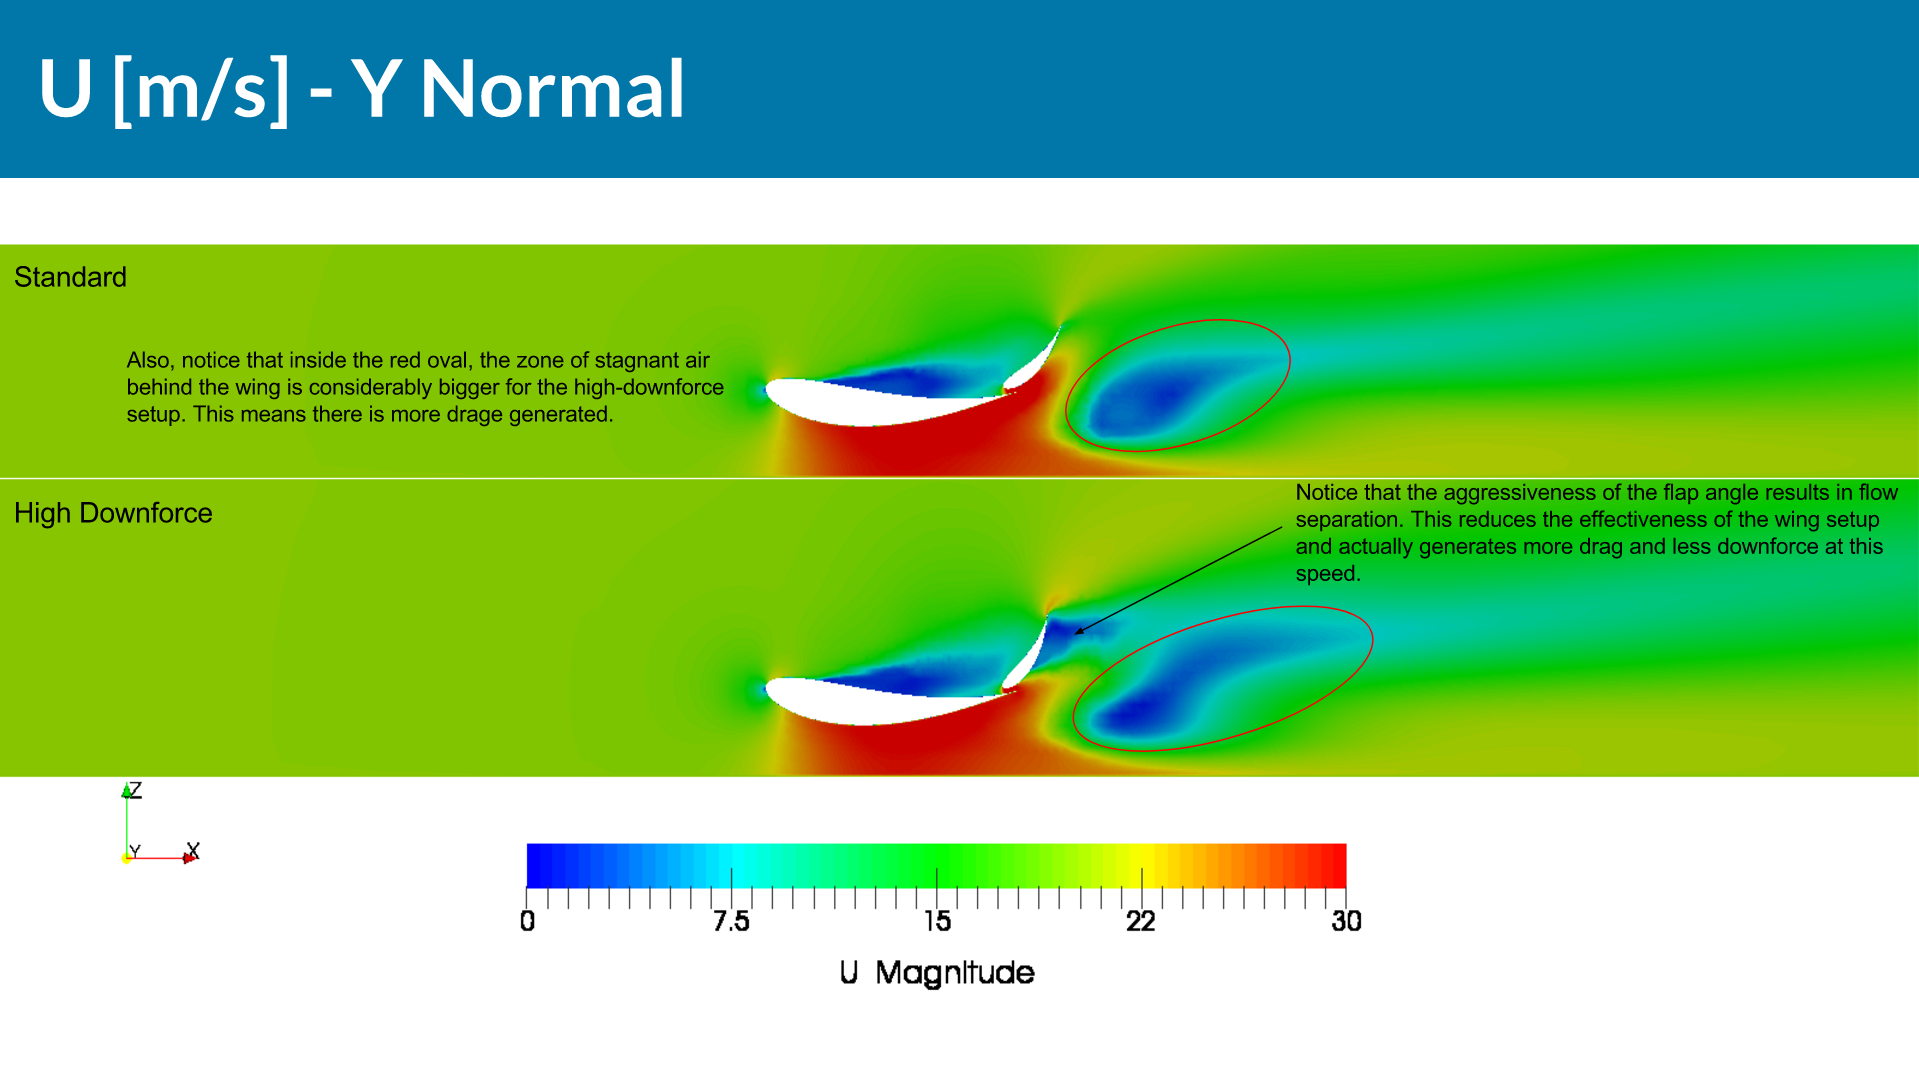
Velocity
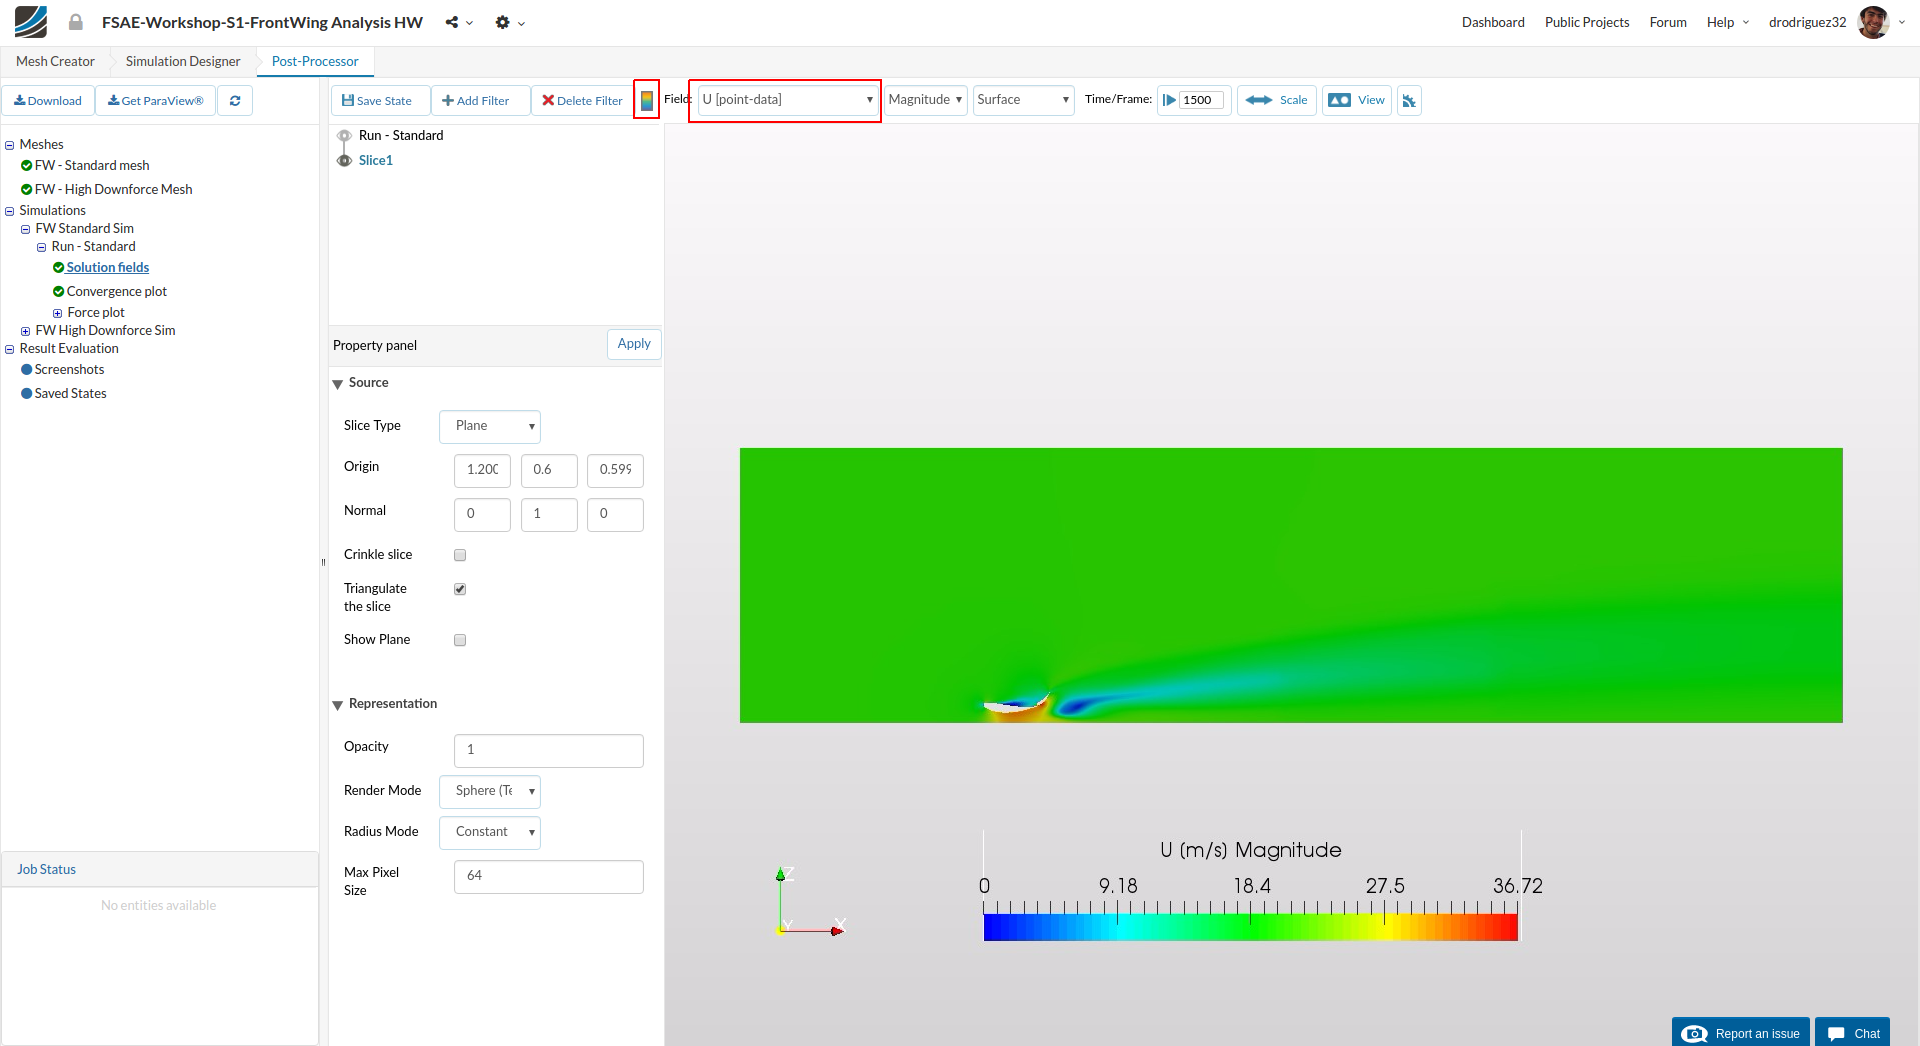
Change the Field to U [point-data] in order to see the velocity field. Zoom the results with the mouse roller and drag from middle mouse button to get a reasonable view. Turn on the color bar and drag it by holding mouse left button to the bottom.
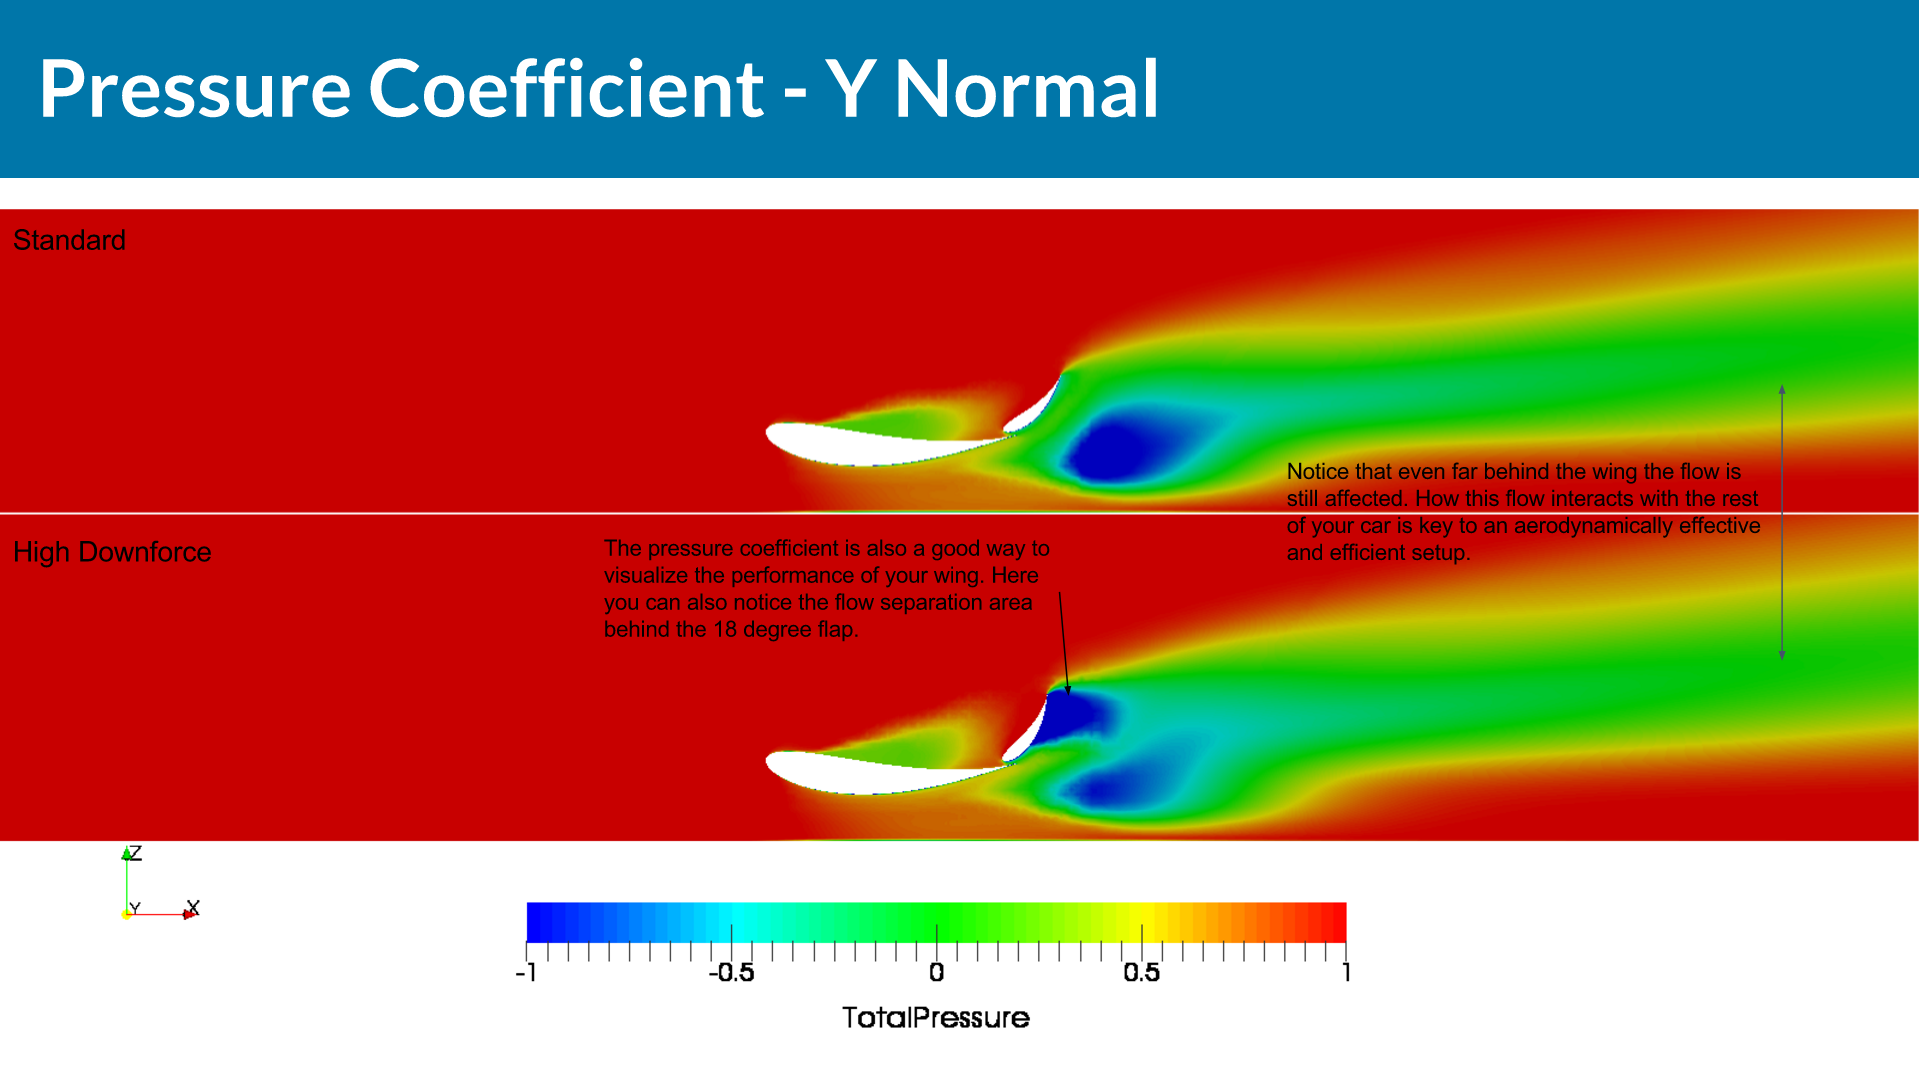
Pressure Coefficient
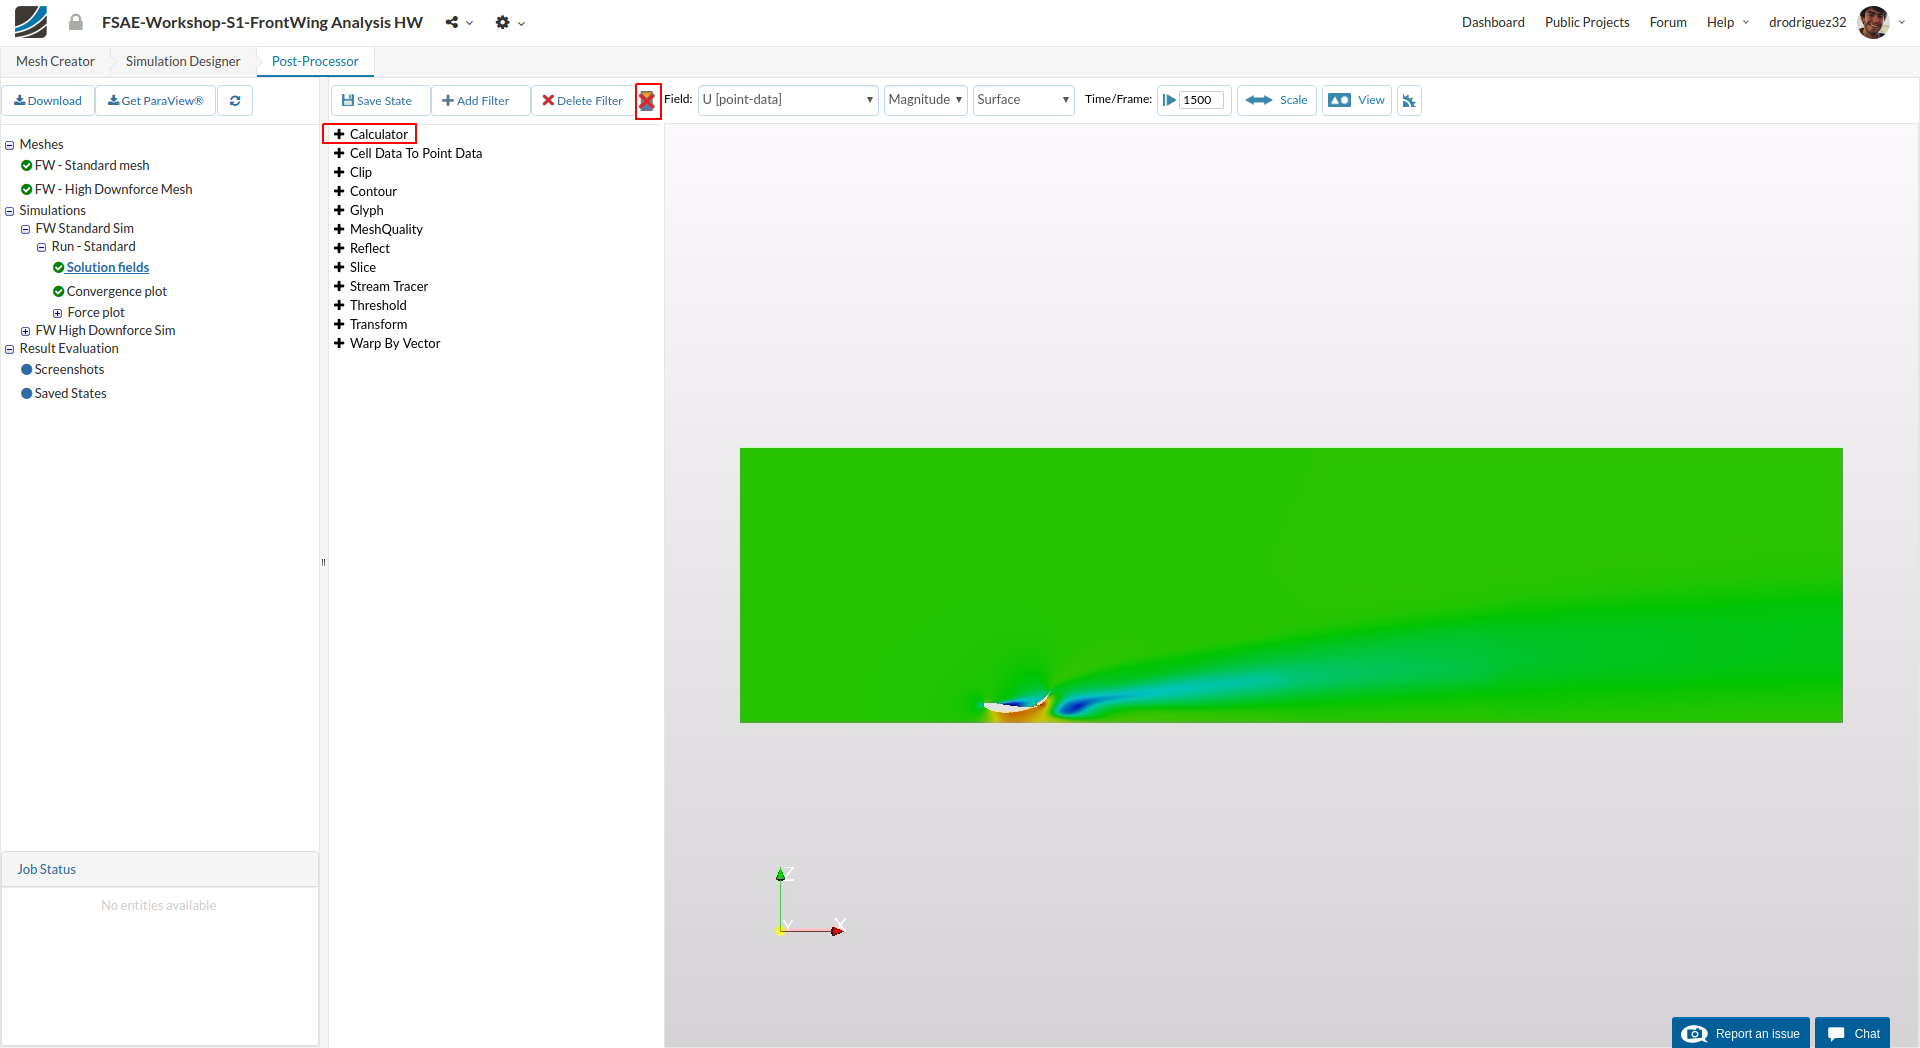
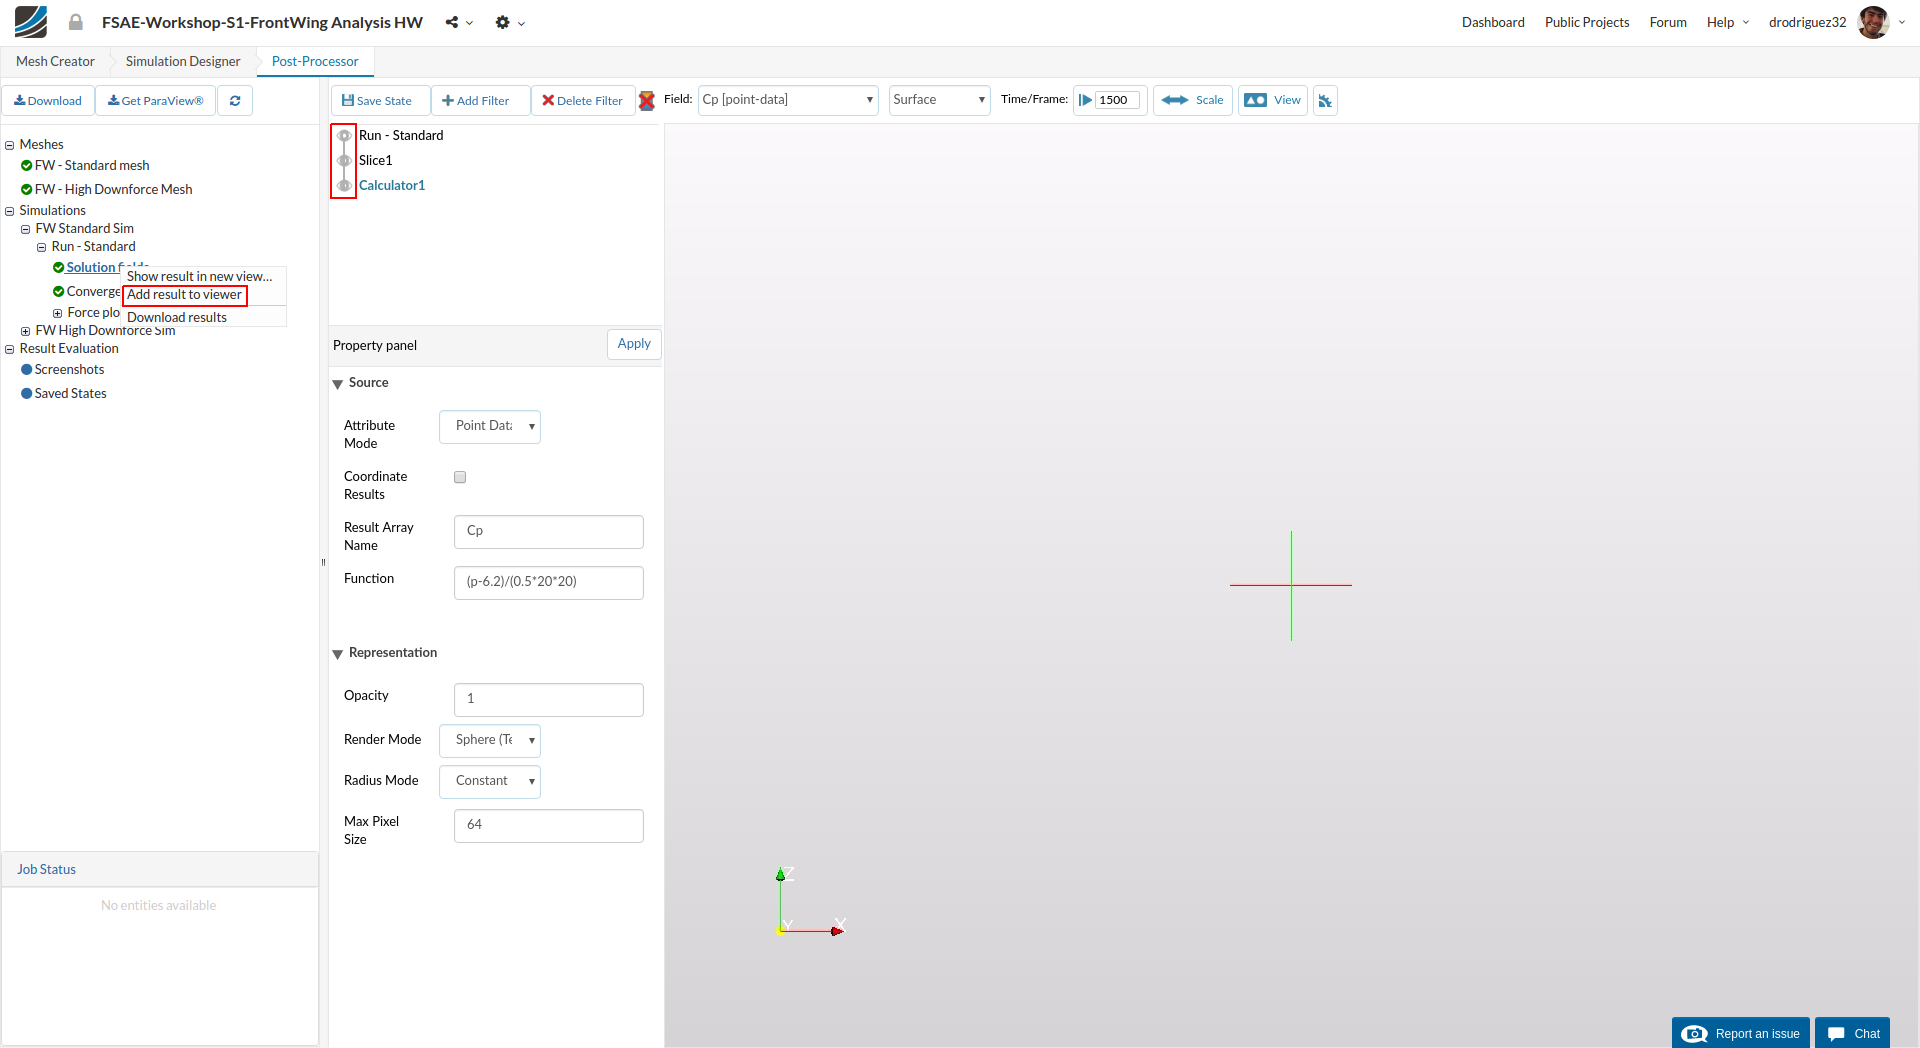
Next we will plot the pressure coefficient. Since this field doesn’t exist, we need to create one. First uncheck the colorbar (important; if you don’t do it, you may end up with two different colorbars in the next step) then select Calculator from Add Filter.
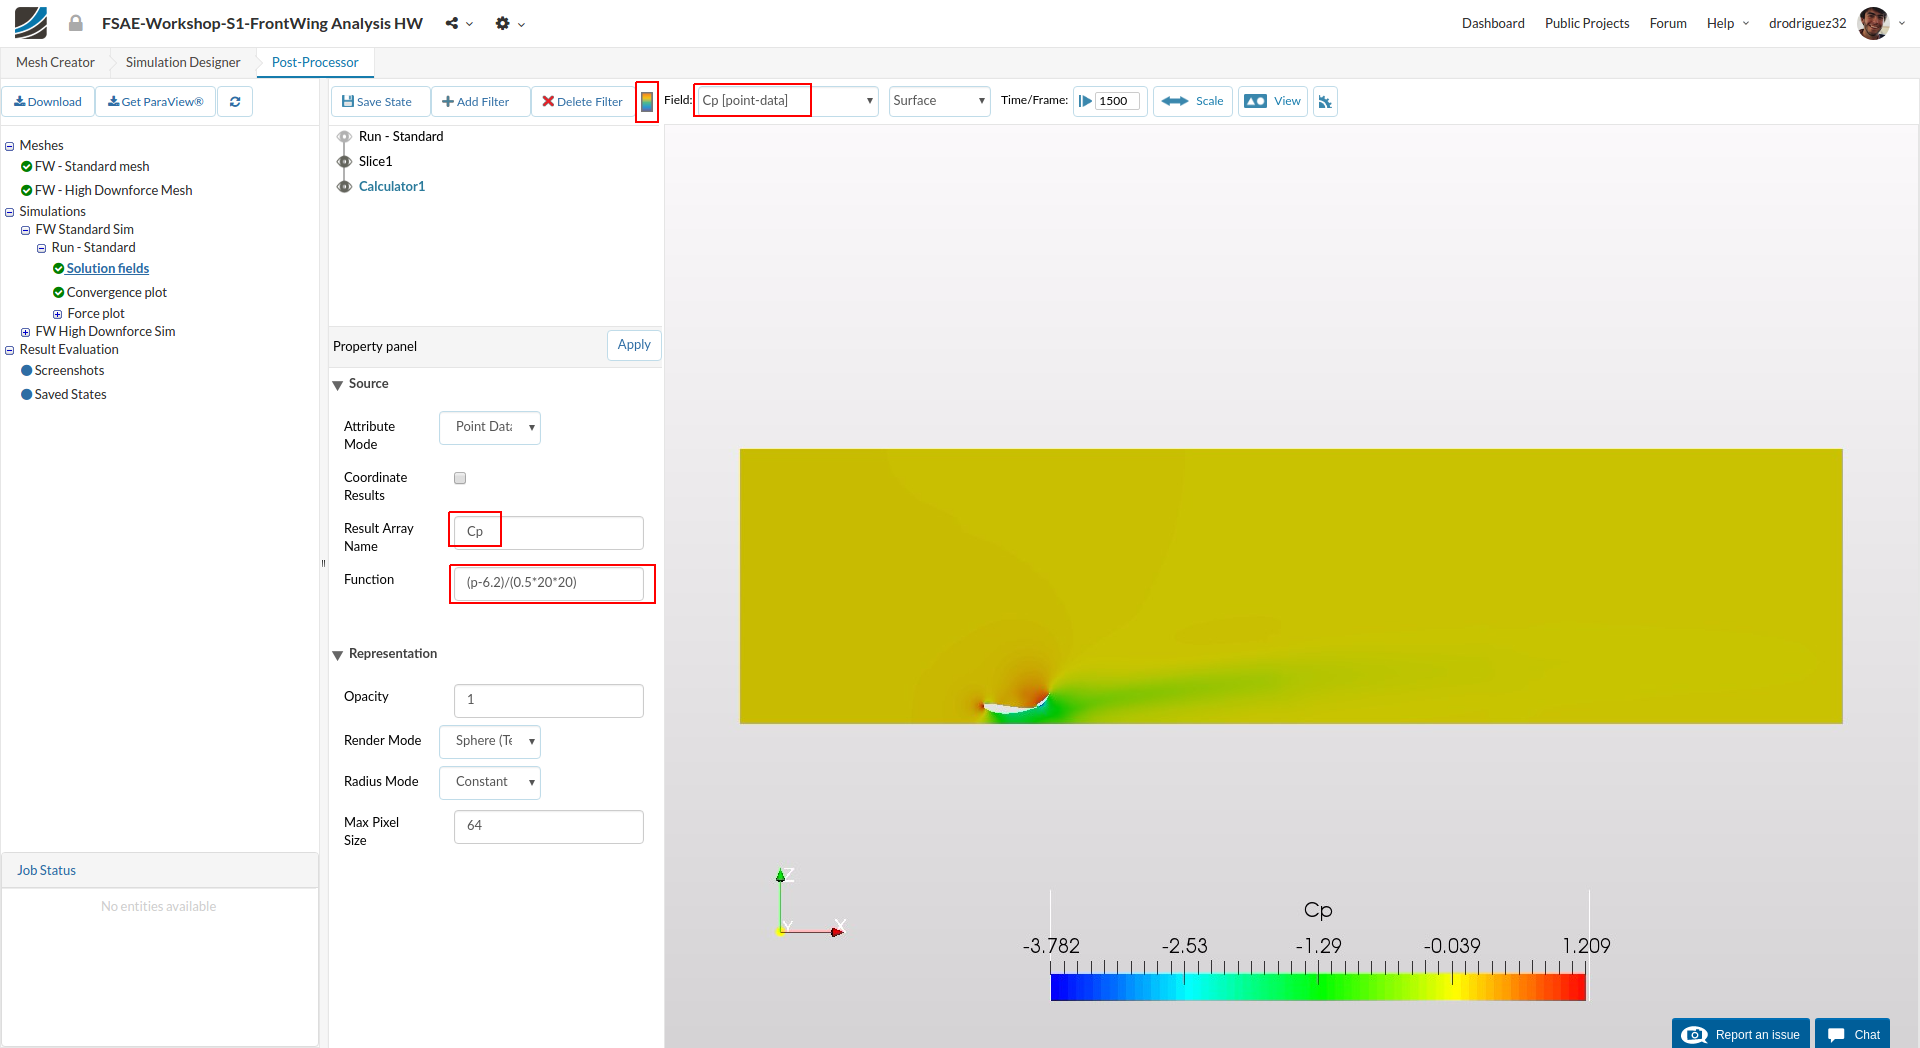
Once the calculator filter is added:
-
Change the Result Array Name and Function to Cp and (p-6.2)/(0.5 * 20 * 20) respectively.
-
Click Apply to create a pressure coefficient field.
-
Change Field to Cp[point-data] to see the results.
Streamlines
Click on the small eye next to the slice and the calculation to hide those filters. Then right click on Solution Fields under Run-Standard and click on Add result to viewer. This can take some time.
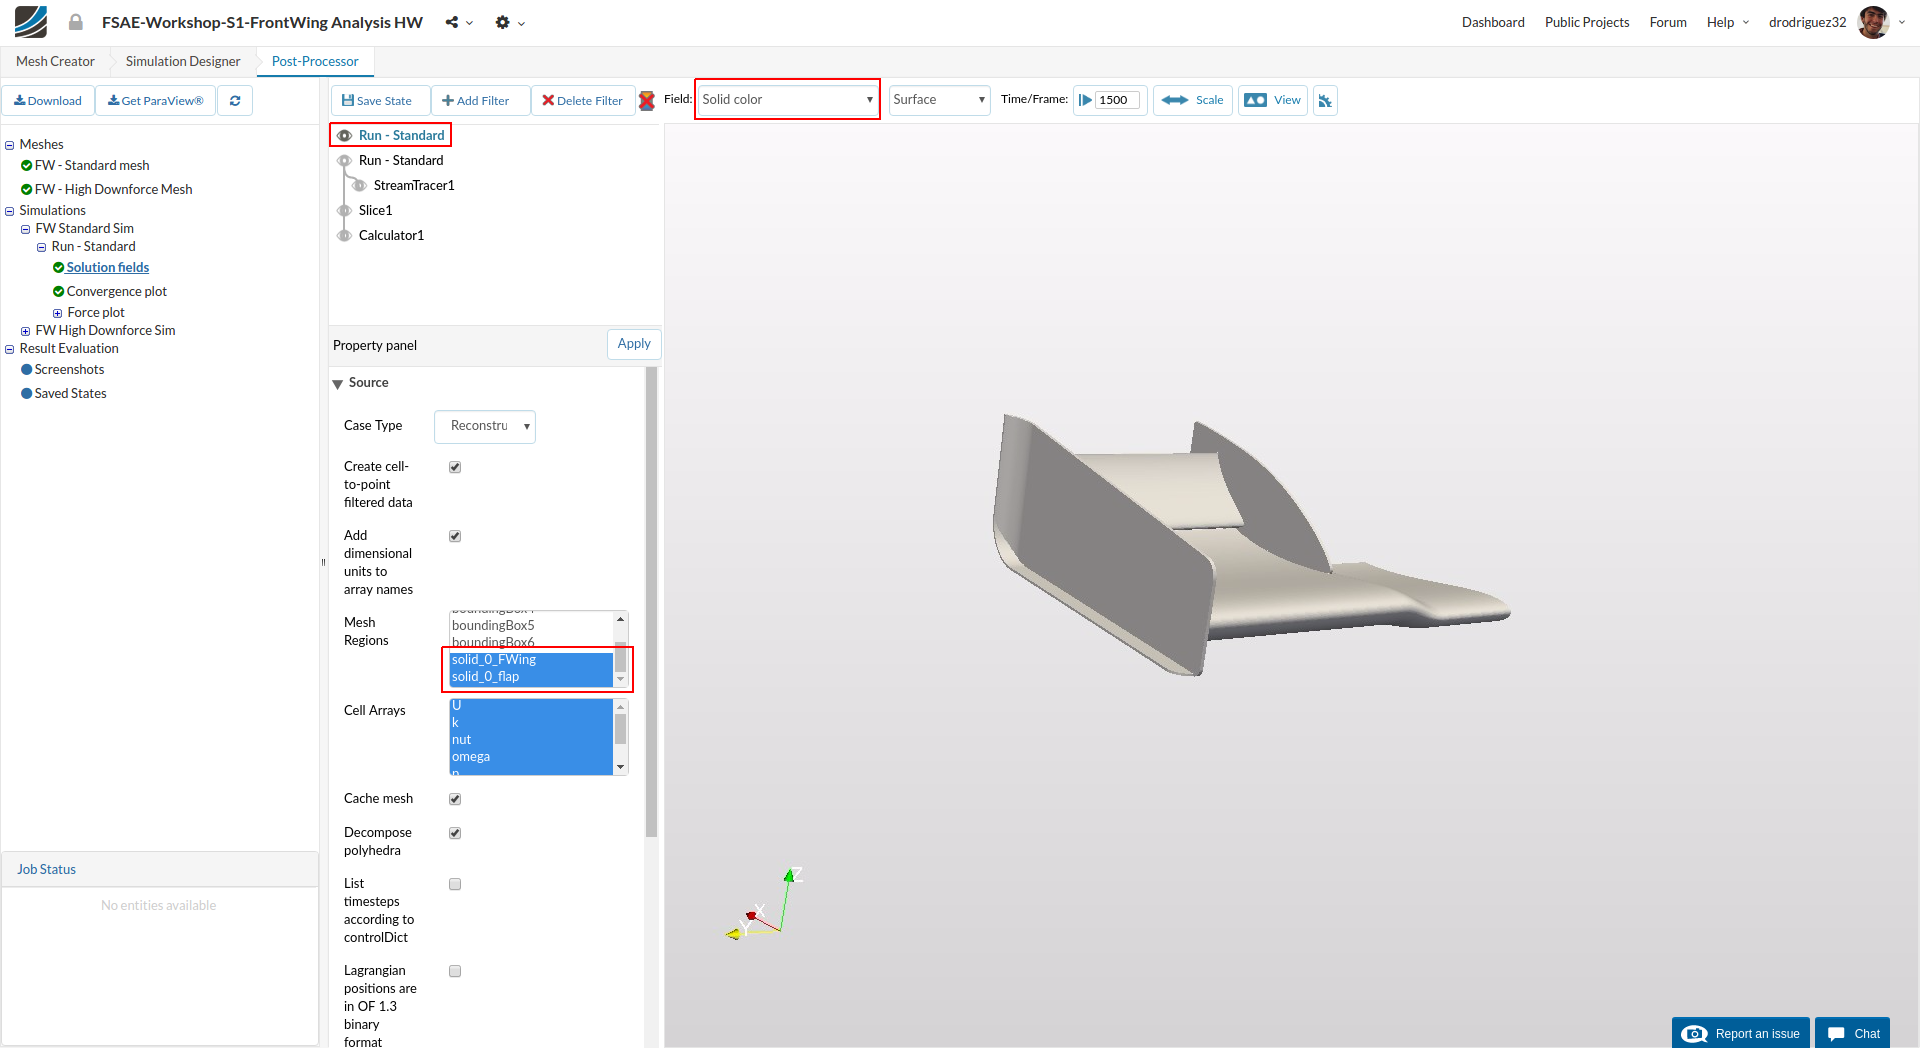
When it loads, click on the new solution field and under Mesh regions select all the faces for the wing (no boundingBox# should be selected). In this case it should be just two (solid_0_FWing and solid_0_flap).
Click on Apply. This will load into the viewer the wing and not the air.
When the wing loads, select Solid color for the field.
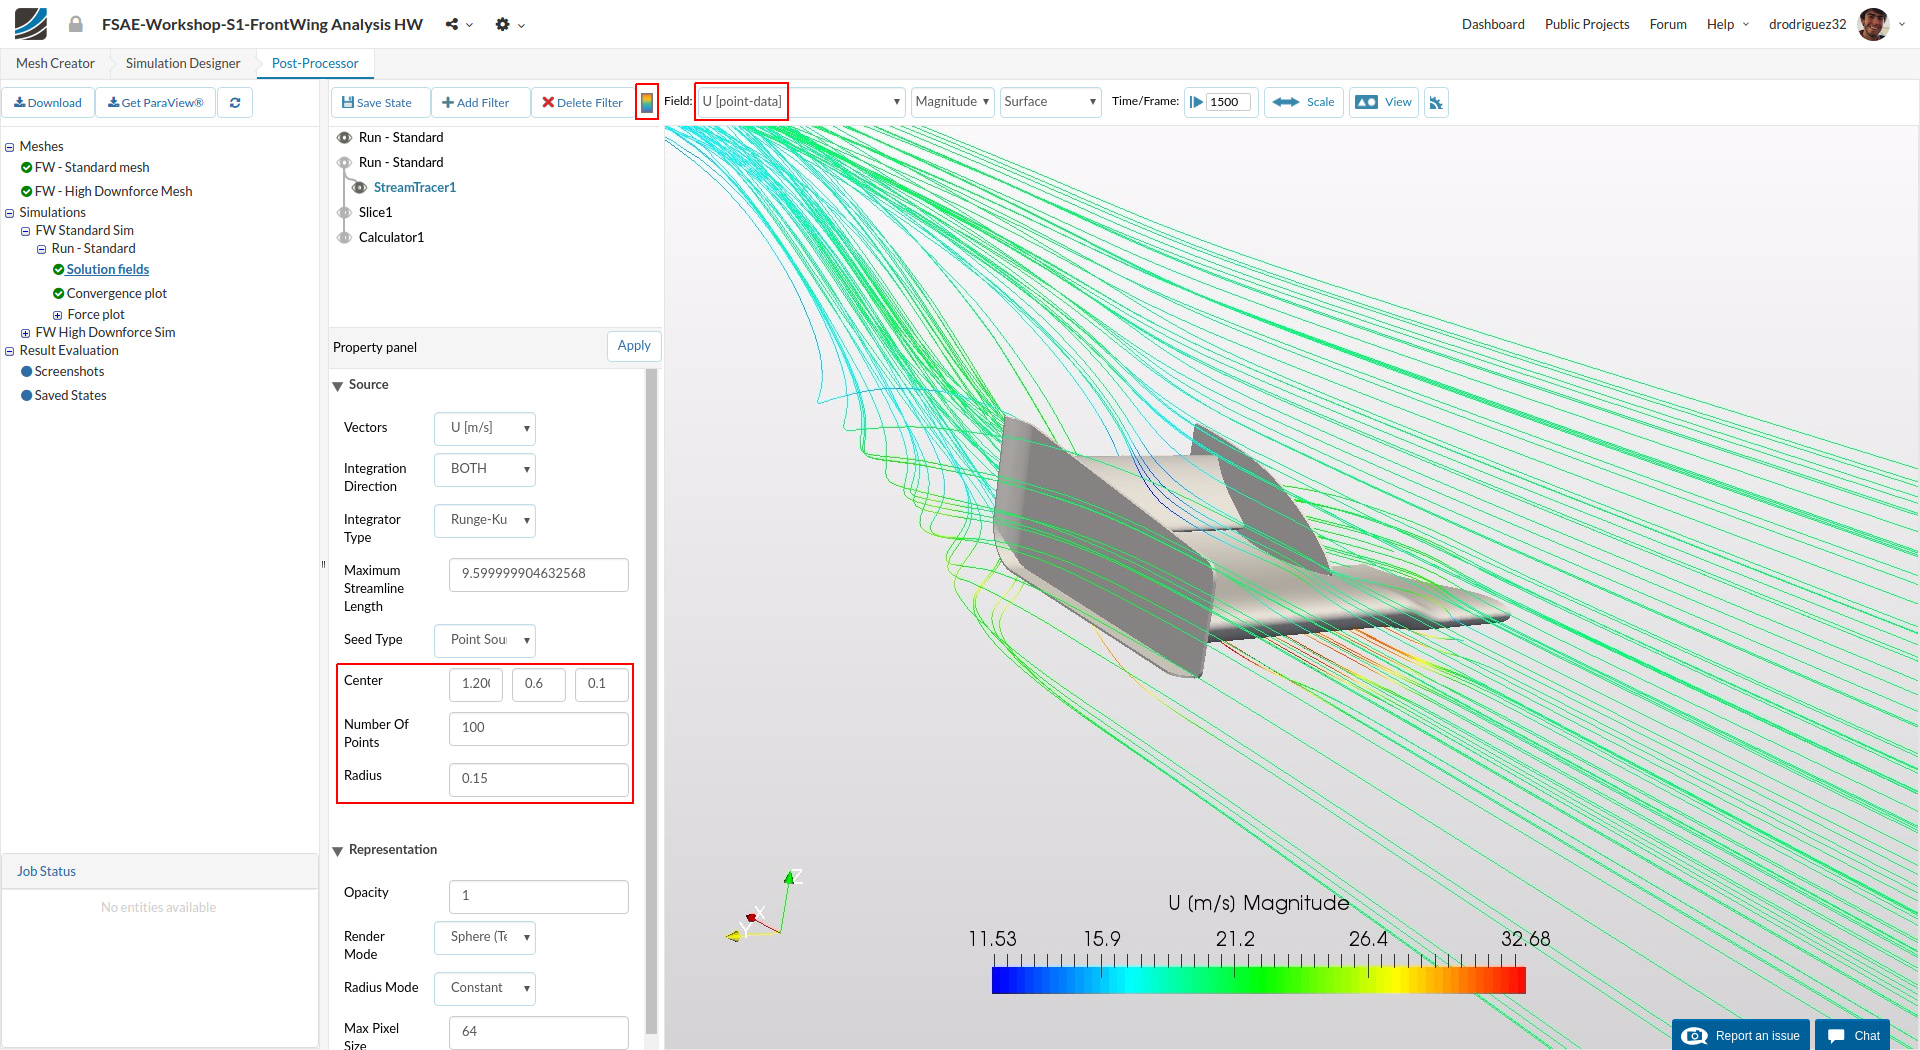
Click on the previous Run-Standard (the one that has the slices and calculator), select Add Filter and then select Stream tracer.
You are free to play around with the Center and Number of Points to get a visualization you like. You can also choose what field you want to visualize, and remember to turn on the color bar. For this case we used:
- Center: (1.2 , 0.6 , 0.1)
- Number of points: 100
- Radius: 0.15
- Field: U [point-data]
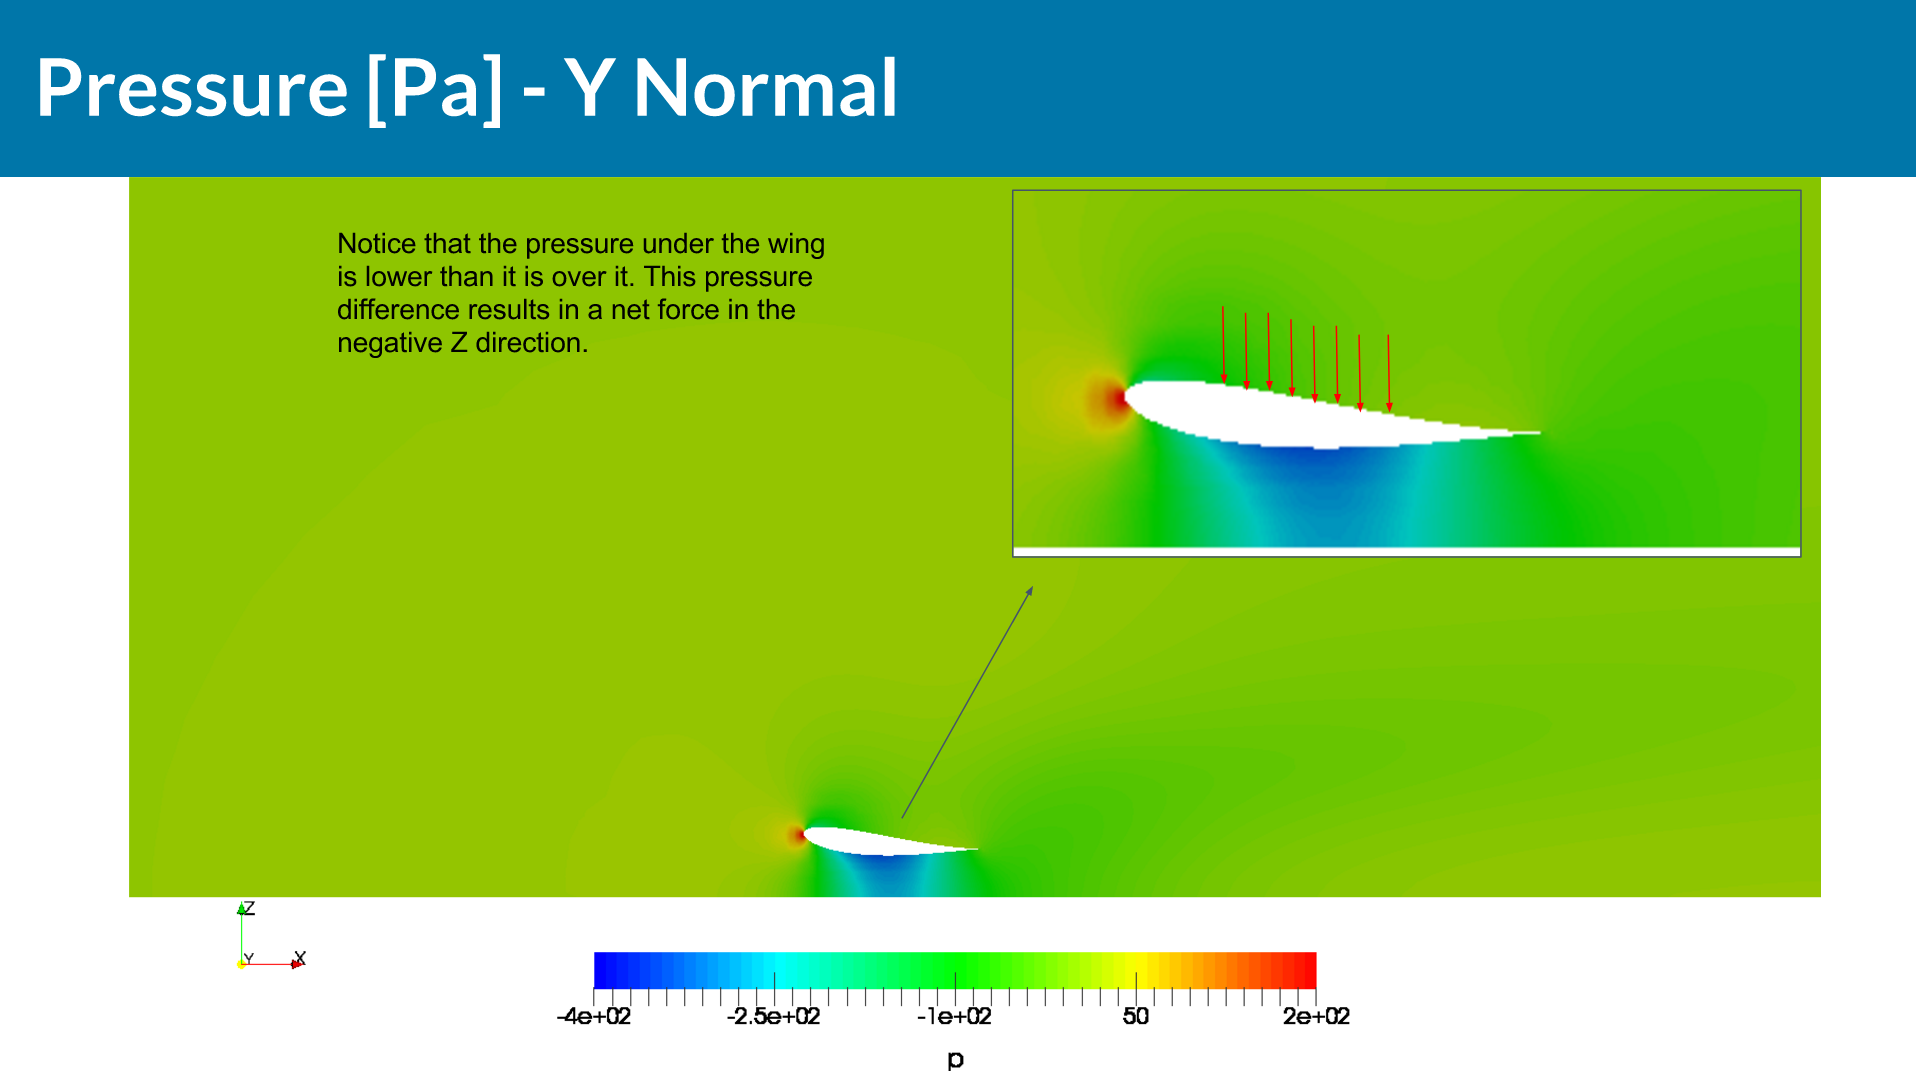
Pressure distribution on wing
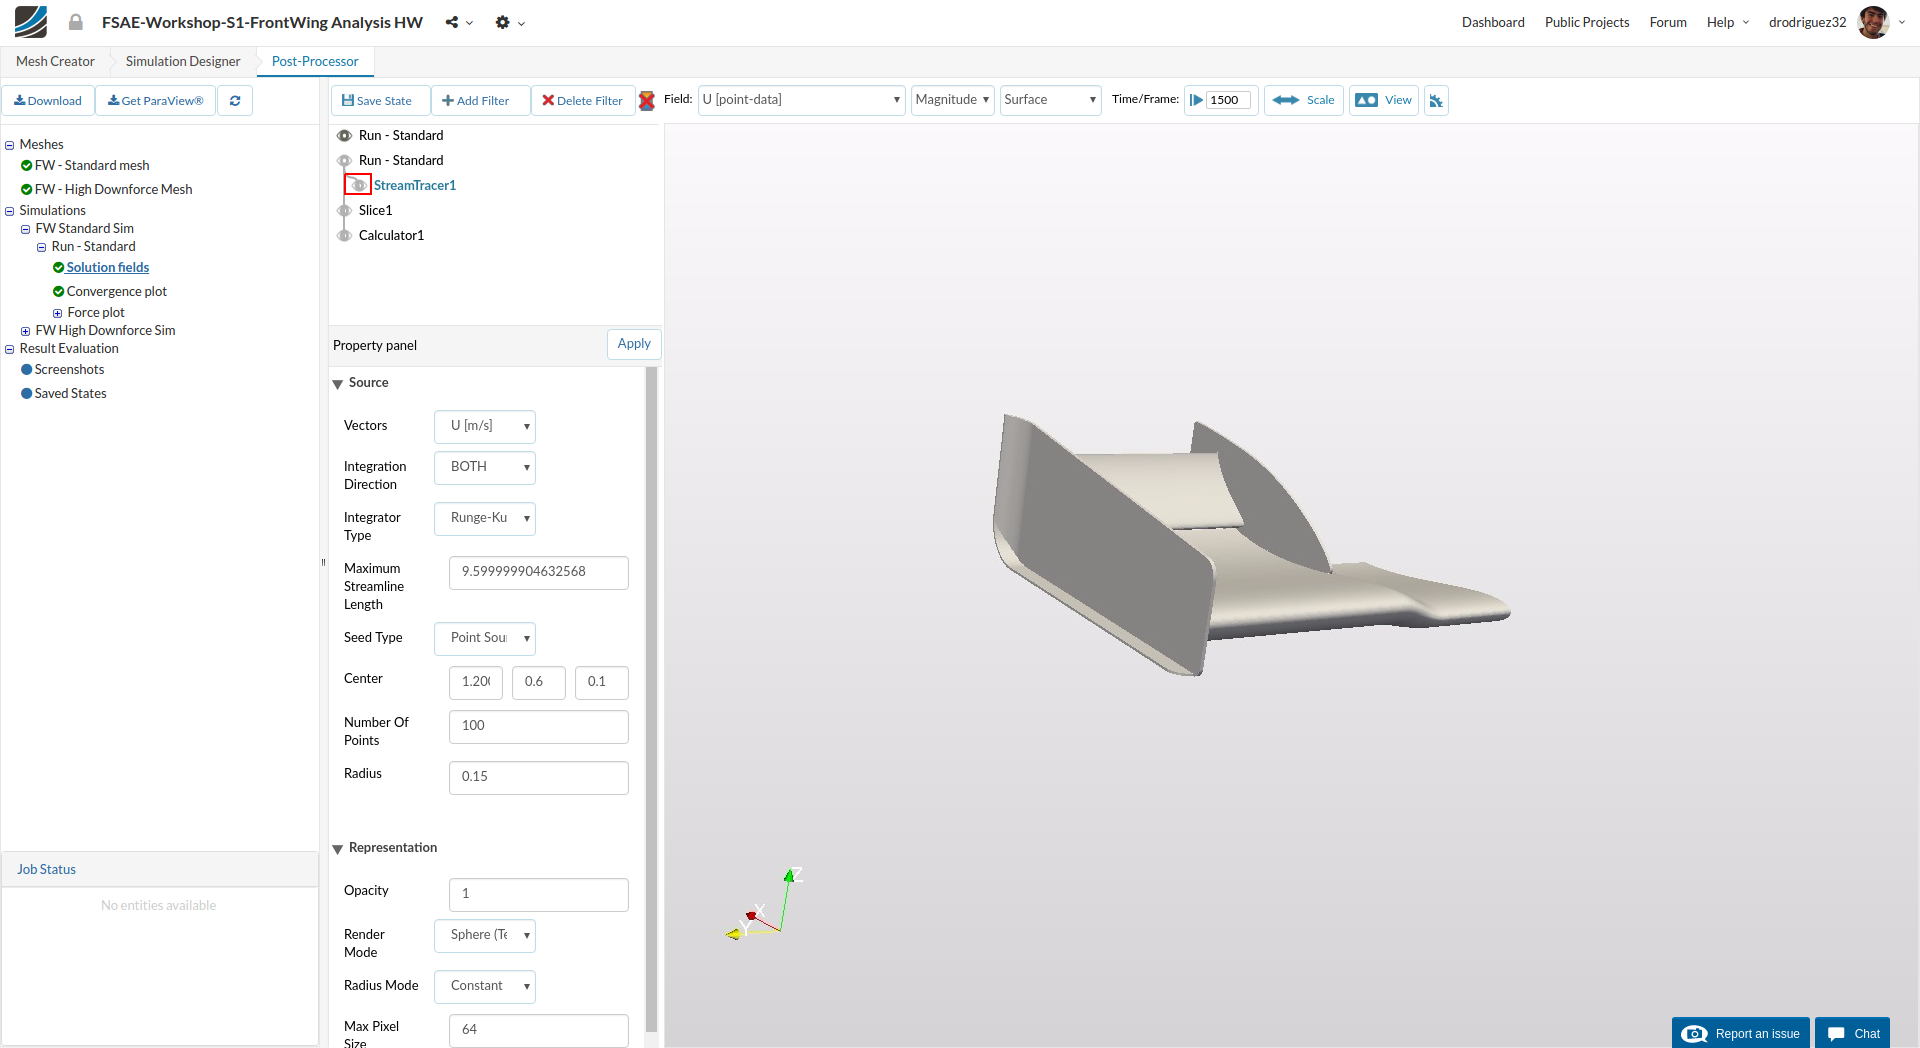
Hide the Stream Tracer by clicking on the eye to the left of it.
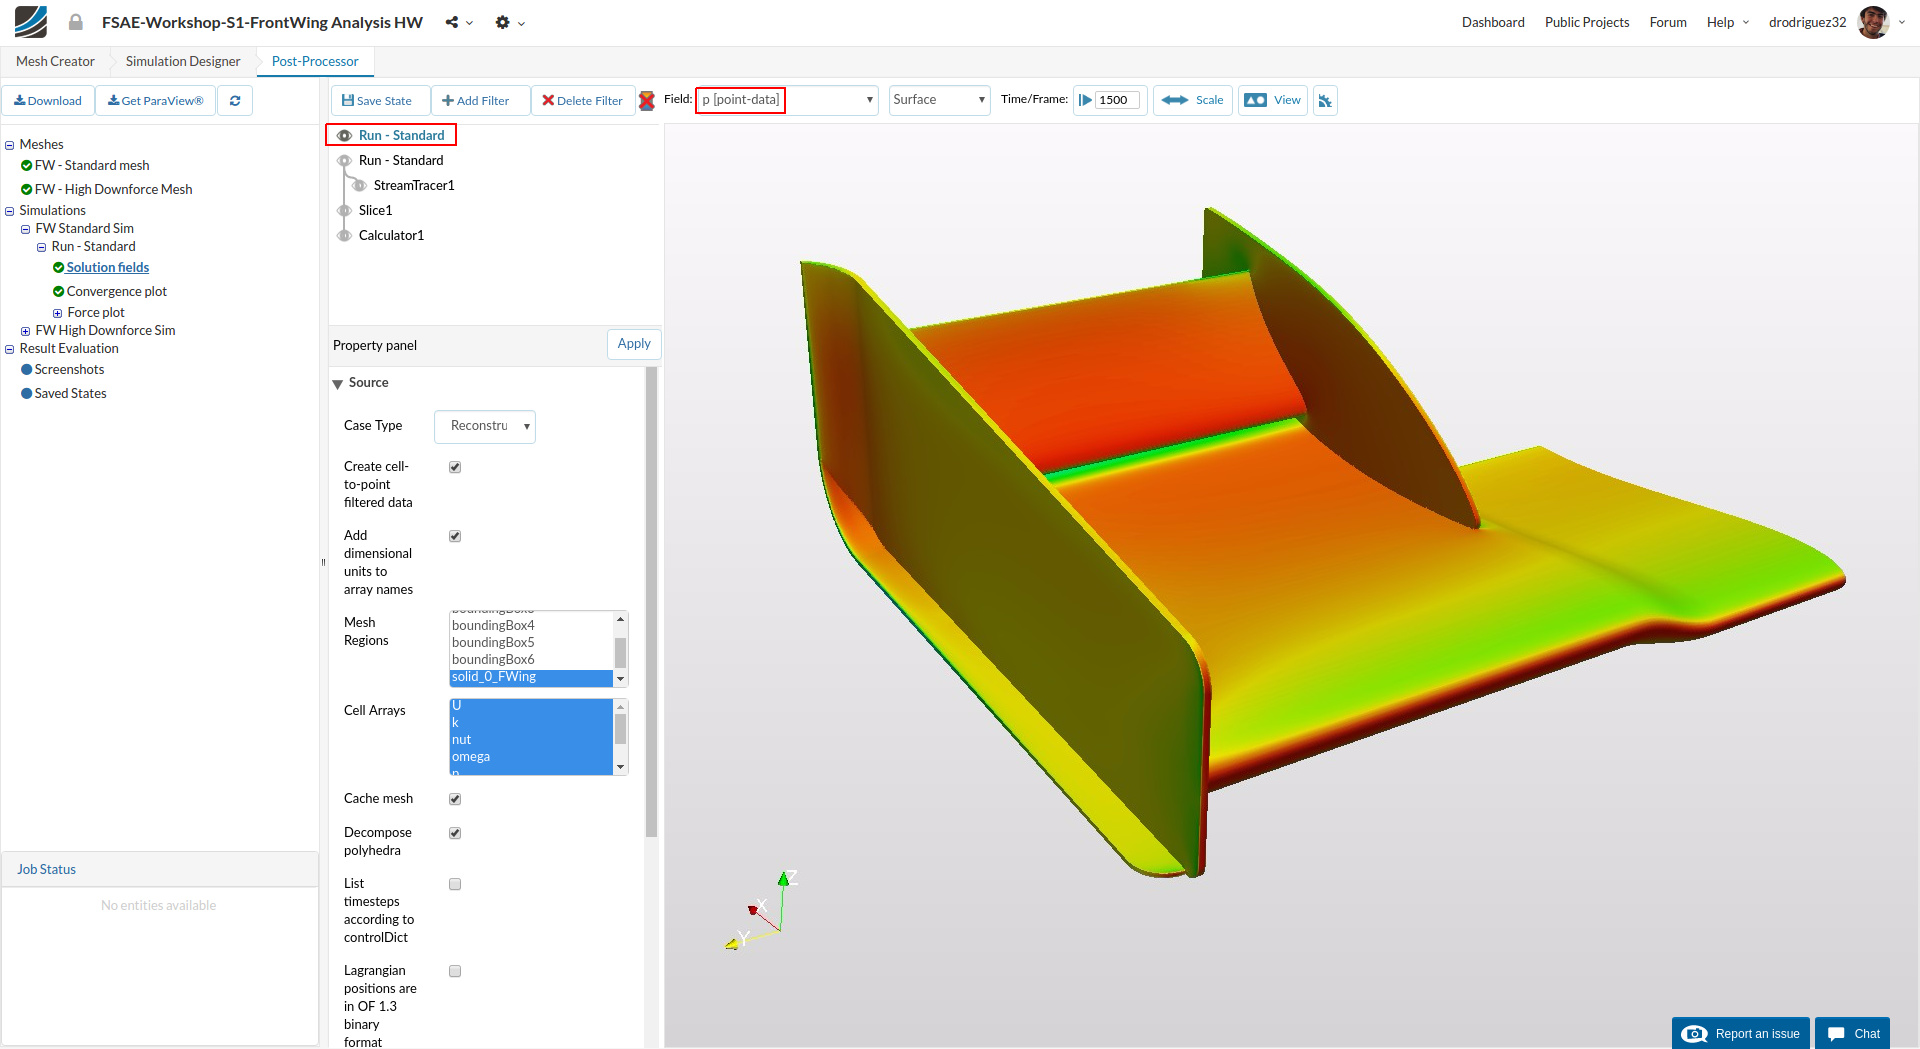
Now click on the “Run-Standard” that corresponds to the wing, and for Field select p [point-data]. This will show you the pressure distribution on the surface of the wing so you can see where the most downforce is being generated.
If you select U [point-data] for the Field the whole wing will look blue. This is because at the surface of the car the air is at a complete standstill.
Additional Features
Screenshot
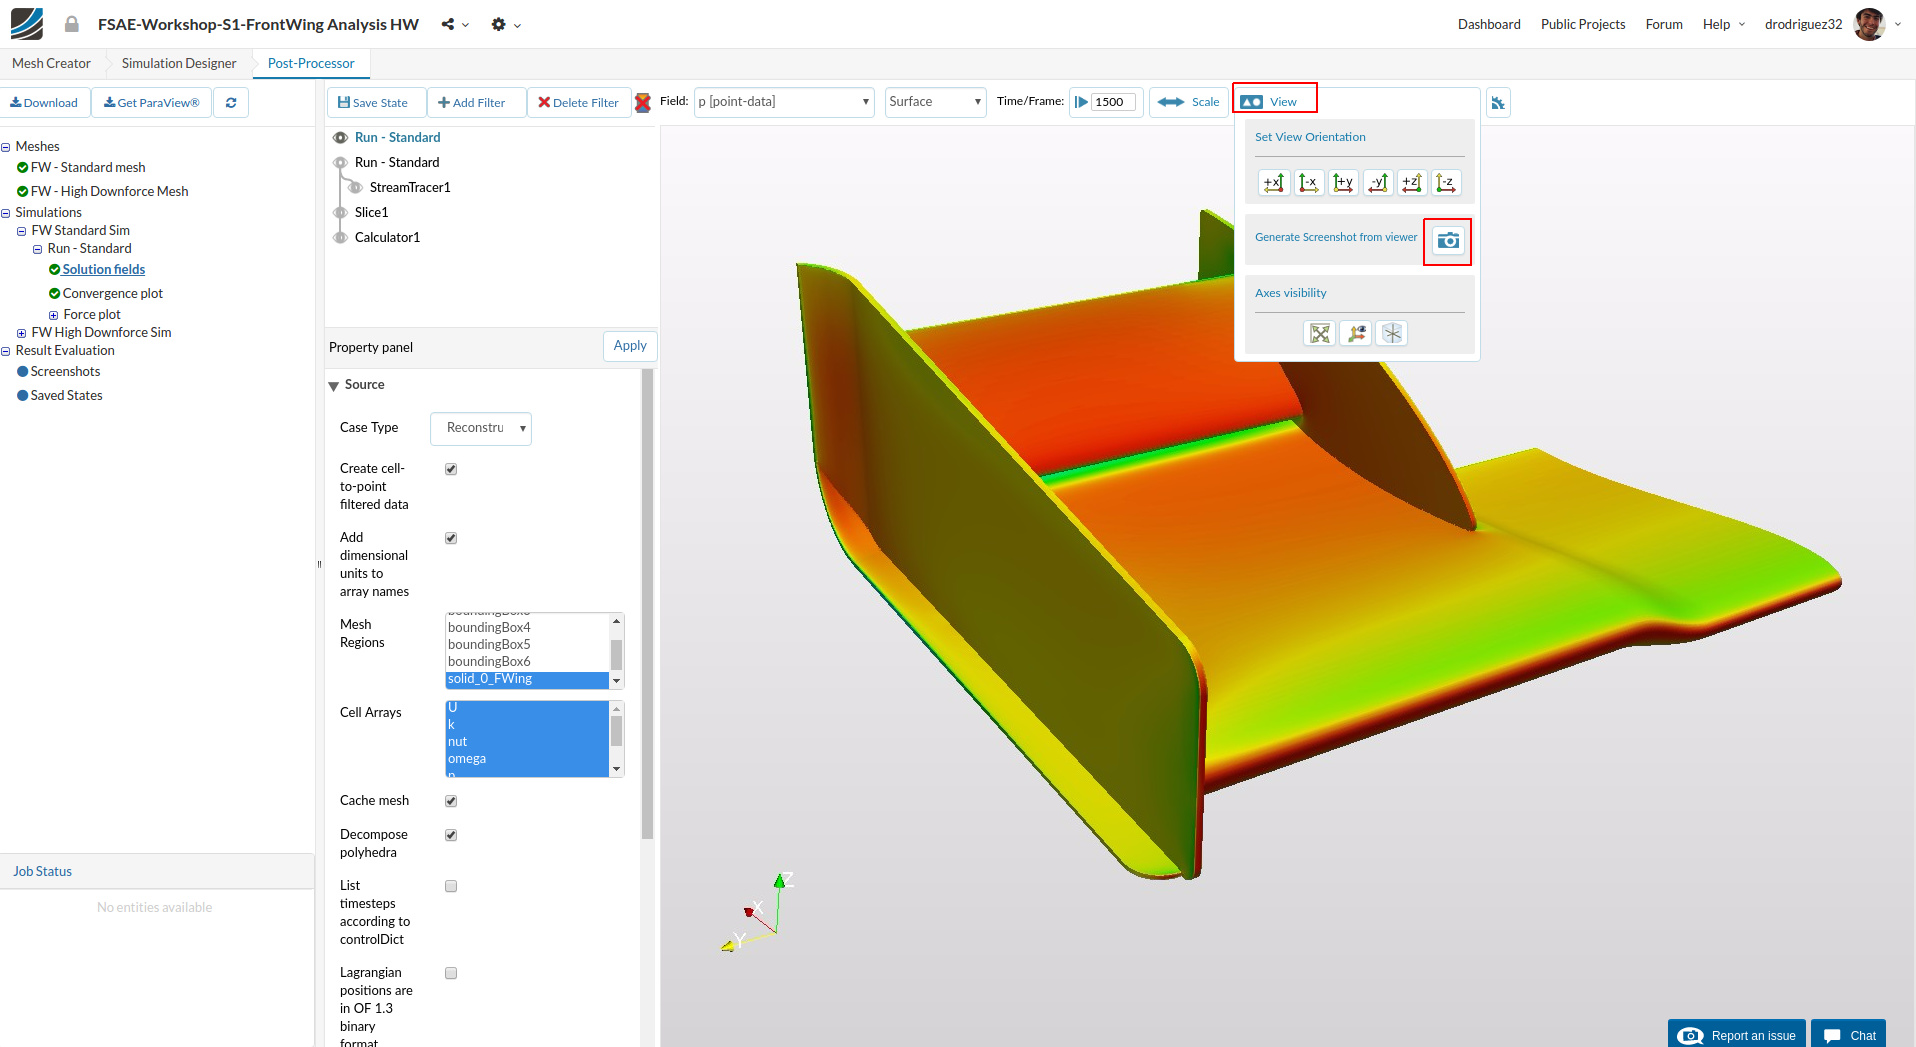
If you want to take a screenshot of your results, click on the camera icon under View tools. Your screenshot will appear under Result Evaluation section.
Save State
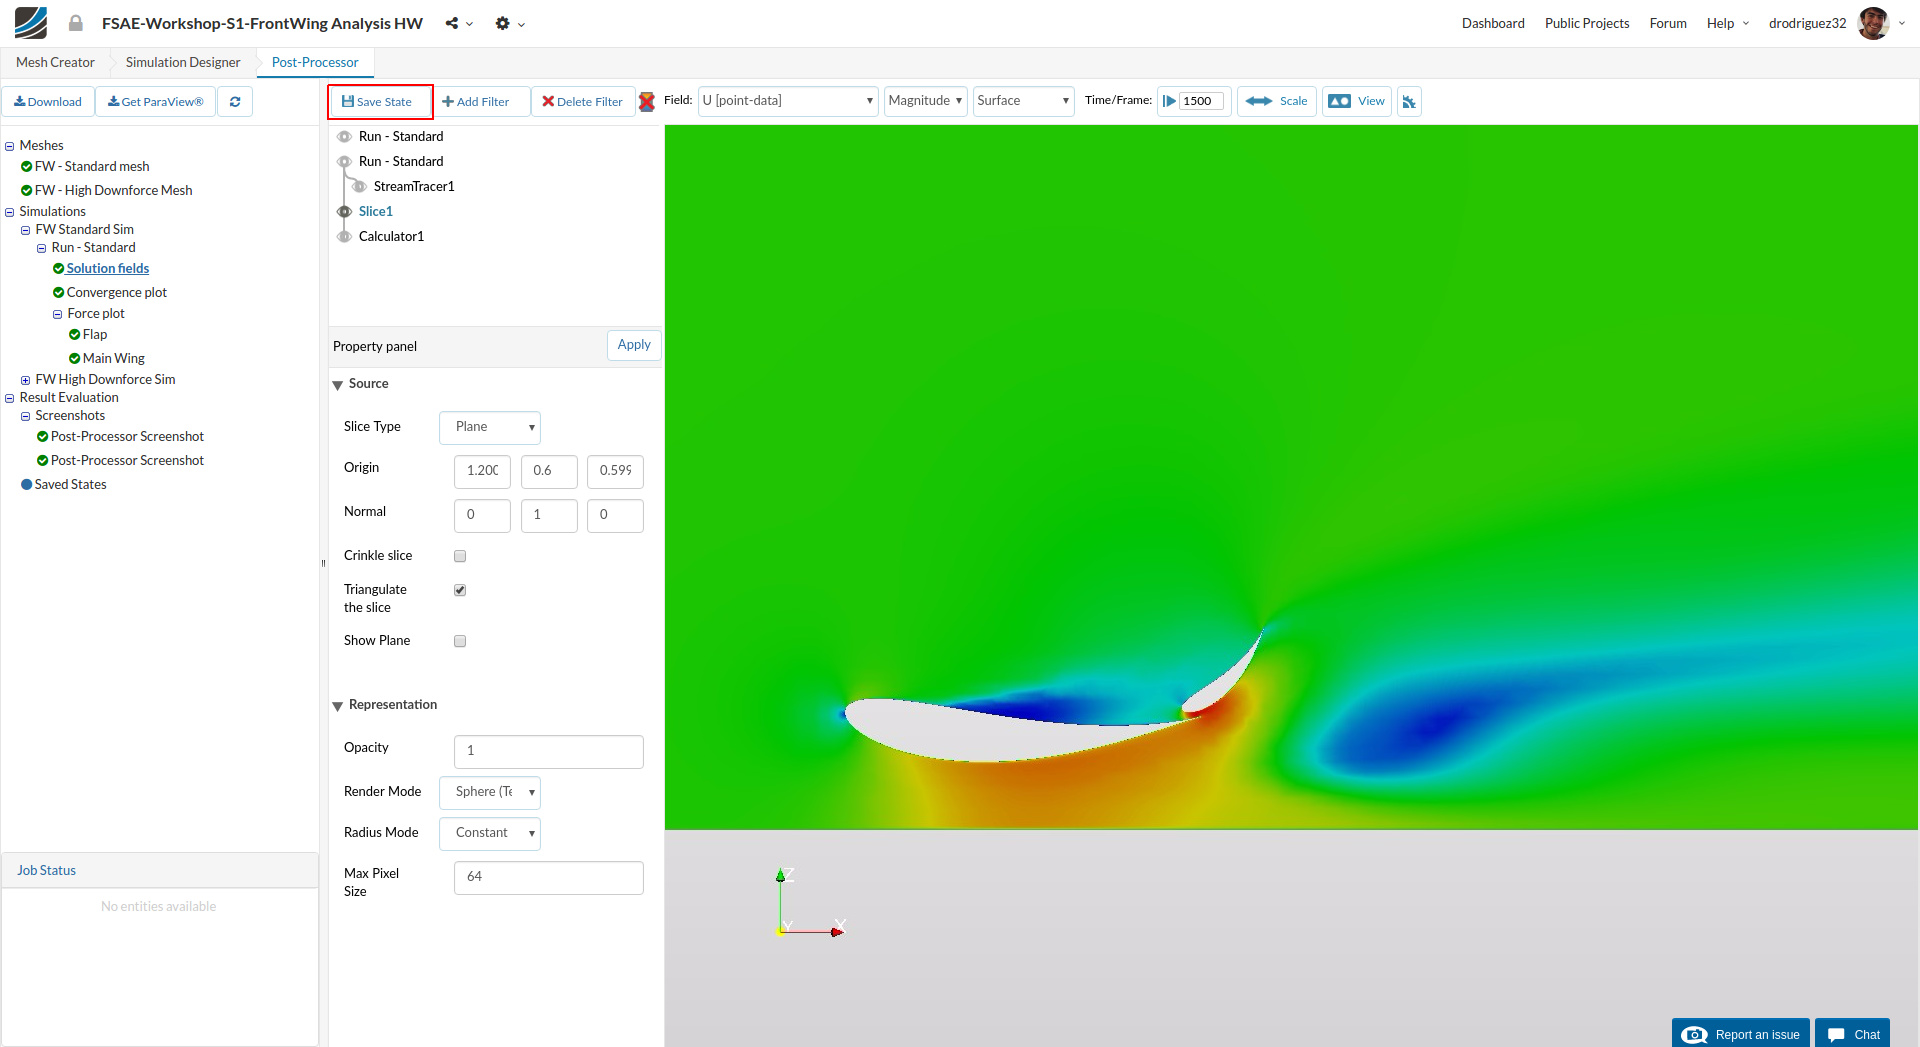
Furthermore, in order to save the state for later use, click on the Save State button. A window will pop up, give a reasonable name e.g. Saved state - Standard (optional) in this case. Your saved state will also appear under Result Evaluation section.
Area Averages
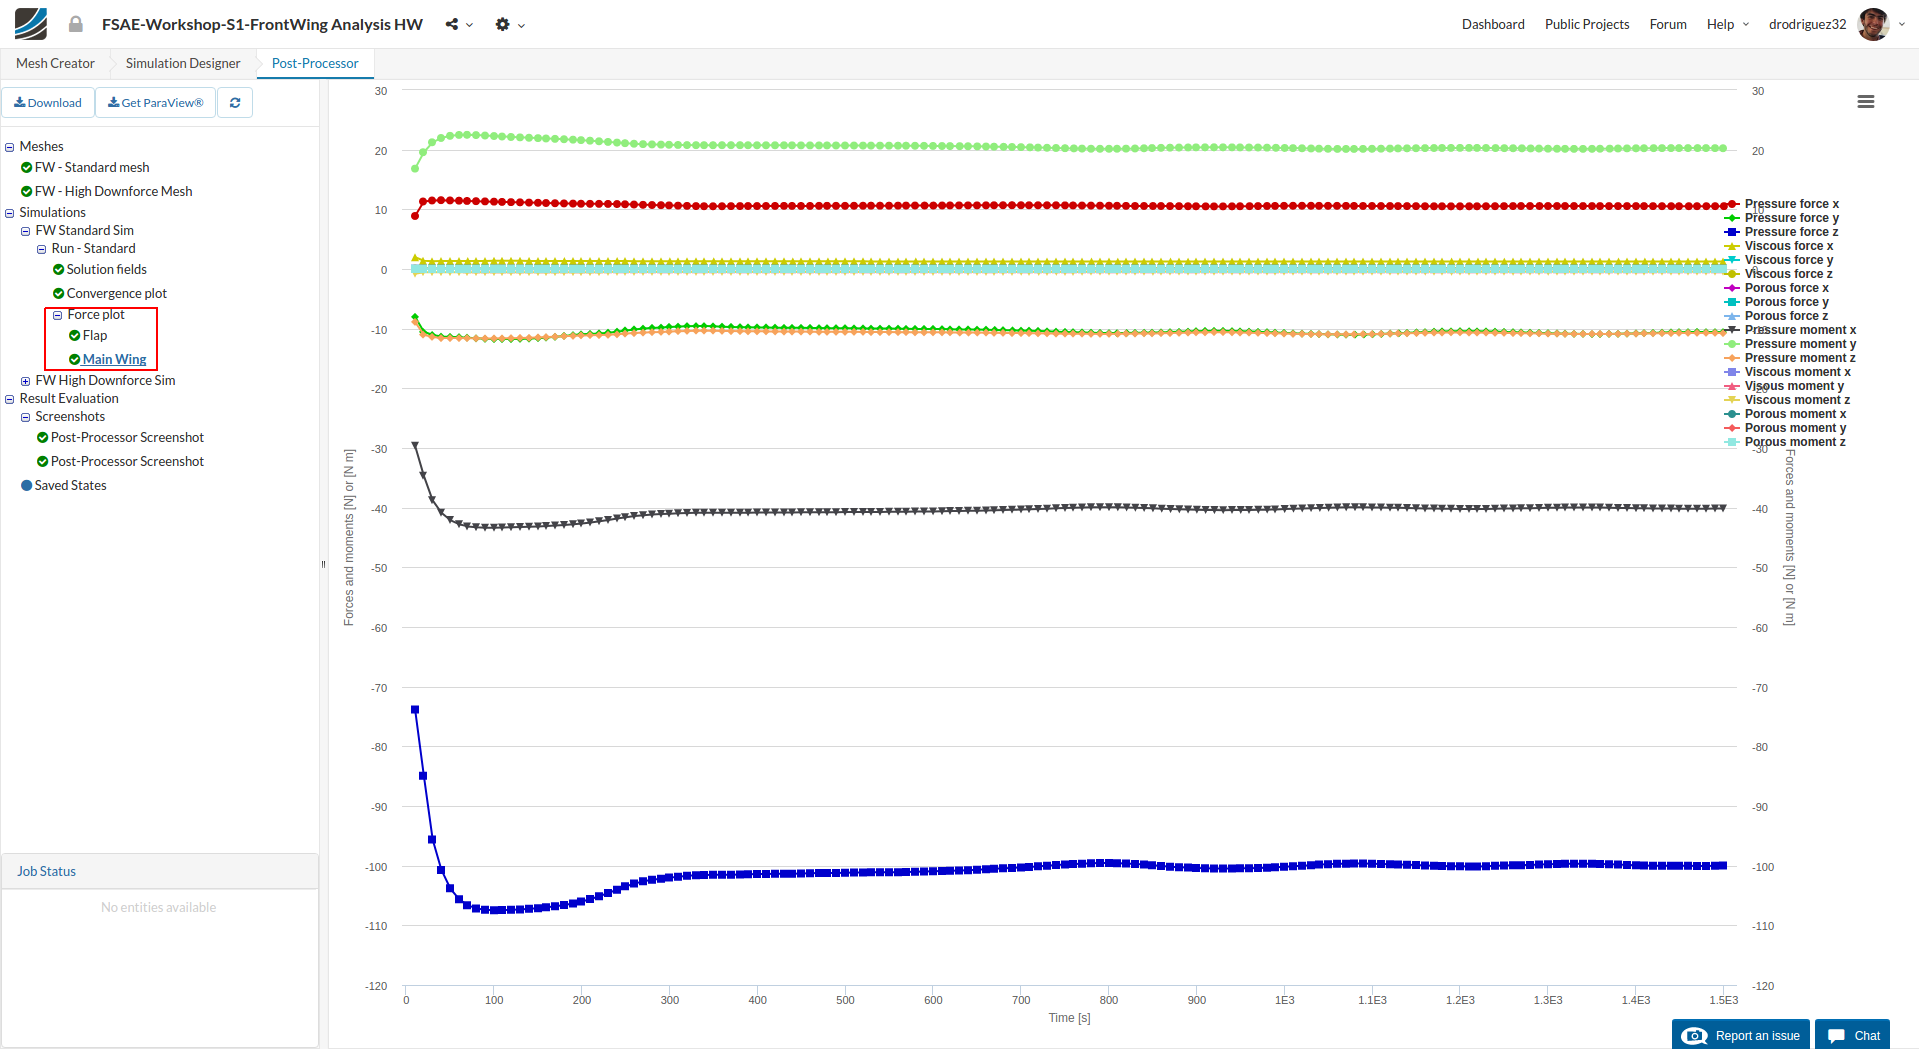
Lastly to see the plotted data requested beforehand during the simulation setup, switch over to WingMain under the Force plot.
This data will give you information on the lift and drag being produced by the wing. For future reference: if these plots haven’t reached a stable value, your simulation hasn’t reached the steady state.
Homework Submission
Homework Deadline: The homework deadline has been extended until September, 26th 11:59 pm CEST
Click Here to Submit your Homework
Recommendations About Comments
If you run into issues during your process, before adding a comment to the thread please consider the following:
- Go over the tutorial one last time and compare it to your setup. Is everything the same?
- Go over the existing comments. Maybe someone has had the same problem and it’s already solved.
- Is there an actual error? Or is it taking a long time to load?
a. If it seems to be a loading issue, please give it some time or refresh the page. Sometimes due to the internet connection the platform may seem slow.
If it’s a new issue that you can’t solve, please outline the issue as specifically as possible and include a link to your project. This will help us figure out what is going on faster and thus we can get back to you faster.