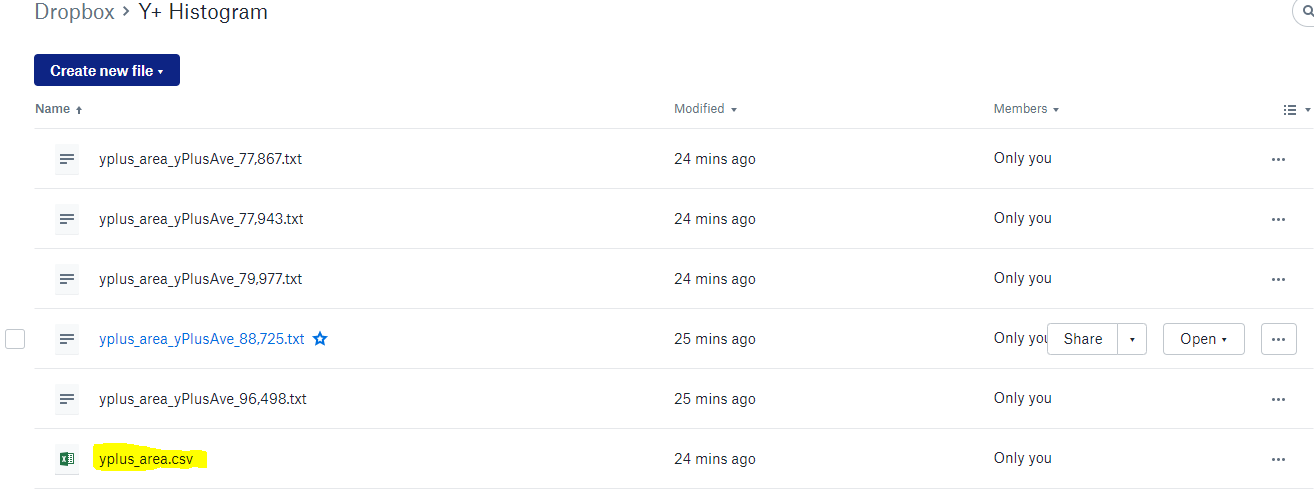
Here is the dropbox link to the folder. I think the run with 88,725 had the error but im not sure.
Problem is, now that full solution dataset when you download it will always contain time 0 and 1000, so even if you continue that run, the useless 1000 iteration data will always be there…
Personally, I would start a NEW sim run with 0 start iteration and 5000 end iteration and watch it until 1% ORSI with Moving Average iterations of about 150, which is about 5x the 30 iteration period of your oscillations (even try 250 when it is running)… As the value that it is oscillating around gets more stable, you can see how increasing the the MA iterations, filters the oscillations out, giving you a better guess at the value the points are oscillating around…
Sorry, when we talked about the way to figure out how many sim iterations to run to for ‘quick future runs’, I was assuming you were talking about my sim run that already had been run to 3000… ONLY AFTER A 1% FULL RUN CAN YOU DECIDE WHAT ITERATION YOU WANT TO USE FOR A FUTURE ‘QUICK RUN’…
If I actually realized you were asking about the full car sim run I would have said to use 5000 end iteration and stop it manually when ORSI 1% is reached …
PS: To save space after solution set down loads, I always delete the useless Time 0 folder which saves a LOT of hard disk …space
Those are just the 1kb .txt summary files… I need the 30mb .csv output file from ParaView…
I see that you have not setup your windows file explorer to ‘show extensions’, it might help you if you had file extensions visible, rather that relying on Windows icon guess for which program you want to use for when you click on a file, I hate it when Windows gets more Macish 
Dont worry i had run the full car simulation before we talked about when to stop / what write interval to use. I had done that sim mainly to see Y+ values so i could know if a full car with 1 layer was landing in the 30-300 range. I now know it is .
So i understand the Moving average input correctly. Is this used to calculate the average Cl or Cd value as its moving along the iterations? So a MA of my current value of 50 would show one full cycle of raw data in yellow? Changing this to 150 or 250 will flatten out the wave values so i can make a better guess of the average value between the cycles correct?
This is very useful thanks!!
Yes, yes, yes…
My latest chart here, has column titles that explain what is happening with ORSI better than the program output screen… The ORSI value is in fact a Moving Average value at the ‘Iteration of interest’ and the % is the range of MA values in the previous number of iterations in the ORSI window ![]()
Is it possible that you had that 30mb file in a folder where yPlusHistogram was in the ‘Monitoring is ON’ green mode?
I think the error comes when my monitoring code opens a yPlusArea.csv file instead of a 2D plot csv file, I can easily plug that error but I did not forsee a person doing that…
mmm that i cannot say for sure. I have one copy of the histogram.exe in the folder with the case-foam data and another in the downloads directory. Im pretty sure i didnt have it in monitor mode but i can try to replicate this again next time i download a csv file.
OK, I will plug that error anyway in v206 
PS: I can not seem to duplicate your error on that file when I try to get a yPlusHistogram with it, I get no errors… So that bug will float around for a while until it happens to me while I am in debug mode 
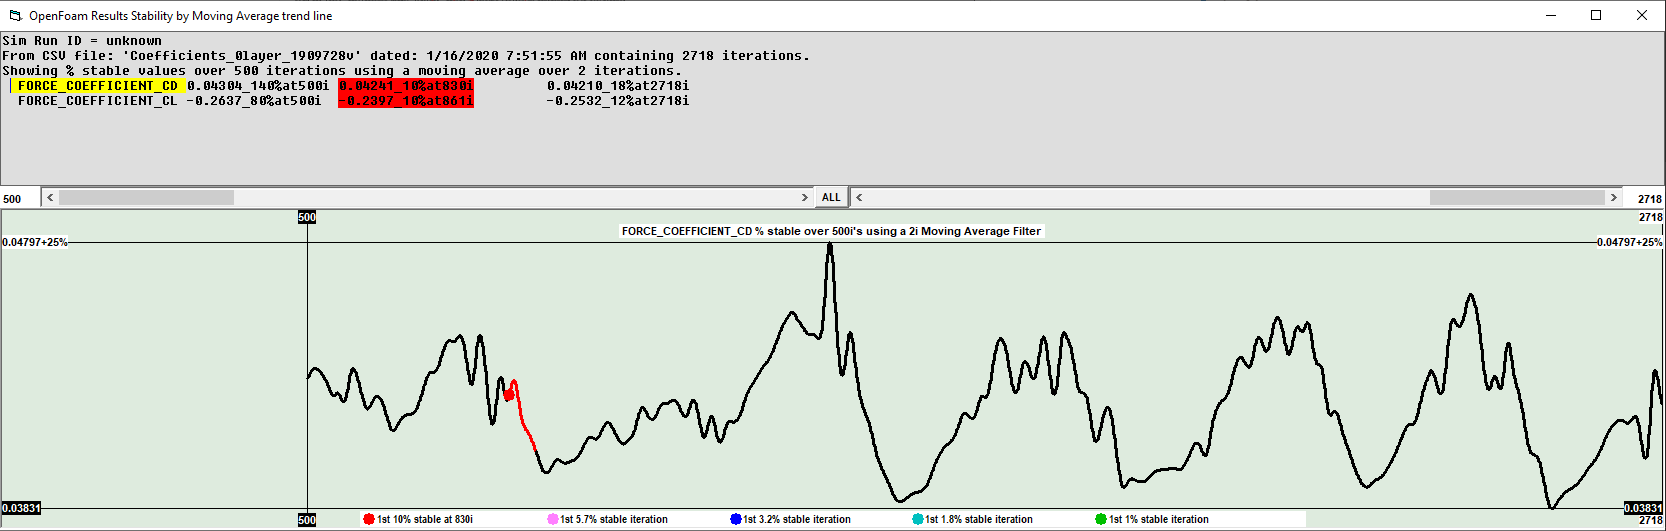
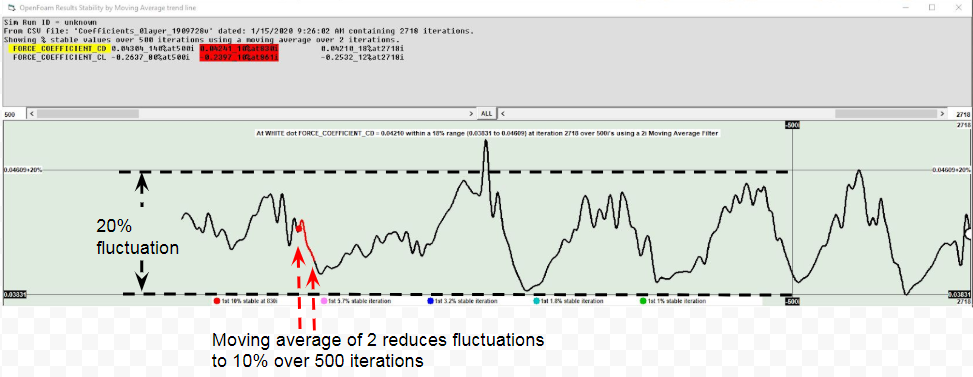
OK so … Here is the full simulation run. You have taken the last 500 iterations, which encapsulates one full cycle of the raw yellow data, varying 20% over the 500 iterations, which makes it difficult to estimate the “true” average of the cycle.
This next picture is showing the 500 iteration section from the entire simulation shown above. It is still fluctuating at 20% but by changing the MA to 2, it takes the average of 2 iterations within 10% fluctuation (because there are no other areas less then 10% fluctuation available) over this 500 iteration range, giving you the closest average of the data set at 0.424 Cd and -0.2367 Cl.
Correct?
Yes I didnt know you needed the 30mb file from the exact moment, I thought it was the other txt file. The one i sent was from the final data set where i got no error. The one with the error is most likely when it was a 25mb file. Next time ill remember to send one with the error.
1 Like
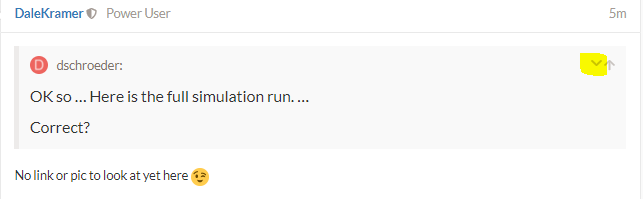
No link or pic to look at yet here ![]()
Huh? i copied your pictures to see if im understanding this right, is it not there?
Is it just collapesed?
No, pics or collapsed, I have seen this before from you (like the first time you put green arrows at separation point on an image, it wasn’t there and still is not I think) , not sure what problem is…
here is the post again
OK so … Here is the full simulation run. You have taken the last 500 iterations, which encapsulates one full cycle of the raw yellow data, varying 20% over the 500 iterations, which makes it difficult to estimate the “true” average of the cycle.
This next picture is showing the 500 iteration section from the entire simulation shown above. It is still fluctuating at 20% but by changing the MA to 2, it takes the average of 2 iterations within 10% fluctuation (because there are no other areas less then 10% fluctuation available) over this 500 iteration range, giving you the closest average of the data set at 0.424 Cd and -0.2367 Cl.
Correct?
I think what is happening is the file isnt working because i edit/add arrows in a google docs drawing, this is making a different file that doesnt open here. Has this been happening the whole time?
Yep whole time, but I just assumed you forgot, sorry, never mentioned before, were you seeing the images and I was not?
EDIT: I do see the images now in your above repost
yea … oh man i had a lot too
EDIT - maybe i should go back and redo all the pictures so it is more helpful for anyone reading
Is that a yea that you saw your images when I did not, now that is really weird…
I have started using Greenshot for most of my screen captures and note making on them, it lets me capture the exact same screen area repeatedly which is how I got those pixel perfect captures from ParaView windows ![]()
I would do that but I am pretty anal about keeping things organized for those that follow…
Not sure we have many people following us right now ![]()
Yes, i see all my images, and i also see them again when you respond to my posts and “quote” things.
I am using the snipping tool to take screenshots. I use google docs so i can have everything online and i can share my documentation easily within the FSAE team.
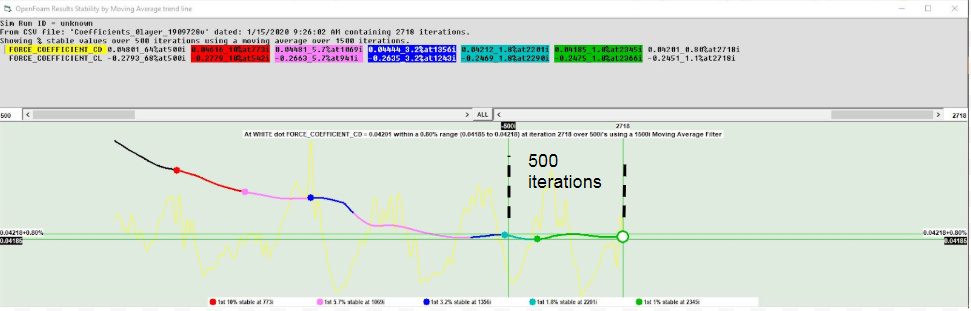
I don’t think you are quite there yet in your understanding of ORSI by Moving Average …
First, consider to stop using the word average by itself when referring to anything about ORSI by Moving Average…
Two things happen here, first the data is filtered by taking EACH iteration and calculating a Moving Average for THAT iteration by summing up the results values (the Yellow line) for the previous X iterations (my programs ‘# of Iterations in moving average filter’) and then dividing that total by X, this is the Moving Average for that iteration… The ‘Black and other non-yellow colors’ line is then a Moving Average line…
Second, we then look at an ‘MA value at any iteration of interest’ or ORSI value (the white dot) with the mouse or by clicking on the value in the upper text summary. At this ‘Iteration of interest’ we then look back Y iterations (my programs ‘# of Iterations for ORSI % calculations’ value)… Over those Y iterations we look for the Max and Min MA value in that region… Then the ORSI % is taken as 100*(Max-Min)/ORSI … The horizontal and vertical ‘MA graph scaling lines’ are set to bracket the ORSI window when a White dot is on the screen (at ORSI iteration, ORSI-X iteration, ORSI window Max Parameter value, and ORSI window Min Parameter value) …
.
.
.
.
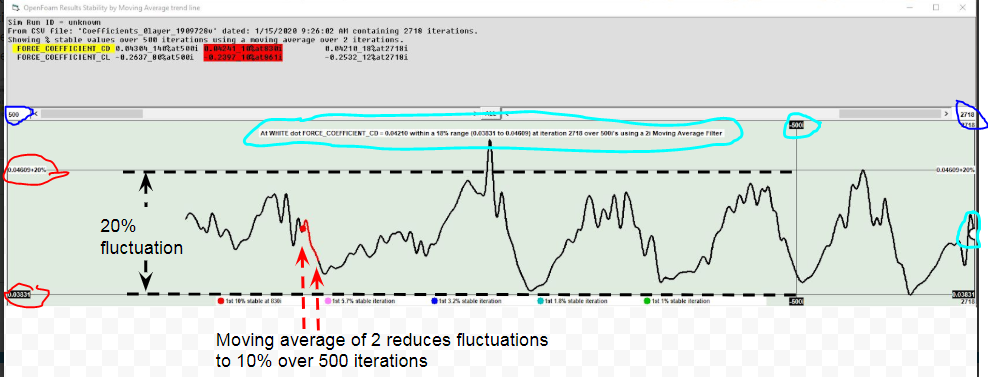
That is not quite a correct description of the 2nd image you have put notations on…
More correct, if you look below at the Blue circled numbers, the extent of iterations shown in the plot lines are from 500 to 2718.
The ‘500 section iteration section’ you mention is for the data at the White dot iteration (currently at 2718i) and in that 500 iteration window the ORSI % is 18%… (Cyan circled data)
.
.
.
.
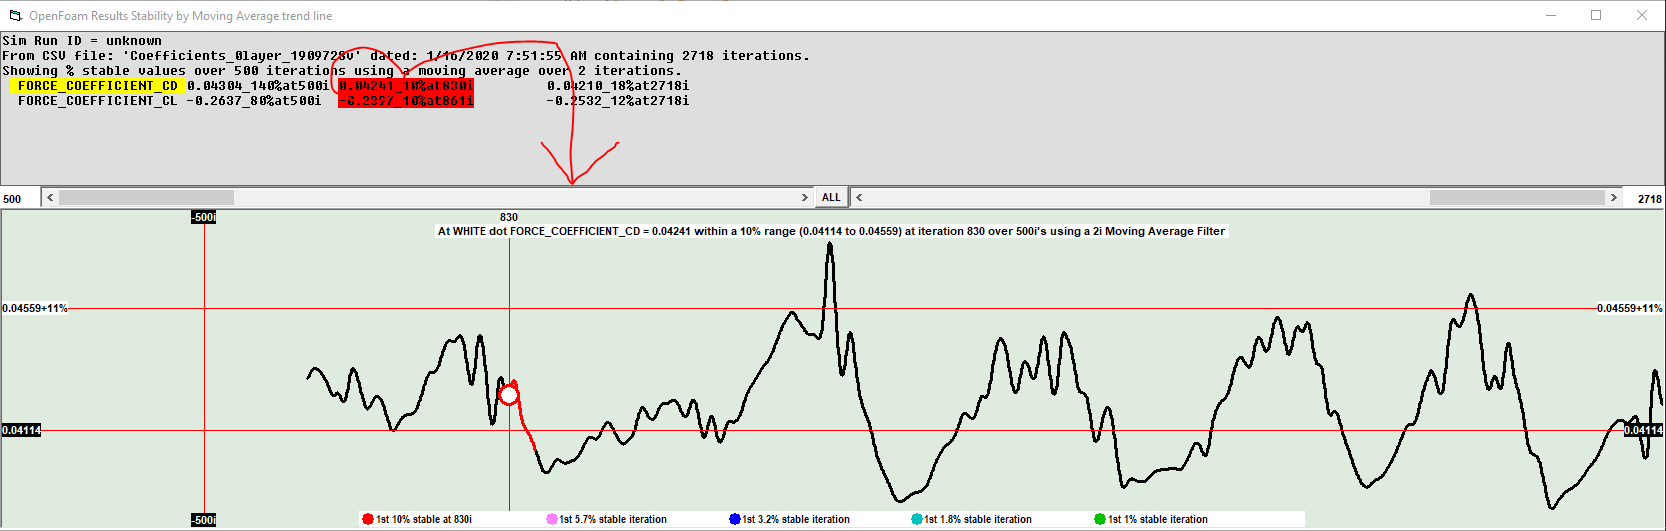
Your ‘dashed red pointers’ point to a section of iterations where, if you moved the white circle with a mouse to any red iteration, you would have between 10 and 5.7 ORSI %, like this:
.
.
.
.
EDIT: A further note on advanced ORSI by MA plot navigation… If you move your mouse off the left or right side of the plot (or bump the sides of the plot), the White Dot disappears and the now black ‘MA graph scaling lines’ bracket the data extent of the current section of MA line that is on the screen…