I am going to keep presenting all results of my 01357 layer testing, in this topic, as the results come in…
First I easily created a 1909728v 0 layer mesh with the exact mesh setup as 1 and 3 layer meshes… This should give a valid comparison of 0 vs 1 vs 3 layers…
Here is the ORSI values for that 2718 iteration run:
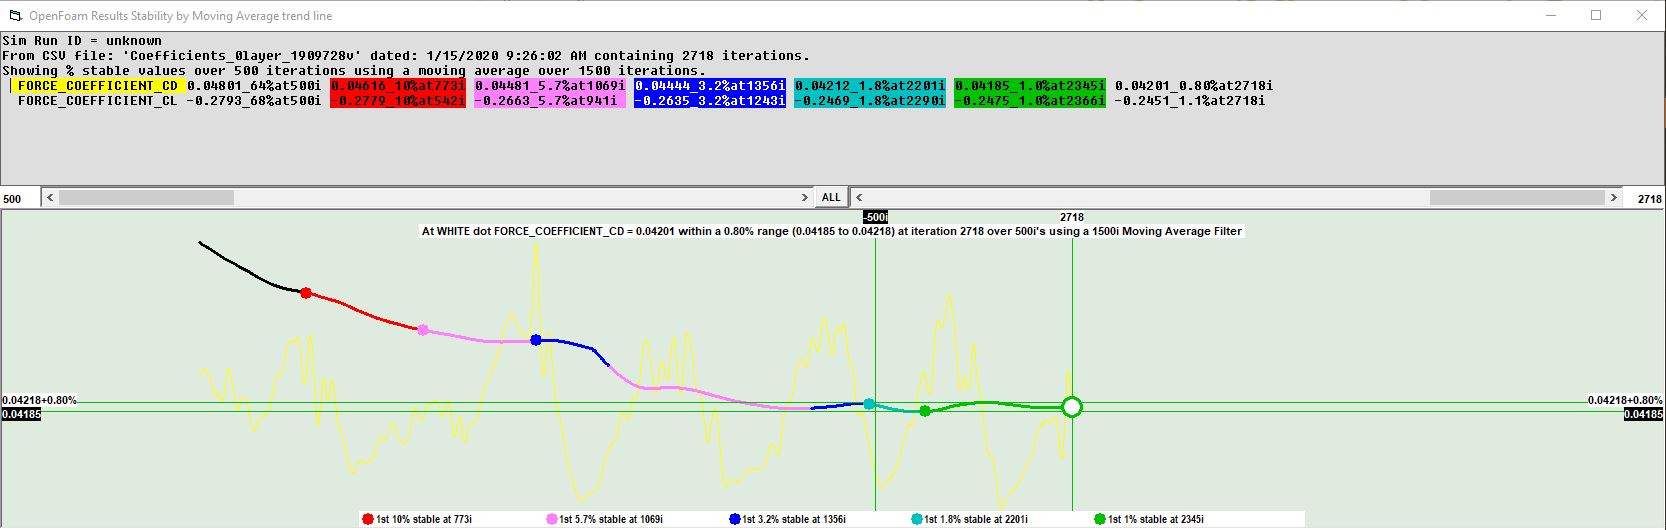
NOTE: Because the oscillations in the raw YELLOW result data from the solver log varied about 20% through just a single cycle in the last 500 iterations, I had to use a Moving Average iterations of 1500 in order to acceptably filter out the oscillations…
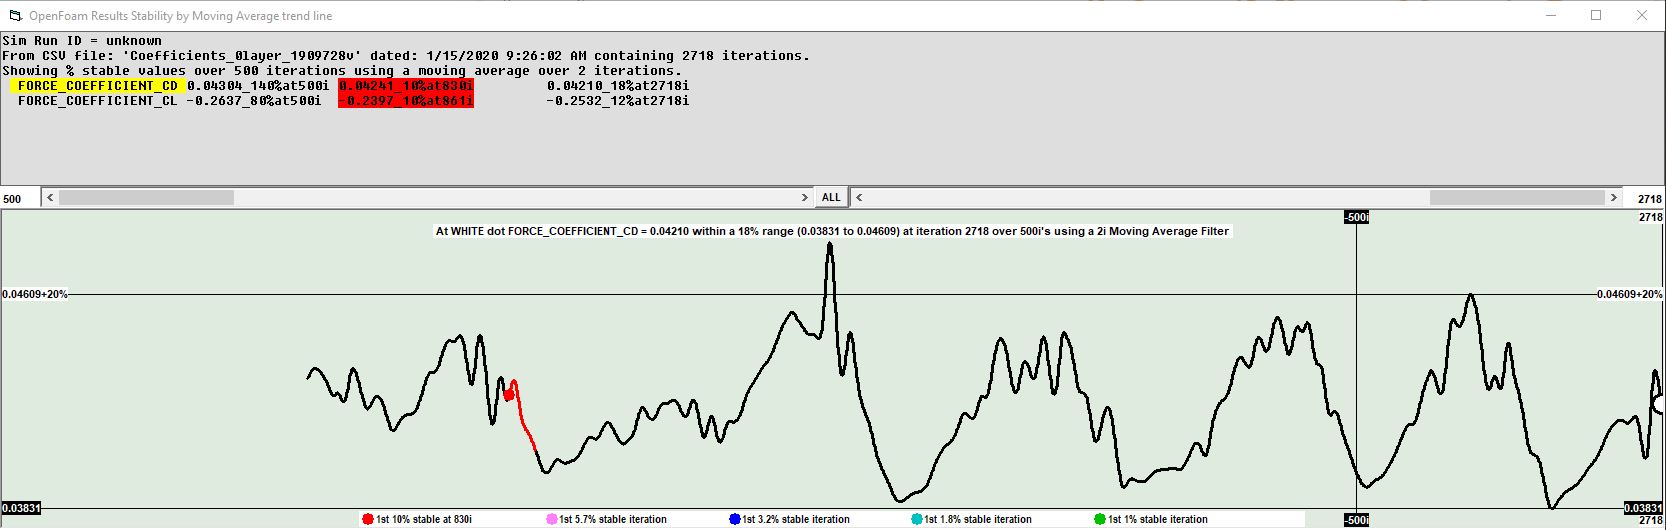
If we set the Moving Average iterations to 2, we can see that ~20% data range in this ORSI plot:
In any case, before I start having 3 and more images to cycle through to show the flow pattern changes between the various number of layers that I end up analyzing , I will simply look at the ORSI results for them in a table…
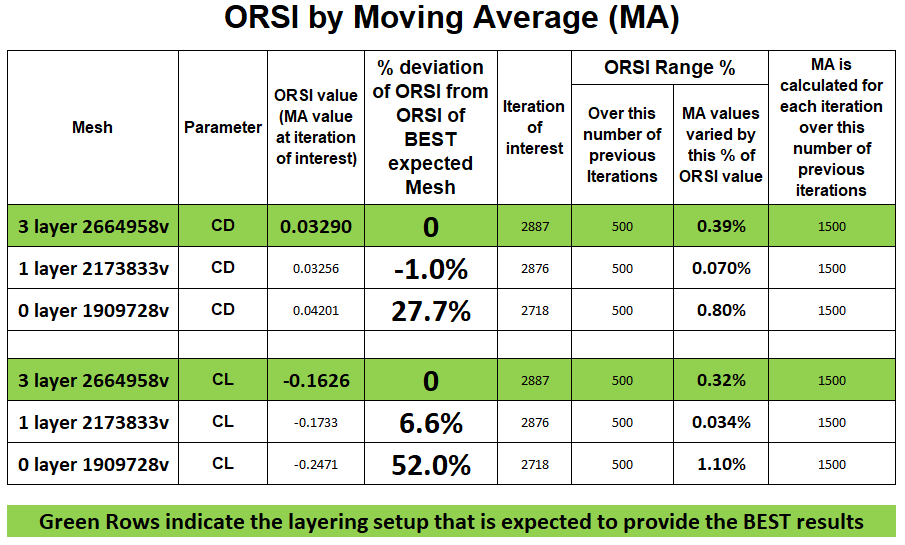
Here is the table so far for 0 vs 1 vs 3 layers:
.
.
So, when you consider how much of a difference in results there is when only a Single layer is added, I think 1 layer layering is back in the picture…
And according to my preliminary 5 layer mesh I think 1 layer be may even be more ‘in the game’ when I present that new table with a 5 layer mesh added (the 5 layer mesh should be expected to give better results than the 3 layer mesh, if I do it right)…
But to do a good 5 layer mesh on the geometry, I have to change the geometry a little and the refinements a little, so I will have to redo the whole series of meshes with the new geometry and refinements to have a valid table, but I think that is worthwhile here ![]()