Optimizing mesh quality and Y+ layer formation on an FSAE car

Your welcome, i fully get that talking though concepts with someone helps a lot, even if that someone (me) is just a dummy trying to understand haha.

NO your logic is undeniable Dale haha

1 Like

I got it! i was able to capture the bug when i ran the histogram again Here is the link again so u dont have to scroll up

ORSI and Y+ Histogram Instructions

I have also made this guide in google docs for the other members of the AERO team so they can learn your programs as well. With your permission I will teach them your ways. Feel free to edit anything in the doc, i left it so you can change the contents

The last line of the csv file is not complete, it contains only 10

image

I think you may have tried to make a histogram on a file that ParaView is not finished exporting yet, is that possible?

If so, I will try to figure out a graceful way of informing you the file is not complete yet …

I can not believe how long it takes ParaView to export these larger csv file :frowning:

PS Your link took me to my dropbox, I had to scroll up to post 301 to get your dropbox…

oh sorry, yes the file was taken from an incomplete csv file. it did work however when it wasnt complete, i just had to re click the yPlus_area. Maybe for the error i just happened to click when the line was not finished as shown in your picture above

1 Like

So, my strategy for today changed to doing a 01234 Layer Test Project

I have 6 hours of effort in this project so far.

I simplified the CAD geometry a little and then began layering it…

I decided that 5 layers was going to be too hard to achieve on this geometry for a 3.9 mm 1st layer and a 1.2 ER…

I did achieve 1 to 4 layers with 3.9mm 1st layer and 1.2ER and the ONLY change when I meshed each was in the Layering Refinement for each mesh… This ensured that the meshes were very similar with regard to everything but the number of layers and the total thickness of all prism cells…

Since the layer expansion ratio was a constant value of 1.2, the result was that the total thickness of the sum of the prism cell layers increased with each layer added… In doing this I believe I was investigating how important it is to encompass the near surface BL area using prism cells…

From 1 to 4 layers the total thickness of all prism layers increased from 3.9mm to 21mm…

Here are the results:

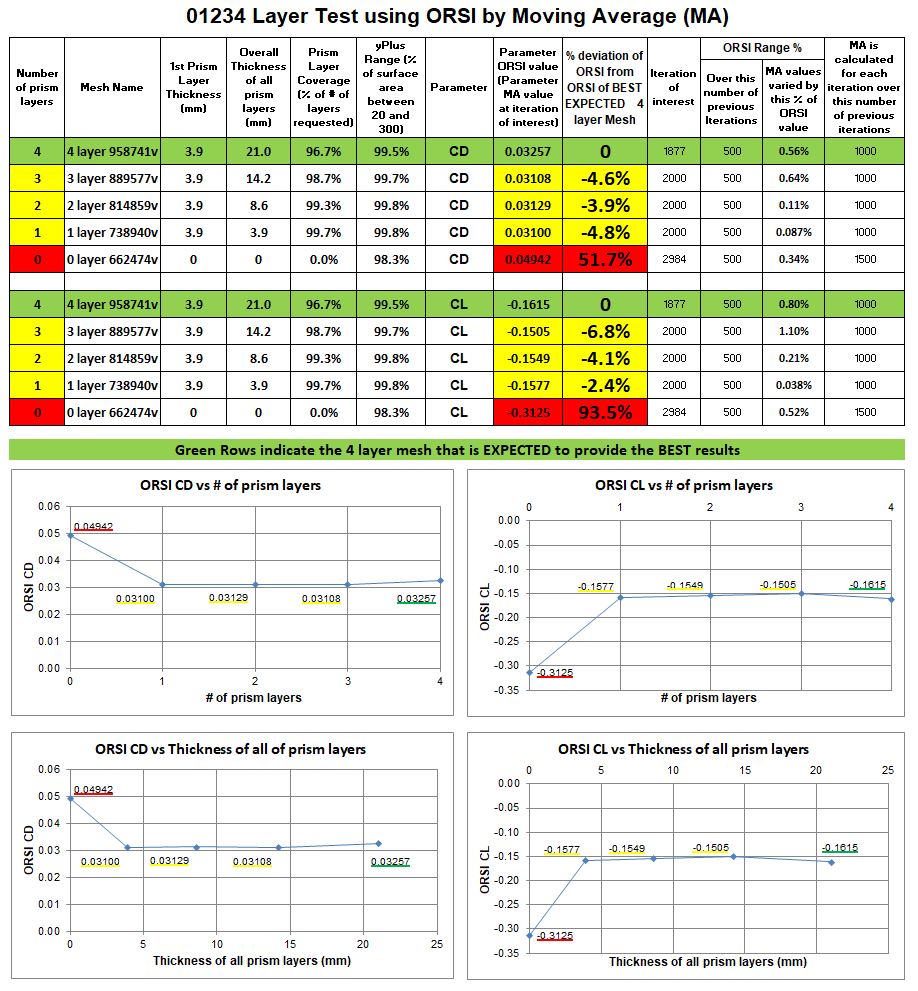
Soooo, if the project holds up to scrutiny, my findings are that I am unable to determine any converging results relationship in using a larger number of prism layers or a larger Total thickness of the Prism cells…

The only conclusion I think I can make is that 1,2,3 or 4 layers are all equally expected to give better results than 0 layers (this assumes that prism cells indeed are needed for more accurate results, since the 0 layer mesh still had 98.3% of the surface area in the yPlus 20-300 range and the solvers do some no-slip wall calculations when there are 0 layers :wink: )…

Any comments out there :question: (please scrutinize my project and conclusions thoroughly…)

That is really handy, thanks.

I did make some edits… I did not see a save button…

Main changes were in where to extract the setup files from the zip file and what happens after you run the setup.exe… You might want to follow my instructions and get new screenshots…

Thanks for the feedback. Google docs is all online so no saving, it does that itself every few seconds. Thats why i like it, i can just sign into my google drive and access it from any computer, and with the link anyone else can view or edit. I will add any extra screenshots from the steps you put in.

First of all , some great work.

Since I am a fan of the 1 layer approach, mainly due to its ability to play nice with my geometry, i have here shown your percent difference from the 4 layer run in numerical form.

Difference of 4 layer to 1 layer
Cd - 0.00156
Cl - 0.0039

To me this seems to be a very minuscule difference considering the level of accuracy you have already achieved. You already have all 4 test with Y+ values at 99% inside of the log-law region. So to me, what the increasing layers are testing is the area starting at the log-law region (around Y+=300) and seeing if the transition from turbulent boundary layer to normal velocity is effecting the Cl or Cd through the extra layers capturing these regions. It seems like it does to some extent, but as you said there is no direct correlation between the increase in layers and increase or decrease of measured Cl or CD.

Therefore, would this be proof that the HEX cells are capable of accurately capturing this transition data accurately enough that a 1 layer BL is justified?

I would also like to know how this test would go for a complex geometry such as mine. Would the much larger amount of turbulent areas create a positive correlation between # of prism layers and CL and CD?

I only ask this because the single wing test does have a turbulent section, but in a large geometry, the amount of turbulence in so many different areas could possibly help to make this test more definitive. However i think a 4 layer, 21mm boundary layer might cause some mesh problems haha.

I also have the results from the half car sim. I unfortunately forgot to increase the maximum run time so it canceled around 1500 iterations. However it did achieve a 1% stability region so i know a 2000 iteration run will be ok

Here is the link if you want to take a look. here

GREAT, now we see here that ORSI CD (500i500mai) at last iteration is 0.2188:
tmp

Now we zoom in on CD SimScale Plot and find the first previous iteration from the last, that has CD very close to 0.2188:

Then, all that is left (if you really want the best full set of data solution that matches ORSI) is to full re-run that sim run to end iteration of 1521 and voila, you have a final iteration full set of results at (or very close) to the ORSI CD 0.2188 value :slight_smile: (And at that point I am pretty darn sure we are presenting the best guess of the solvers for that sim setup, at that ORSI % stability :slight_smile: )

Nice. Thanks for explaining all that, but why are we making our new final iteration, that would give us the visual output (solutions field results) at this final value of 0.2187 at iteration 1521?

Wouldnt it be better to use a final iteration that is even closer to the ORSI %. which is found by moving the slider to the lowest % difference. In the next picture it shows 0.90% range at iteration 1538 at Cd = 0.2190. Im not saying that 0.03% is such a big difference but maybe in future simulations there will be a bigger jump and the visual data will be that much more accurate.

Because, that is the ORSI value that is the solvers best guess, we should present the full solution set of data that would integrate the viscous and pressure drag on all the geometry surface faces to the same value as ORSI is…

Actually at 4 significant digits it is 0.2188, not 0.2187 :wink:

If you just take the full set solution data at the last iteration at it would integrate in ParaView to CD of 0.2175 as you see here:

Which is 0.6% different in this case (you were lucky, on data that oscillates more we have seen that it could be 5-10% off)…

I am using the ORSI at 1558 0.93% but we have to look back to find an iteration that matches our best ORSI % stable, which is 1521.

Splitting hairs you could use 1538 0.90%, but I am sure that last iteration 0.93% is fine and easier to understand as a procedure, and there is an argument that can be made that the last iteration ORSI at high MA iterations is always the best guess of that sim run.

Also, I really want to stay close to that last iteration for scrutiny purposes (that goes for how MUCH earlier we find a close iteration, I would rather choose a close iteration at 0.2189 than a further away iteration at 0.2188) :wink:

As far as my ‘at high MA iterations’ edit I made above goes… My procedure for determining how large a MA iteration value to use, is currently, that the MA line (non-yellow line) should be horizontal at the end of it, if the MA line is not stable (horizontal) at the end, then you should lower the MA iteration value or run the sim to more iterations… The MA iterations value determines how well oscillations are filtered out of the data.

ok great! now the procedure is official! How do you feel about me still using 1 BL layer at 3.4mm? Should i do your 0,1,2,3,4 layer test on the full car? I would exclude 0 layers though.

Yes, you noticed that 1 layer is back in the game :slight_smile:

I think my post #334 describing my 01234 test should be sufficient justification for you to use 1 layer (unless someone finds a hole in my project)…

awesome. Now i have a lot of work to do (as always) getting the final geometry ready. Im going to try the next run with meshing the actual radiator. Well see how that goes. I dont think i need a BL refinement on it though what are your thoughts? i still have to clean it up a bit and remove the inlet and outlet tubes.

After the radiator sim run ill add a rotating fan as an exhaust

Actually a 1 layer BL should mesh on most anything that has sufficient gap, worth a try, even low % layered with 1 layer is better than no layer (it appears so)… We are on new ground here :wink:

Not sure if 1 layer test works on full resolution y+1 meshes, maybe another test is needed :wink:

A 1 layer y+1 mesh would likely easily mesh those radiator holes…

EDIT: another benefit of 1 layer meshes is that they have very low illegal cells…

Yea the zig-zag mesh is 0.2mm so i could just apply the appropriate surface refinement and use the calculator for a Y+=1 first cell size. Ill post what happens

Looks like you are squished for time, so the standard approach would be no layering, but I see level 13 or 14 coming here regardless, I doubt you will have much luck with that if you want to add it to the car mesh…

I just noticed on your latest full car mesh and sim setup, I think you should add an ‘Active Tunnel’ cartesian box sized and refined like in my 01234 test… it presents the inflow to the car and resolves the downstrean wake much better and does not add t too many cells…

I am exporting from ParaView the yplus csv file right now for that sim run, I just remembered how I determine when ParaView is done exporting, I just open a Task Manager and wait until that ParaView windows stops showing as ‘Not Responding’ :wink: