XFLR5 vs CFD

:boom::boom::boom::boom: EDIT NOTE: All of my discussion about yPlus ranging issues is this thread were basically caused by me being a newbie and trying to view the yPlus range on a 1s simulation. It was not until Post 28 that I realized that to see relevant yPlus ranges you have to look at them at the end of a converged simulation. Once I realized this everthing fell into place and I was able to present much better layered data that included more precise viscous boundary layer drag in Post 31. If you are looking for just my results you can skip to them at Post 31. Anyone who wants to follow the journey should keep reading… :slight_smile:

:boom::boom::boom::boom: EDIT: 18Sep2018, after Post 31, I conducted a Mesh Independence Study (MIS) to make sure I was using a meshing that should provide quality CFD results for simulations that are run at the correct parameters that the mesh was designed for. Here is that MIS at Post 79. To obtain those MIS results, I came up with the fact that a ~2.5 million cells mesh should be adequate for the comparison, but unfortunately I have not yet re-run the comparison with that mesh. When I have time to do that I will add a post with those results :slight_smile:

Before I can feel comfortable using CFD for aerodynamic analysis I have to make sure that I can use CFD in a way that provides usable Forces and Moments for real world situations.

I have been using XFLR5 which is an analysis tool for airfoils, wings and planes operating at low Reynolds Numbers. It includes:

  • XFoil’s Direct and Inverse analysis capabilities
  • Wing design and analysis capabilities based on the Lifiting Line Theory, on the Vortex Lattice Method, and on a 3D Panel Method

Like any complicated program, the results you get are as good as your understanding and your use of the program but in XFLR5 I did a very straightforward VLM1 analysis on a multi-taper wing. XFLR5 seems to analyse wings of this nature very well and is a very commonly used program.

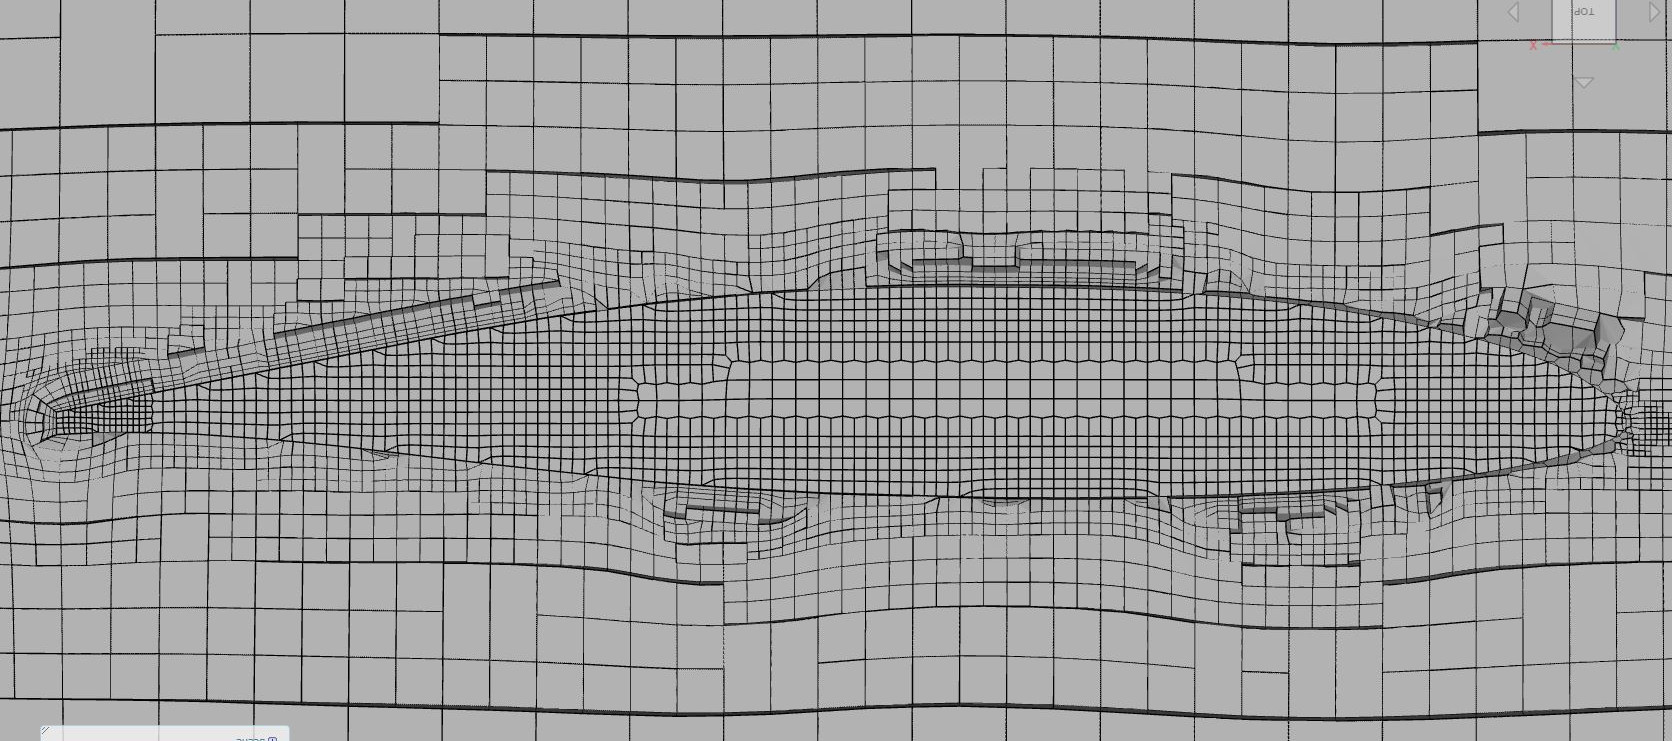
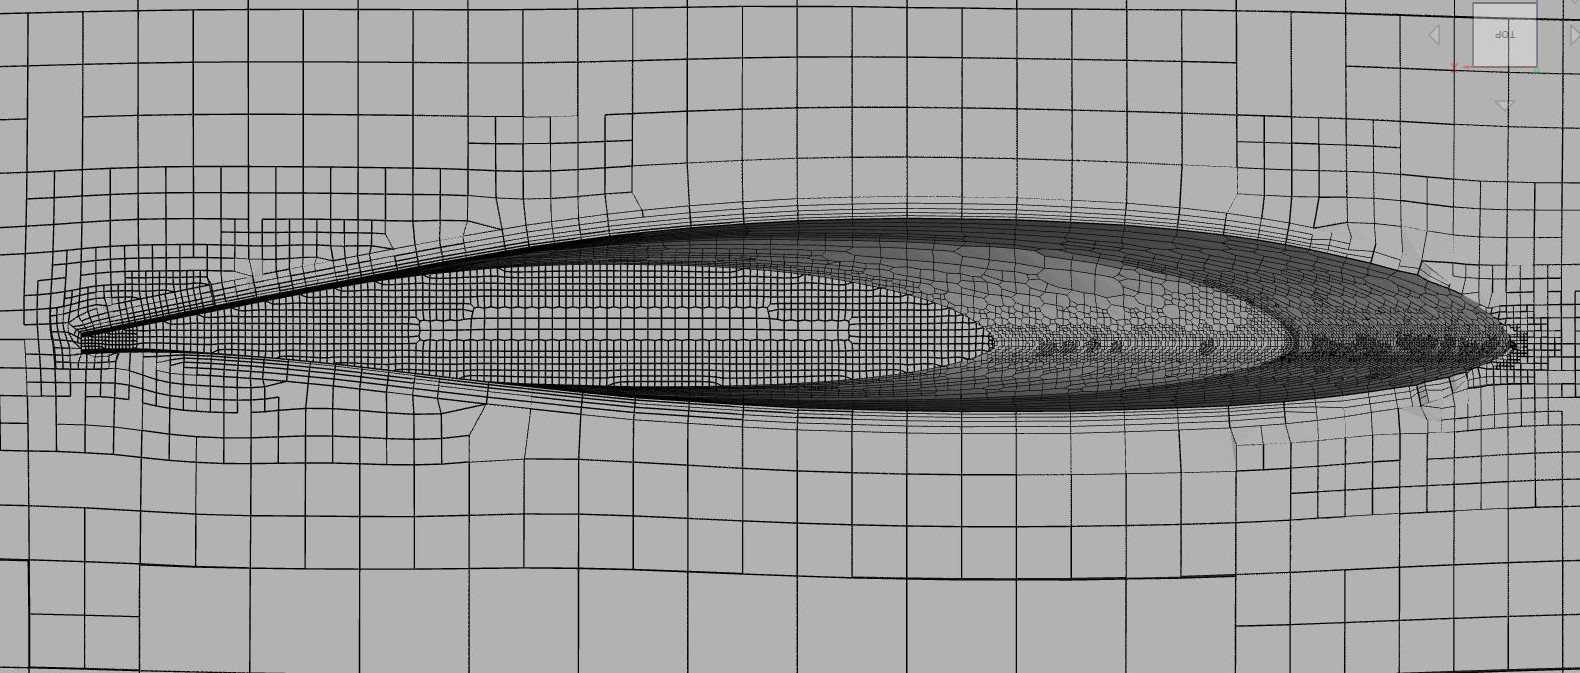
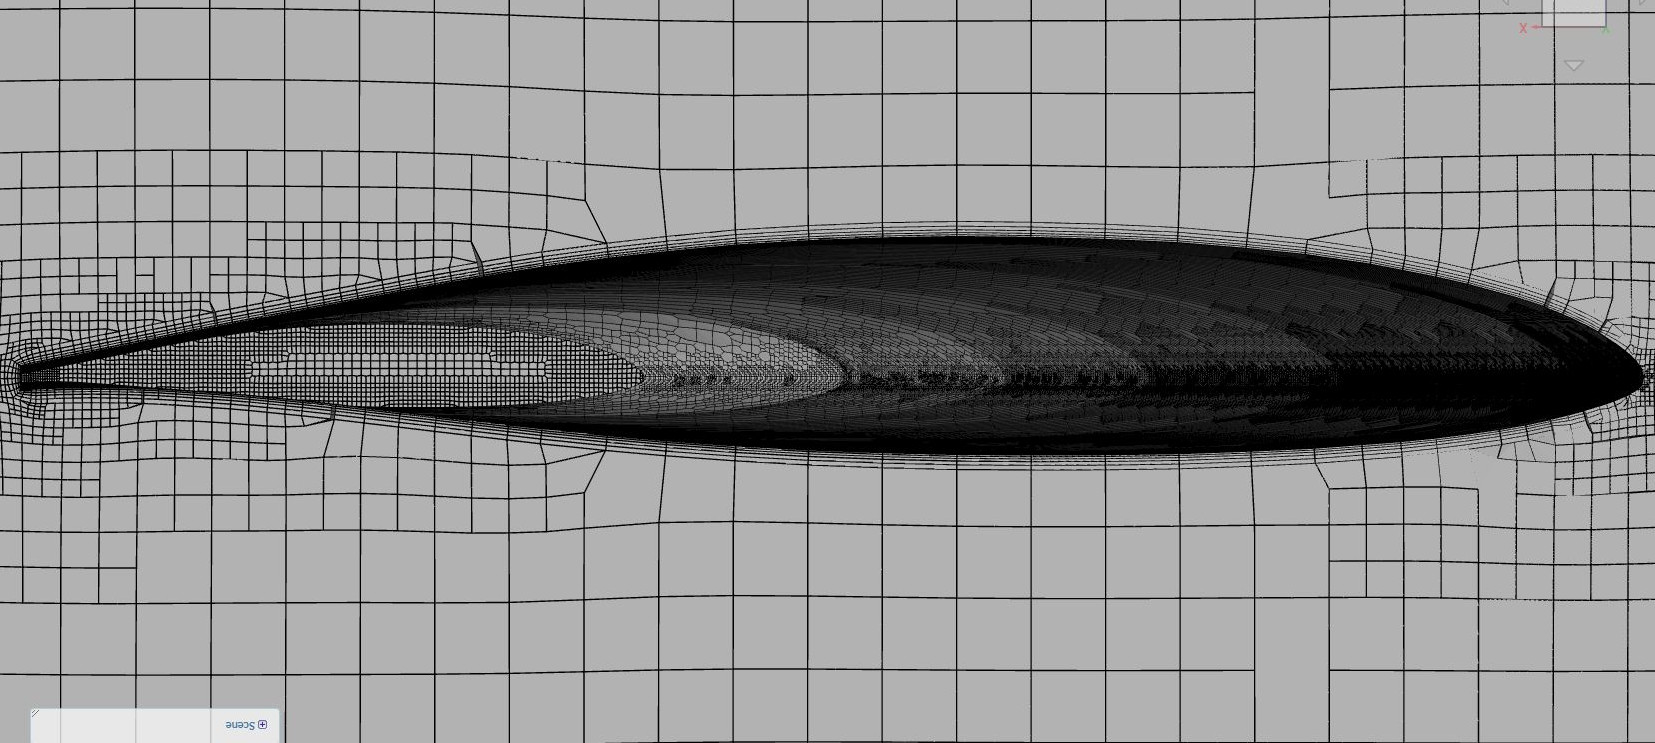
I then duplicated that wing geometry in Rhino and created the below linked public project. I have what I think is a pretty good 11 million face mesh that includes boundary layer. I ran a simulation and I am still disappointed in the results. I am hoping someone can help me set up my CFD project so I get results that are more in comparison to XFLR5’s (if someone wants the XFLR5 project I would be happy to share that too).

Please NOTE that the CFD simulation ended with an error but the Force and Coefficient Plots stop at ~250s and are very stable before 250s. The Convergence Plot stops at ~90s but ‘looks like’ it would converge at or before 250s. I then assumed the results were close enough for an initial comparison (maybe a bad assumption :slight_smile: )

Here are the results:

The main difference is the drag coefficient but Cl and Cm could be better.

First off I have a few questions:

  1. Why does the CFD ratio of Cl/Cd not equal the same ratio as Lift force/Drag force? EDIT: Answer is, well they WERE different until I figured out that I needed to add Viscous Forces to the Pressure Forces and then fixed the chart :smile:
  2. What is most likely the cause of that BIG difference between Cd’s?
  3. Why did the CFD simulation complete with an error?

I suspect that CFD uses different areas for Cl and Cd calculations, whereas I think it is most widely used in aircraft analysis that wing area is used as the reference for both Cl and Cd. I wish that whenever Cl and Cd numbers are quoted, that their area method also be displayed (especially cross discipline programs HINT HINT :wink: ) .

Project is: [MainWingOnlyXFLR5][Deleted by author]

EDIT: This is the Current Project Relating to this topic. At Post 31 is the current projects comparison chart.

Any help in the right direction would be appreciated…

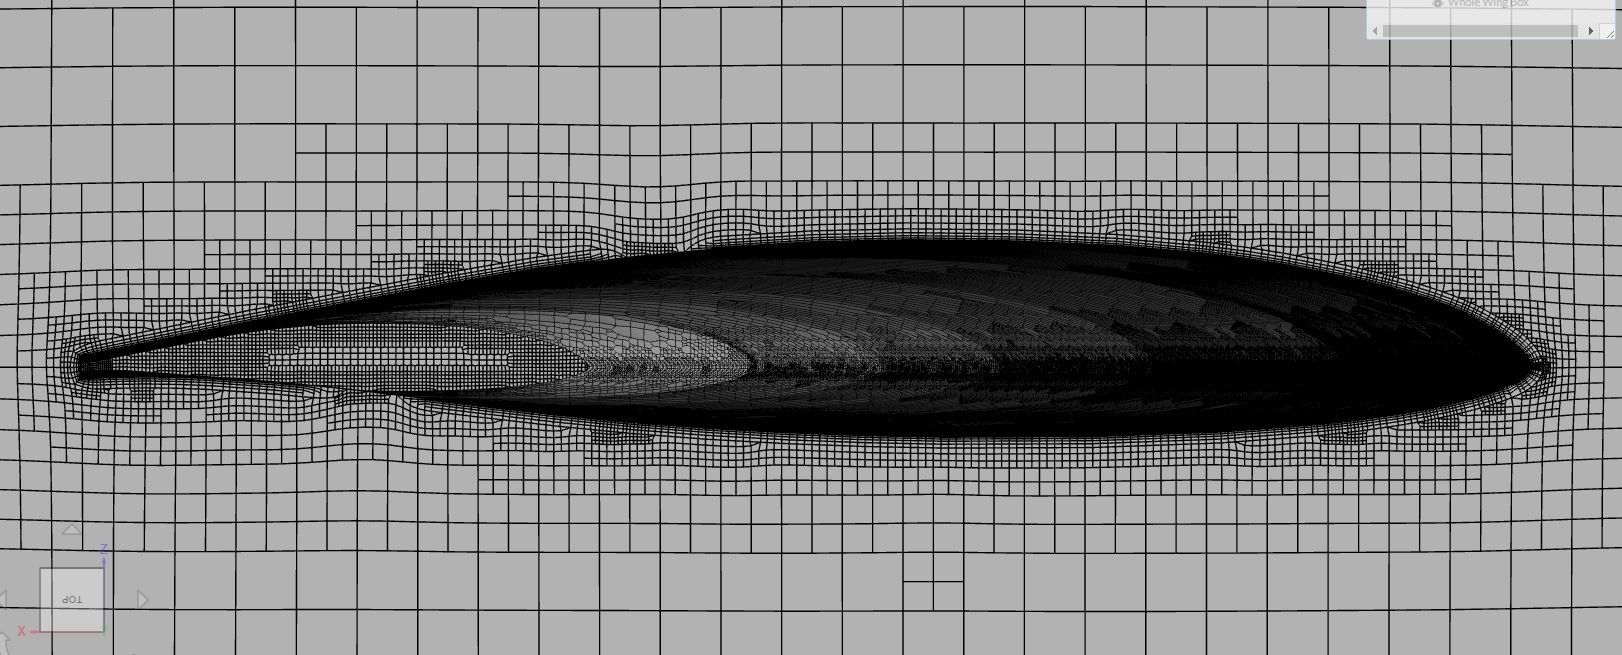
EDIT: I decided to remove the layered Boundary Condition and got a 6 million face mesh that ran to completion in a simulation (interestingly at about 250s), here are the results:

Interesting that without the layered Boundary condition the results are closer to XFLR5.

I guess it is just boiling down to the Cd reference area.

I am really concerned that Lift Force/Drag Force is SO different than XFLR5 Cl/Cd which I do not think can be explained away by coefficient reference area differences. This maybe why, since I began using XFLR5, I have always seem to experience higher drag in real life than what XFLR5 predicted and a good reason to move to CFD…

I guess other questions now are:

  1. Which CFD case is closer to reality?
  2. The layered mesh seems to give reduced Lift and increased Drag, do their actual values seem reasonable?
  3. If CFD results really are closer to reality, why is good old XFLR5 Lift/Drag ratio so far off?
  4. Can someone confirm that the reference area for Cd in simscale CFD is frontal area? Edit : No it is using the same reference area as Cl and is the user inputted Reference Area in Results ‘Force and Moment Coefficients’ parameter table… too bad for the CAR GUYS who likely want frontal area for Cd and downforce wing area for Cl (just speculating on that one) :slight_smile:

Dale

P.S. For those that follow in my footsteps, I am EDITING this post with answers as I find them until someone else chimes in and then I will likely start replying separately

4 Likes

Hi @DaleKramer!

First of all big props to your engagement since you are part of the SimScale community, really love it :slight_smile:

For this study we definitely need some time to get through all your points you mentioned. I am tagging @yosukegb4, @Get_Barried as well as @vgon_alves here who might give you some first impetus on your studies - I will follow up.

P.S.: Information from the XFLR5 page: “XFLR5 is by no means a professional product, and does not offer the same guarantees of robustness, reliability, precision or product support than commercial softwares.”

Best,

Jousef

Thanks Jousef…

:slight_smile: Precisely why I am here…

NO, I no longer think that Simscale is using frontal area for Cd!!!

I say that because it looks like the coefficients are determined with this Openfoam code (note that both coeffs[0] and coeffs[1] use that same Aref variable):

coeffs[0] = (totForce & liftDir_)/(Aref_*pDyn);
coeffs[1] = (totForce & dragDir_)/(Aref_*pDyn);
coeffs[2] = (totMoment & pitchAxis_)/(Aref_*lRef_*pDyn);

scalar Cl = sum(coeffs[0]);
scalar Cd = sum(coeffs[1]);
scalar Cm = sum(coeffs[2]);

scalar Clf = Cl/2.0 + Cm;
scalar Clr = Cl/2.0 - Cm;

And the Openfoam results in the Solver Log are (no boundary layer case):

ExecutionTime = 117.34 s  ClockTime = 127 s
SIMPLE solution converged in 239 iterations
forces forces10 output:
    sum of forces:
        pressure : (18403.0087721 -5.75163626308e-05 230589.781182)
        viscous  : (403.110911194 -0.0165566590641 -8.09310453274)
        porous   : (0 0 0)
    sum of moments:
        pressure : (1814.74400605 -4870667.68499 -78.5868128624)
        viscous  : (-6.75661079217 446.192159703 -38.8502471616)
        porous   : (0 0 0)
forceCoeffs forceCoeffs11 output:
    Cm    = -0.179828952378
    Cd    = 0.0209292345432
    Cl    = 0.256613182964
    Cl(f) = -0.0515223608965
    Cl(r) = 0.30813554386
End

For anyone interested, the forces and moments can be converted to lbs and in-lbs by dividing by the Universal Gravity Constant 386.0885827 in/sec^2.

Aha, I finally found a quick easy way to get access to the Forces and Coefficients, in the Solver Log :smile:

Again, I DO NOT THINK it is frontal area anymore since Openfoam is showing the Cd as 0.02093 , which is in my chart.

But this Cd is SO high compared to XFLR5… the quest continues…

Still looking for answers on 3, 4, 5 and 6 :wink:

1 Like

@DaleKramer, if the drag changes significantly when you remove the layers then you should probably check Y+ values. Ideally, for wall modelling, they should be between 30 and 300. I don’t know if XFLR is capable of accurate boundary layer prediction, it would be really nice to get some experimental data in here also, that way we know how each of the compare to experimental.

Looking forward to your thoughts :slight_smile:
Darren

1 Like

Darren @1318980 ,

InflateParameters

  1. Can you tell me which parameter is Y+ ?

  2. Also, do you mean if the PRESSURE drag changes considerably…

  3. By considerably, what percentage difference would you consider considerably?

        Layered Pressure Drag is 45.20 lbs and Viscous Drag is 16.48 lbs
    NON-Layered Pressure Drag is 47.66 lbs and Viscous Drag is 1.040 lbs
    

I do not think XFLR5 analyses boundary layer (I will confirm), that was another reason for me to do two meshes in CFD.

@1318980

Also, I am having difficulty with Y+, perhaps you can have a look at this topic.

Here is the current boundary layer mesh on this topics 12mm thick trailing edge:

Thanks, Dale

Hi @DaleKramer, the Y+ field can be added in the result controls in the simulation, I would expect to say up to 20% difference unless the Y+ is drastically off. I checked your topic, can you share the link to it? you might need to do to things:

  • node Y+ (Point data rather than cell data).
  • View the results as a surface.

If you share your project I can make sure we can do this online, otherwise, we might need to download the results.

Cheers,
Darren

I don’t seem to be able to figure out an answer to my questions 1 and 2 above

I sent you an invite to the other topics private project.

Correct Y+ is hard to achieve, you need a mesh to measure y+ then you need to alter the wall inflation in response to your Y+ results. Y+ is the dimensionless wall distance.

If the wall layers are altered significantly to be in the correct and incorrect range, then we can expect both the viscous and pressure drag to change, this is because the thicker boundary layer the more the pressure difference in front and behind will be, and the viscous drag will also change.

Best,
Darren

@1318980

  1. Can someone tell me where I can find a project that has a saved state in its post-processor results section that shows how to actually see the Y+ parameter, I have only got a saved state in this project that shows the 5 boundary layers created

OR

  1. Or could someone create a saved state in a copy of this topics project and send me a link so I can do the same in my project?

I guess I will see what you mean about correct and incorrect range after I can see Y+.

So, in the case of my 2 cases, Layered and NOT Layered the total Pressure and Vicious Drag is 26% higher for the Layered case and I really need to adjust my Expansion Ratio.

  1. Are we really trying to end up with the same total Pressure and Viscous Drag for both the Layered case and the NOT Layered Case or am I still confused? EDIT: or once we get Y+ in the correct range we just have what we have and it is irrelevant that the drag changed. I guess your >20% just tells for sure have to look at Y+ and correct if needed. I assume that in any case you should look at Y+…

I found out I could just map the yPlus [point data] directly on the surface of the results faces (turning internal mesh and bounding boxes off on its Property Panel). Then I just adjusted the scale to show a good range (the auto range was a max of ~18 which made the whole wing in the blue range).

Here are the yPlus values for the Bottom and Top of the wing:

The average is probably just around 1.0. It seems yPlus is directly related to the total thickness of the 5 layers created.

  1. To increase that to 30, would I just change expansion ratio to 1.3 times the 5th root of (30/1.0) or 2.57?
  2. Or should I try to get that to 160 (~halfway between 30 and 300) which would take an expansion ratio of 3.59?
  3. Why does the yPlus go smaller at the spanwise panel joints, is that because there are smaller mesh sizes there.
  4. If so, why would smaller mesh sizes mean a thinner boundary layer? Intuitively I would not think boundary layer thickness had anything to do with mesh size, more with pressure and air speed at the location on the surface…

Hi @DaleKramer, Good questions, I’ll go from the top.

Changing the expansion ratio would help, remember the final thickness is defined, and Y+ is calculated as distance to the first cell, so remember when calculating to account for this.

Yes, it would make more sense to stick it in the middle of the range not coming too close to either recommended boundary, in reality however, it will be a case of adjusting to ensure the maximum number of cells are in the range but might be unrealistic to manage to get them all in the range.

Yes exactly.

We are not measuring boundary layer thickness, we are measuring the dimensionless wall distance of the first cell, the thinner the cell, the lower the number. Because the mesher is set as default to use relative sizing, a smaller cell with layers will have thinner layers than a larger one. This can be changed by clicking on your mesh operation if using hex-dominant parametric. You are right though that the Y+ value will also change with the boundary layer. So Y+ at an aerofoil leading edge will be hard to get in the range when we are trying hard to get the range of the rest of the surface within 30 and 300.

Hope this helps,
Darren

1 Like

This is very confusing, I tried an expansion ratio of 3.57 and got very strange results.

The 5 layers clearly seen near the geometry surface using expansion ratio 1.3 are totally missing at expansion ratio 3.57 AND the average yPlus only increased to about 17, not 160 as expected.

Here are the mappings that show this:


I really don’t feel comfortable using the expansion ratio 3.57 mesh since I don’t ‘see’ the 5 layers at the geometry surface anymore.

I think I will bite the bullet and try the Hex Dominant Parametric Alogrithm.

Anybody else have any ideas at this point?

Thanks,
Dale

But I had the impression that these ‘layers’ we add to the mesh was the region where the speed of the air particles changed from 0 at the no-slip surface right up to the local freestream speed based on some rate of change curve set by the turbulence model, sort of like the boundary layer…

True, and the distance from the surface to the dimensionless distance to the first layer from the surface is the Y+ value you are observing here. However, wall modelling is only valid in the log region of the boundary layer, which is why, it is recommended to get the value between 30 and 300, as here the boundary layer is extremely predictable. bellow 30 there is the buffer layer and the linear layer, where if we fall in this region and model logarithmically it will be incorrect, likewise, as we start moving away from the wall above 300 there is increasing deviation from the log law. So the Y+ distance takes into account the distance to the first cell (Y) and the surface friction in relation to the U+ which is the dimensionless velocity, this is how wall modelling works. It works great as long as we obey its requirements.

Does that make sense? so in order to predict the correct conditions at the boundary of the first cell using a logarithmic relation we need to ensure the cell distance lies in that logarithmic region.

1 Like

It is clearer but still confusing, I am sure at some point I will have an AHA moment and feel comfortable with it.

I just can’t get a handle on why the overall thickness of these added layers vary with their original mesh cell size, the actual boundary layer doesn’t change thickness because some mesh algorithm decided that an area needs a finer mesh. But if you say the math works out regardless that these added layers vary in thickness over areas where the true boundary layer does not, then I believe you.

From what I can tell at this point, I want to try to get the yPlus value to average ~165 at the surface of the geometry. To determine a surface average, I can do surface mapping as in the above images and set a yPlus color range so that my eyeball tells me what the surface average is for the surface in view.

This seems very cumbersome, why can’t the postprocessor just let me select a surface (or my whole geometry) and then tell me what the yPlus, max, min, average, std deviation etc. values are for that surface?

I also assume I want the mesh slices in the mesh result to actually SHOW the 5 or x number of layers added in the layering process. So why are the mesh layers ‘missing’ in the middle image of my last 3 images (and actually it was over the whole wing as far as I can tell, not just near the trailing edge)?

Very good suggestion and I agree entirely. Please, can you add this suggestion into our vote for features part of the forum?

There are a lot of quality checking that goes on in snappy hex mesh, and it does take a bit of experimenting to get this correct. For example, the volume ratio of the two cells might be too high so the algorithm cancelled inflation, this could be solved by reducing the expansion ratio or by increasing the allowable volume ratio.

Counter-intuitively maybe, increasing the expansion ratio will actually reduce the Y+. This is because the algorithm is maintaining a final cell size and adjusting the lower ones to be thinner. A better method would be to just reduce the number of cells, and if this doesn’t work we could use full resolution modelling (better suited to smaller Y+ values of around 1).

1 Like

Done, as long as you will vote for it :wink:

Darren @1318980,

I have been working hard trying to get the best mesh to start with before I layer the wing.

I have started a new public project with what I have done so far.

There is one geometry and two meshes in the project so far but I am working on the project and may try a simulation soon.

Mesh 1 is just a refined geometry with 2.03 million faces.

Here is Mesh 1 near the wingtip (~12 in chord and 0.17 in TE thickness) :

The 3.02 million face Mesh 2 is my attempt at layering Mesh 1 with the following procedure.

I am using the ~12 in tip chord and 135mph in the yPlus calculator like this:
yPlusforXFLR5vsCFD

Then in a spreadsheet I have this:
ParaCalcsFromEWD

Then in Mesh Refinement Parameters for Inflation I did this:

Then I started clipping Mesh 2 to view the layers I added to Mesh 1. I am not sure if they are good enough and don’t know where to start to make them better. I do not see an ‘allowable volume ratio’ in the Parametric parameters and I am a little confused about your other suggestions.

Here are the mesh clips, first, right at the wingtip:

6 inches in from tip:

At 1/2 span:

And at the root:

Can you give me any specific pointers to refine the layers now so I can go on and make a 1s simulation to see if I got the average surface yPlus anywhere near the 160 that I want?

Thanks,
Dale

1 Like