I am working on improving the airflow of a part cooling fan duct for a 3d printer. I am now able to get fairly good results with the simulation. I have two minor issues, however.
First, when I add particle traces to the simulation run, they don’t seem to be retained in the system, so I need to re-add them every time I want to see the view. Is there a way to make this consistently sticky? I am fairly sure they have stayed under some circumstances, but definitely not consistently.
Second, after I first generate the run, it is essentially empty, but when I return to it later, there are cylindrical worm tracks that appear to be some version of the particle traces on one side of the simulation. I have no idea what they are representing, or how to hide them.
Cool visualization I have to say @acwest, well except the small “glitch”
I have forwarded this to our engineers who will have a look at this - have you tried post-processing your case in ParaView offline and see if this issue persists?
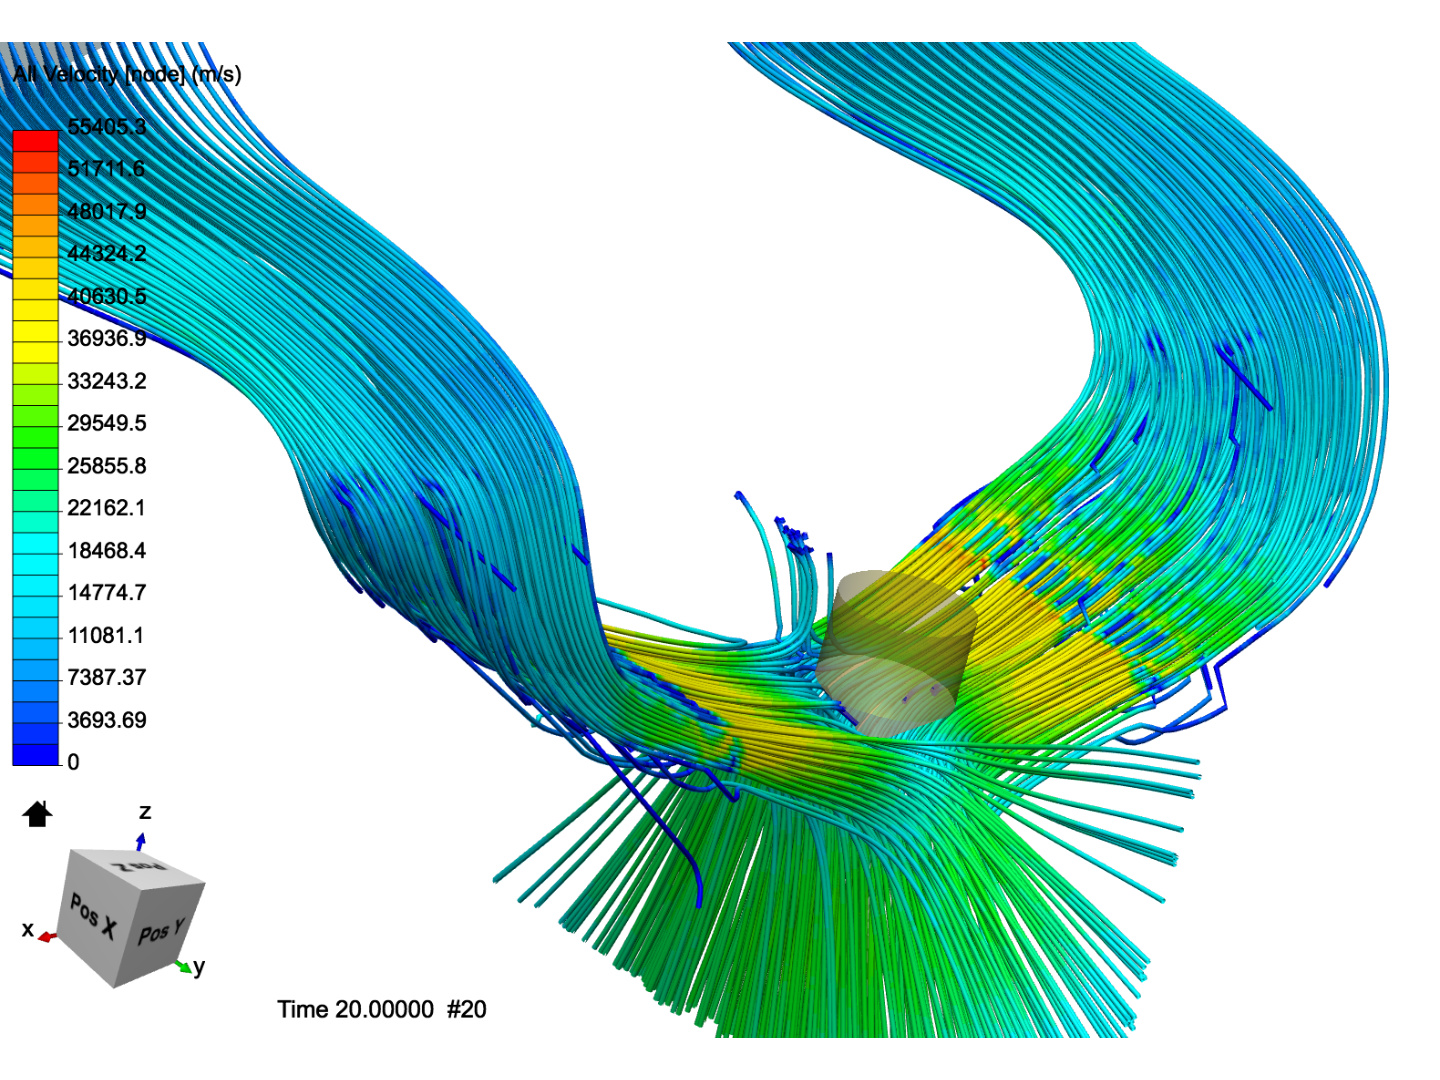
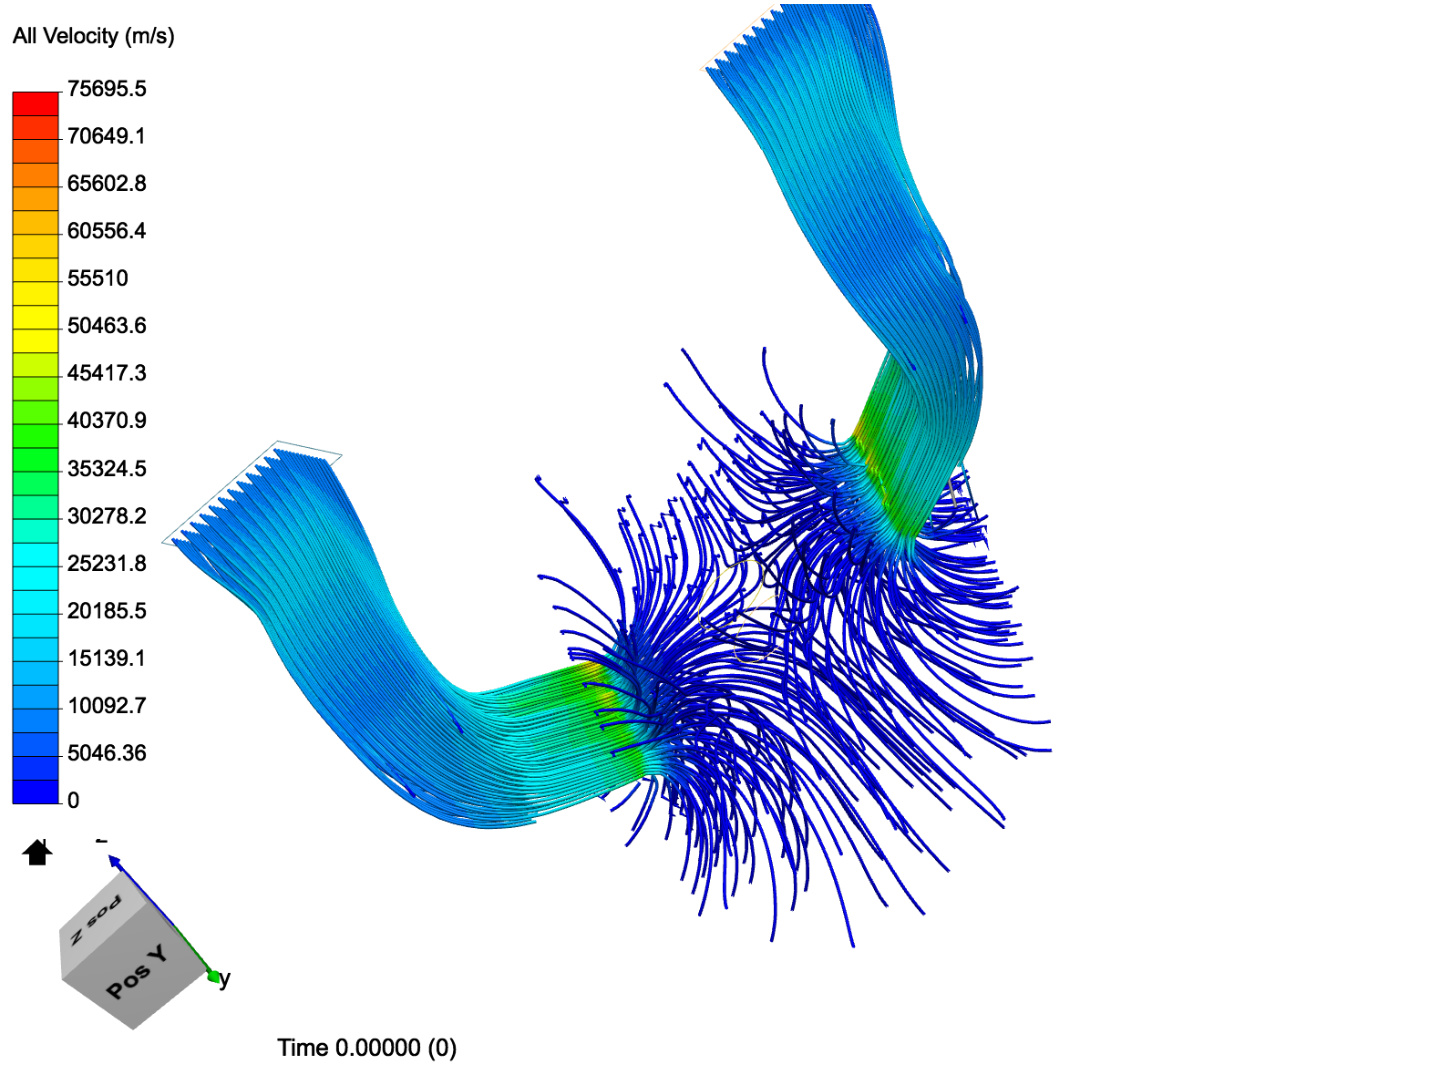
It looks like I have found another issue for them to look at. These two views are of exactly the same simulation run, viewed at two different times, with the same particle trace setup, I believe.
This is not an issue as when you are simulating any problem the system writes some data files, which is 20 in your case. This data file contains all the info about your the variables(velocity , pressure blah… blah…). As your system only ran for 20 iterations(which is very lowand writes for only 0th and 20th iteration), it will show a large difference in the value of these variables but suppose if you simulate it for 100 iterations(solution stabilizes), then you will get a much similar output for the 100th and 80th iteration.
I hope that makes some sense to you. Plz clarify if you have any issue in the above explanation.
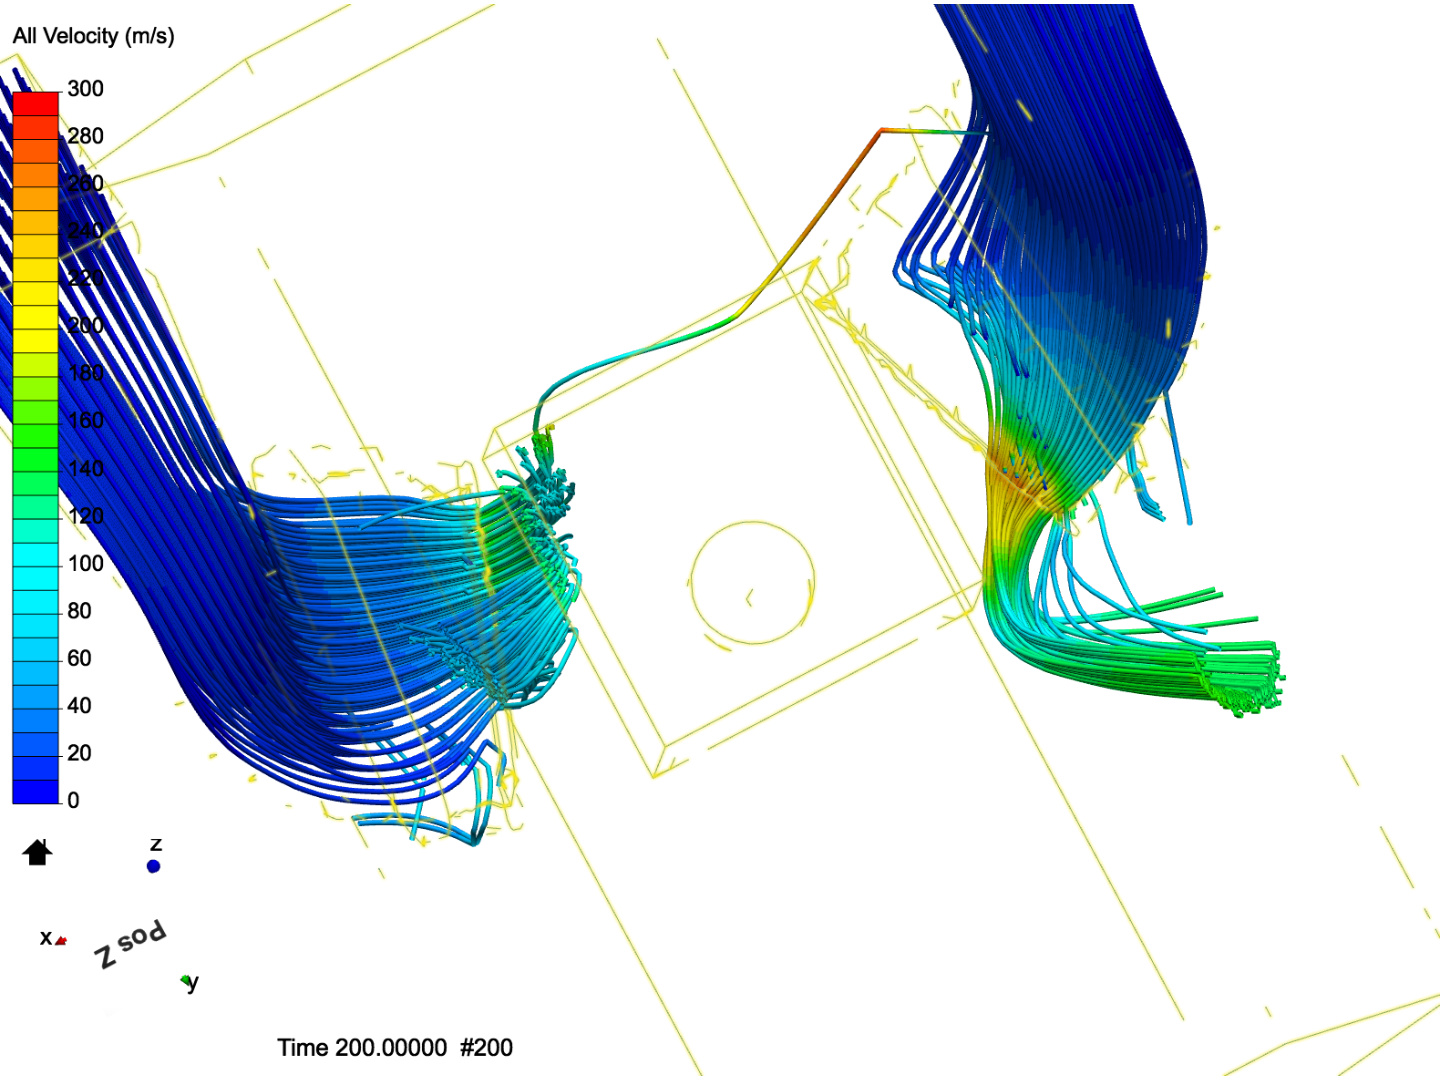
Hi @acwest: I suggest you check your simulation setup, as you should not have that velocity range (5 - 20 km/s). SimScale is tolerant to such a huge range, but practical results can be only useful for decorating your walls.
There is a problem, though. Now that I have fixed the units, I am getting some very unbelievable results.
The highest velocity in the system now is as the particles exit the side of the pressure outlet at the closest possible point. As far as I can tell, they shouldn’t be doing that…
There could be a mismatch between inlet velocity and outlet ‘capacity to evacuate’ that flow. Things go awry already after few seconds in your cooling zone… Check your assumptions about the outlet.
I haven’t had a chance to look over the numbers since I ran this, but the results seem wildly different than what I am getting with the actual physical part. Something isn’t right