Strange CFD results with velocity inlet and outlet

Hello,

For a CFD simulation, I have a setup with a velocity inlet (red arrow), see first image below. The air should pass through a funnel and into a wider space, where a sphere is located. As output, I’ve selected multiple faces as pressure outlet (blue arrows, 0 Pa). The simulation runs, but when I post process it, I have strange results in the section cut with areas grayed out (as can be seen in the image). Particle traces don’t work either.

This is what I’ve tried so far:

  • Input as velocity inlet;
  • Input as velocity outlet with a negative value;
  • Outputs as velocity inlet/outlet with positive and negative values, while having the input at 0 Pa;
  • Varied the input velocity between 0,02 and 10 m^3/s;
  • Added no-slip walls (see comment below);
  • Refined the mesh (see comment below).

I expect to see results more like the second image below. Anyone any idea what I am doing wrong?

Project: mustard blower

This is what I get:

While I’d want something like this:

Hi @tdijkstra,

You need set a no slip wall boundary condition. Currently its practically providing an air inlet to empty space as you have not defined your solid areas through the no slip wall boundary condition.

Outlet can remain at 0 Pa.

Cheers.

1 Like

Hi Get_Barried,

Thank you for your reply. As I was under the impression that undefined surfaces were automatically set as no-slip walls. Therefore, I removed them a while ago. However, I added them to the model and I am currently running the simulation again. If I have the results, I’ll get back!

T

Hi @Get_Barried,

I just reviewed the results, and unfortunately, I still get no results after including walls into the model. So any other ideas what might be going wrong?

T_D

Hi @tdijkstra: I suggest you ‘fix’ the standard mesh (TET) first:

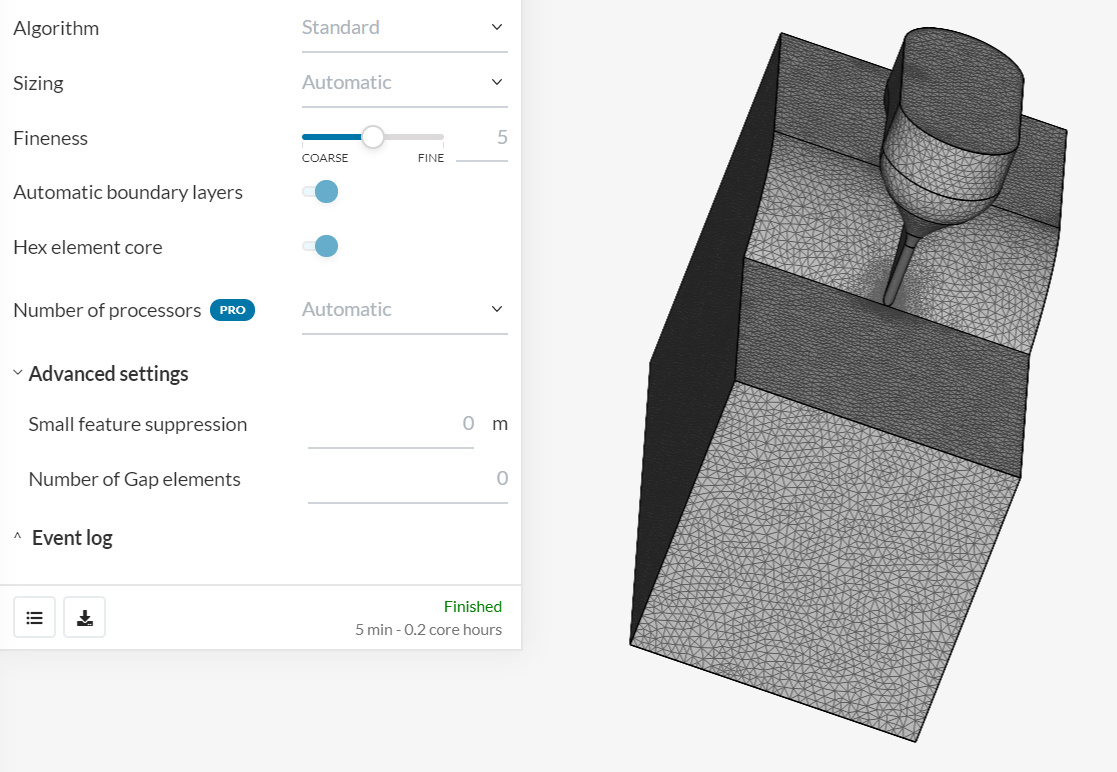
In Advanced setting , please define ‘Small features suppression’: in your case, it can be around 1 mm, but you can play with.

Without that, you well have enormous mesh ‘aspect ratios’, which, im my opinion, could break or bias simulation results. Aspect ratio should be checked after mesh generation in mesh log file:


volumeRatio
min: 1
max: 34954.23629327407
average: 1.5486799722615263
standard deviation 55.56276440660423
median: 1.2189308202415277
0-th percentile: 1
20-th percentile: 1.0319025396584673
40-th percentile: 1.1425157883165176
60-th percentile: 1.3175424311148078
80-th percentile: 1.5256157525109562
100-th percentile: 34954.23629327407

tetAspectRatio
min: 1.0000503472711673
max: 10859.151443709372
average: 1.6894976629197729
standard deviation 34.576864107226115
median: 1.5021191691541866
0-th percentile: 1.0000503472711673
20-th percentile: 1.2938008529218694
40-th percentile: 1.4373863833592888
60-th percentile: 1.5547845818671844
80-th percentile: 1.686455293976037
100-th percentile: 10859.151443709372


3 Likes

Sounds interesting! I regenerated my mesh and I’m currently running the simulation again. I’ll let you know.

Log file:


volumeRatio
min: 1
max: 33.79398499770592
average: 1.3516627068678302
standard deviation 0.5838785811141088
median: 1.1840394521105049
	0-th percentile: 1
	20-th percentile: 1.010286060490993
	40-th percentile: 1.118225205840025
	60-th percentile: 1.2748855725445274
	80-th percentile: 1.534880811591907
	100-th percentile: 33.79398499770592

tetAspectRatio
min: 1.0000000000000002
max: 15.493828744520325
average: 1.4802379067783287
standard deviation 0.26586112230295944
median: 1.4917875681482482
	0-th percentile: 1.0000000000000002
	20-th percentile: 1.2934514872245306
	40-th percentile: 1.4323271143076726
	60-th percentile: 1.5366132761789262
	80-th percentile: 1.6581977542565727
	100-th percentile: 15.493828744520325

Looks better, don’t it?

Okay, @Retsam’s solution seems to work. With the altered mesh, I do get results. The velocity, however, is extremely high, see below. I will evaluate my model and report back when I know more.

Now you have a convergence issue in ‘Run 5 - wall’:

  1. Add a ‘Forces and Moments’ results item on the ball. (When you get close to convergence these forces need to be stable, but right now you are not close to convegence)
  2. Try ‘Potential Foam Intitialization’ = ON.
  3. You will likely see the forces start diverging around 30 iteration, so you can do 50 iteration max sim runs until you figure out how to get this back to something that is trying to converge, then increase iterations and then try get it to run to full convergence. You will have a lot of separated flow so you will likely not get the best convergence anyway.
  4. Do some research on convergence issues and show us more as you progress, when you do, please provide direct browser links to the tree items you are concerned about.

Welcome to the time consuming world of CAD Analysis (CADA) :slight_smile:

2 Likes

Thank you, @DaleKramer. I have changed the settings and I will run the sim again. Some notes:

  • How do you know that the simulation is diverging? I expected to see a line in the convergence plot to go all the way into the high numbers, but that is not the case. So how do I check for divergence?
  • I noticed a problem in my mesh (see below). The connection between the upper ‘cup’ and the box below should be without any separation. I cannot find these problems in my CAD model, so I expect it has something to do with the mesh. What could I do to solve this?

Mesh settings
Latest simulation run

Divergence is not just residuals, most of the time I find Results values showing the beginning of divergence earlier than residuals. However, residuals may seem unstable at first and then begin a general downward trend and perhaps become stable at values MUCH lower than yours (do some research please). In no way are your residuals showing a trend towards convergence.

The meshing routine isolates ‘edges’ in your surfaces and hence will give better edge definition on the edges. I think that is what you see here but your image is not zoomed in enough to tell for sure.

Okay, thanks for the help so far. What I did:

  • I added no-slip walls;
  • I altered the mesh to Hex-dominant with no manual refinements;
  • I turned potential foam initialization on;
  • I added a forces and moments result control to the sphere.

The mesh does no longer have the visible separation between the upper funnel and the box below. With theses changes, I re-ran the simulation. The convergence plot looks better now (k towards 2e-3 and omega towards 2e-6) and from t=90, the forces and moments seem to be quite stable.
I expected the maximum air speed to be around 100 m/s an to flow as indicated in the image in my original post.

The results are not perfect yet, as the convergence does not seem to be stable. So I guess I have to play more with the mesh settings.

Now you have somewhere to start :slight_smile:

The biggest issue I see is that face54 is MUCH too close to the sphere (please research domain size (background mesh box) recommendations). I would put it about 10 x diameter downstream of the sphere. If you really want accurate results, then you will need to do a study on different distances and select a distance where the results seem to begin being consistent.

Also, your Run 10, is still quite far from convergence with stable results values. I would have manually stopped that run at about 500i and tried other convergence tricks.

Here is NASA CR-1585 report, which I came across recently, which might help you understand what flow to expect. Reynolds number plays a HUGE role in Drag and flow lines…