actually I am trying to simulate a river turbine and I followed the following tutorial Fluid Flow Through a Water Turbine | Tutorial | SimScale
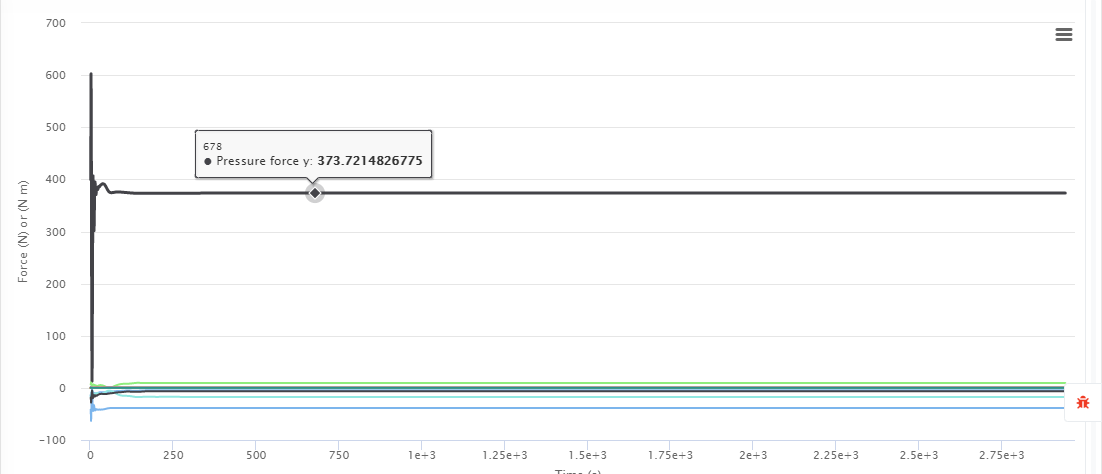
but the force and moment plots I am getting are not seeming to be accurate and they consist of constant lines instead of a curve
can you please tell me where am i going wrong
I am also trying to calculate the values of Cp and Ct. But the values of Moments are increasing as I increase the values of angular velocity from 20,40,60,80 and 100 rpm. But as we see the actual graph of Cp and Ct, the values increase and then decrease which means the values of moments must also increase upto certain rpm and then decrease. Am I right? But here that is not the case
So could you please help me out with this as well?
Hi @alijalil and thanks for your detailed description of your problem!
For the force curve that is fine as you actually want to see the force converge and eventually stop the simulation before its expected end. Maybe you mixed it with the so called convergence plot which indeed is a curve and usually starts at a high value and then successively decreases (case dependent!).
Could you share the project link with us here to see what settings you have used? Tagging @roy_g, @ROHIT_SR.
hi @alijalil
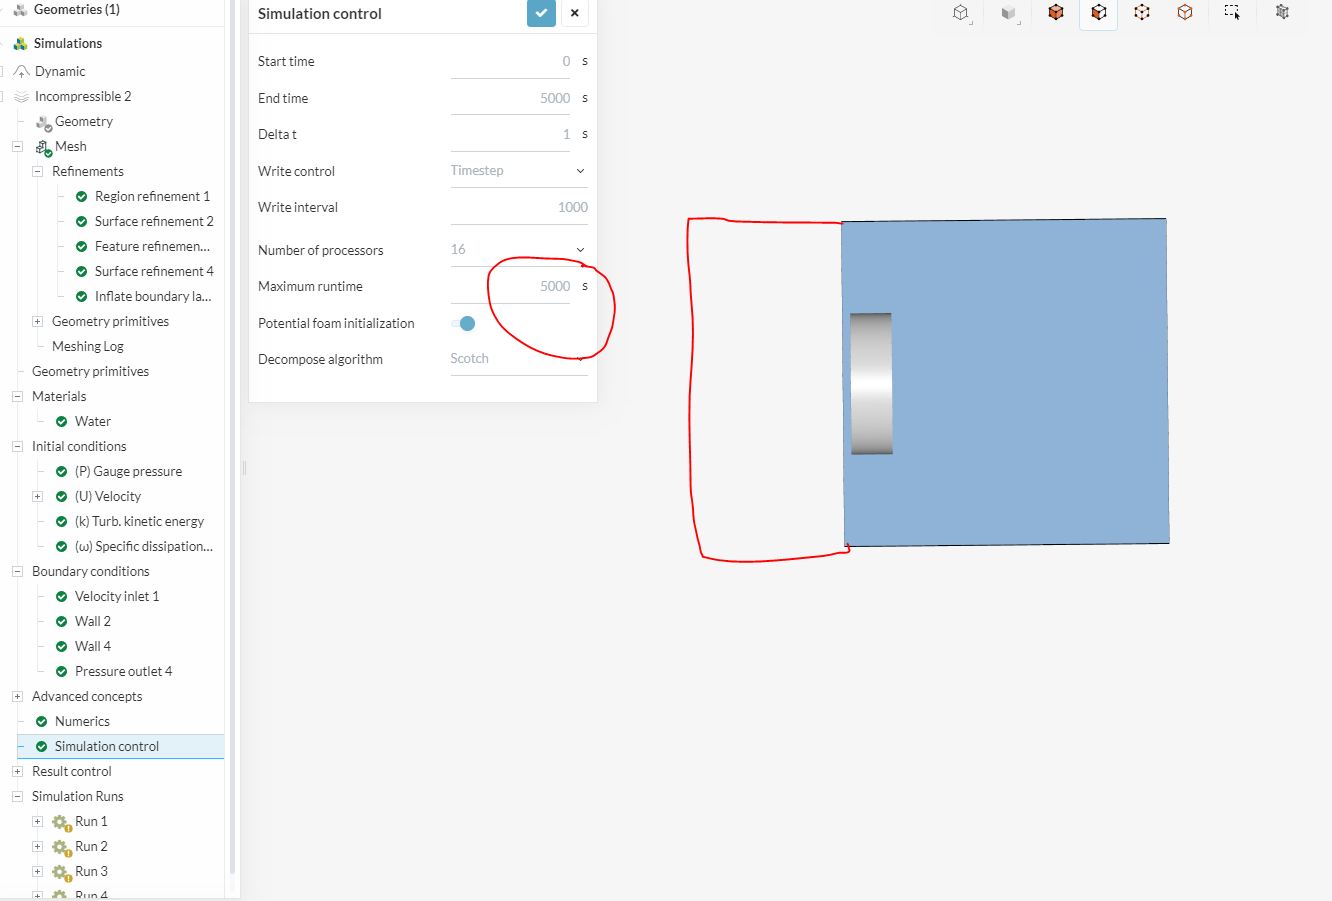
you continuously run the simulation with the same runtime that why its show error( all 4 runs).
increase the run time in SIMULATION CONTROL.
AND you can also increase your background mesh box length. in this case, your inlet and turbine were very close to each other. your other setup was good and i think there was no problem.
I am not an expert with turbo machinery but the problem seems well setup and well converged. The reason your simulation does not run successfully is because it takes longer than the maximum allowable run time set under simulation controls. Increase the time to above the 5,000 seconds it is currently set at and your simulation should finish.
Regarding your question, you are running a steady state simulation. If you want to learn about about what happens during the transient period of operation you should run a transient simulation. This is because a steady state simulation aims to converge and show the final steady state results as quickly as possible but is not concerned with showing accurate values during the transient period. The reason a transient simulation is slower is that it converges for every time interval and will show you an accurate result for every time step.
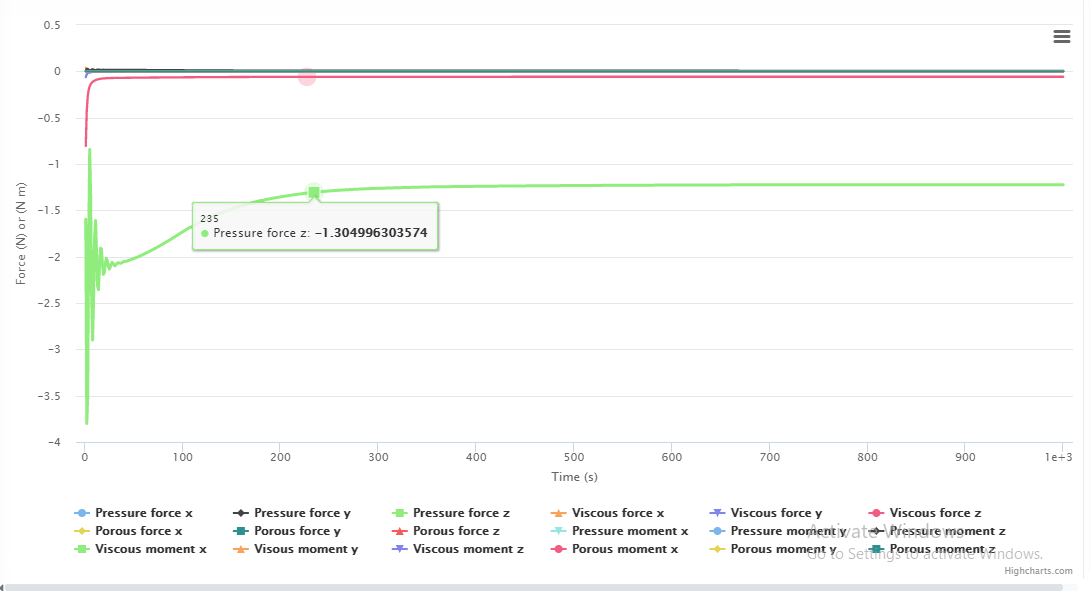
hi @Fozan. I did check your project. I have noticed that your pressure force plot along z is coming out to be negative however my pressure force plot along y is coming out to be positive. and vice versa in the case of pressure moments.(my turbine axis is along y axis). In short there is a difference of direction of plots in my project. What could be the possible reason for this? I am attaching my force plot’s picture vs yours here
I simply extract all the coefficient (Cl, Cd and Cm) data and manually plot torque vs wind speed and Cp vs TSR. Convert the Cm (±ve) side which is in my case Y axis.
@alijalil Thrust force is in -ve z direction in my project and the axis of rotation is z. Your axis of rotation is y and the thrust force on your turbine would be in +ve y direction. You should assign velocity in +y direction at velocity inlet.
Salam Fozan Bhai. I am currently having 1.2M cells for the same project. I want to raise these cells level to about 3-4 million cells. How can I do that effectively to suit my 16 core hour limit of 4M cells?