When running a PWC simulation and upon inspecting the comfort map one could possibly see some regions of discomfort, or regions that are not associated with the desired activity in that area. This then leads to a few questions that the architect/designer is most likely to propose; those are along the lines of:
What is causing those areas of discomfort?
What is the wind direction with the highest influence?
Finding an answer to those questions could have a significant impact on allowing the designer to produce an educated design iteration that should lead to an improvement in the design. For example, by identifying the wind direction with the highest influence one could think of an appropriate wind mitigation strategy that reduces the influence of the wind from that direction.
The purpose of this post is to demonstrate through an example how one could answer such questions directly inside the SimScale platform.
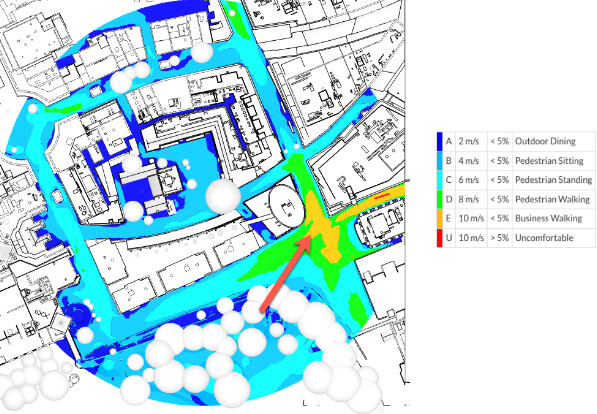
The figure below shows a proposed site layout for a project in the city of Bristol. let’s Imagine that you are the designer of this site and you want to run a pedestrian comfort analysis to understand if this site layout would suit the needs of the client. The client did specifically mention that just outside the cylindrical high-rise building he would like to open a coffee shop. This implies that the comfort in that area should be suitable for outdoor sitting.

As the designer, you access the SimScale platform and easily set up a Pedestrian Wind Comfort simulation that would investigate the comfort map based on 8 different wind directions. Before proceeding further, it is worth highlighting that due to the cloud-native architecture of SimScale all of these wind directions would be run transiently at the same time in parallel, which allows the SimScale user to save a significant amount of time in analyzing their designs.
Upon investigating the pedestrian wind comfort map results, you find that at the location of interest there is a region of high velocity which causes the comfort level to be suitable only for business walking (indicated by the orange color in the map). To be able to explain this outcome you would like to identify the cause and use that information to arrive at an acceptable design conclusion.
Below you can find a few suggestions that would help in identifying the wind direction with the highest influence on the pedestrian comfort level:
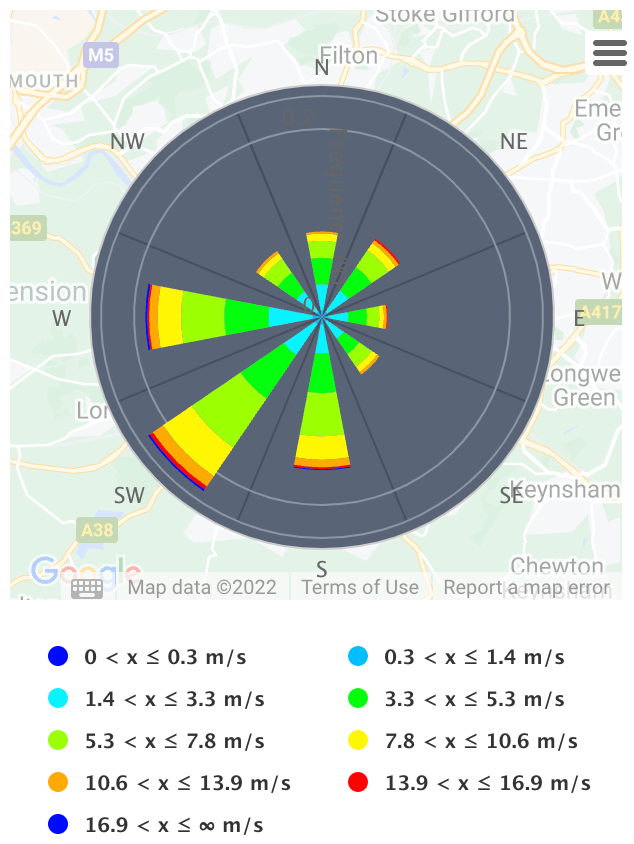
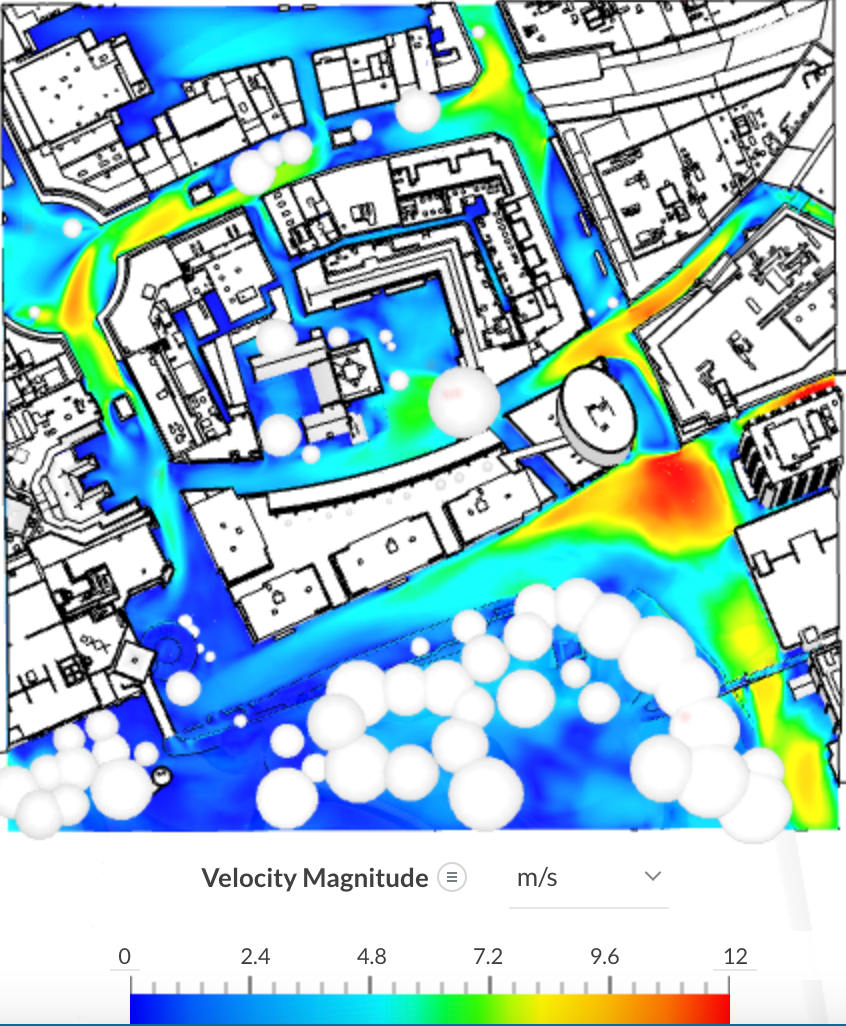
- Start by inspecting the velocity field of the predominant wind direction, from the wind rose below we can see that this corresponds to the southwesterly direction
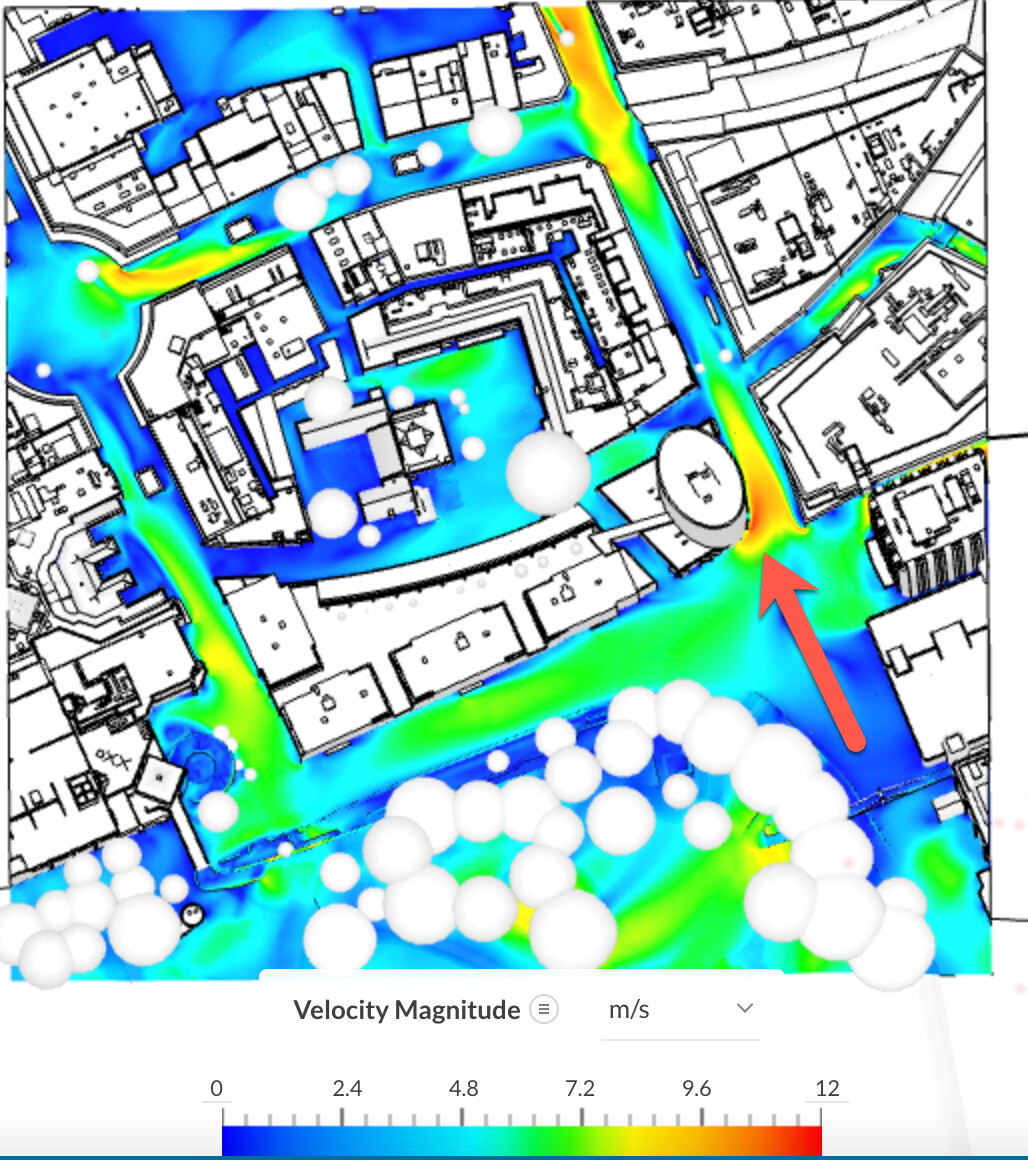
Inspecting the averaged velocity results associated with this wind direction as shown below, we can clearly identify one reason for the cause of discomfort in the area of interest. The air accelerates due to a cornering effect as it passes the cylindrical building.
- Investigate the velocity field of the wind direction that is aligned best with the area of discomfort. An example of this would be the southerly wind as it aligns more or less with the path of the discomfort area. We can clearly see a high velocity region just infront of the area of interest due to mainly an air channeling effect.
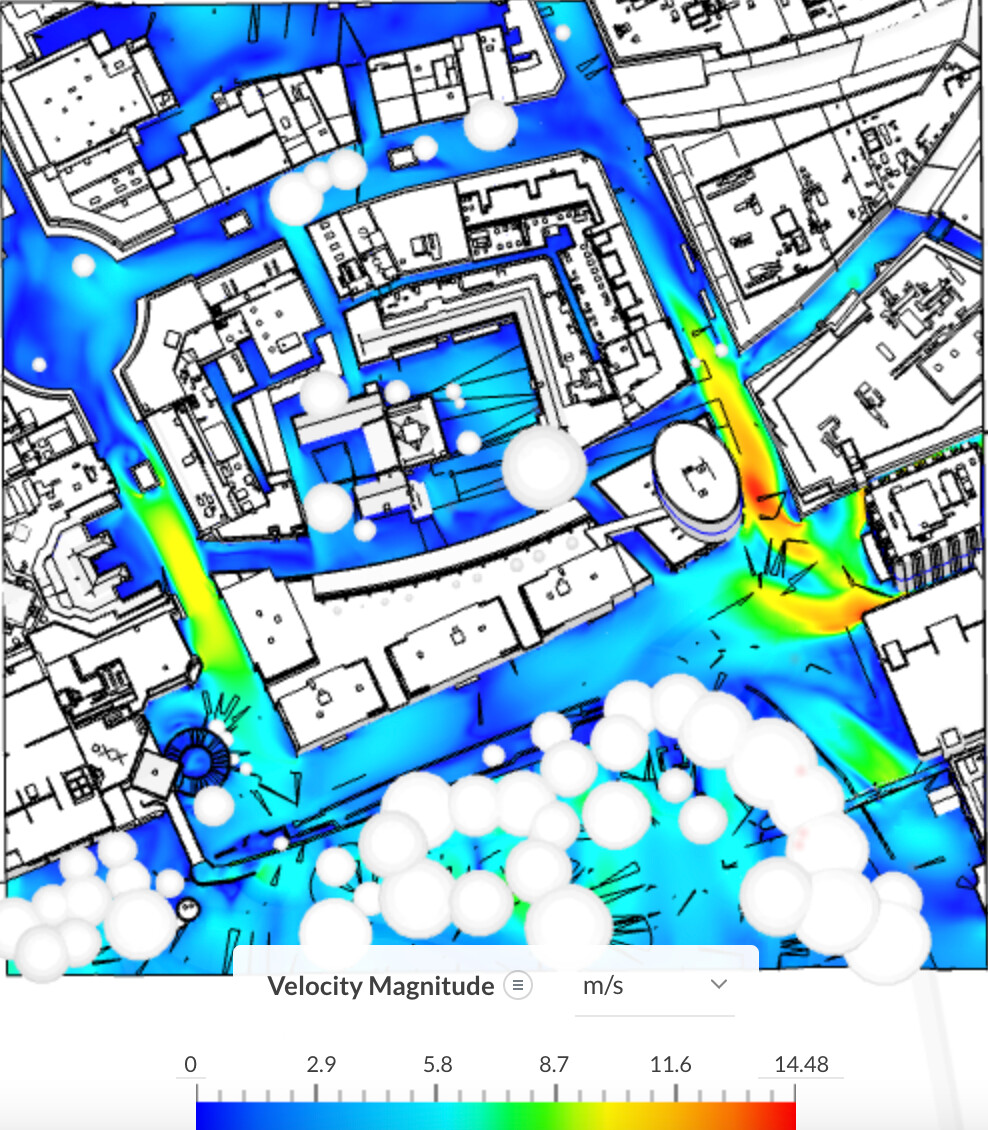
- Investigate the velocity field associated with the second most predominant wind direction. This corresponds to the westerly wind as illustrated by the wind rose above. From the velocity results, we can see a large region of high velocity just before the area of interest. This is mainly due to the downwash effect of high-rise buildings. Moreover, this high-velocity region could cause a draft of wind near the area of interest where the people would be sitting and enjoying their coffee.
- This is an additional step that allows you to visualize the results in a 3-dimensional sense to gain a qualitative understanding of the “why”. To learn how you can add streamlines in a PWC simulation, please refer to this article.
Below, we are visualizing the 3D results of the predominant wind direction. We can clearly visualize the downwash effect as the wind interacts with the high rise building. Additionally, the cornering effect can be observed at the bottom corner of the building, where the velocity streamlines become brighter as they path through that corner indicating an increase in velocity.
For each of the steps above one can investigate the velocity field and inspect its associated values either through the numerical legend or by inspecting points. This allows the user to quantify and understand the wind direction that causes the highest velocity flow in the region of interest. Essentially, leading the designer to think of the appropriate wind mitigation strategy (if needed) to satisfy the objective of the analysis.