\underline{\textbf{Introduction}}
To create a successful post-processing result it is important to think about what you are trying to visualize, and who you are visualizing for. To understand the results and draw conclusions, the main post-processing visualizations will be simple and to the point. This SimWiki aims to explain the basic filters which can be used to sufficiently describe the results of most simulations, be it FEA or CFD.
\underline{\textbf{Slice}}
A slice is the most simple, but effective filter in our arsenal when it comes to post-processing 3D results. This filter displays the results on a 2D surface, whether that is planar or cylindrical. A planar slice is the most used and is the default, and is useful for showing results at a certain cross-section of the 3D results.
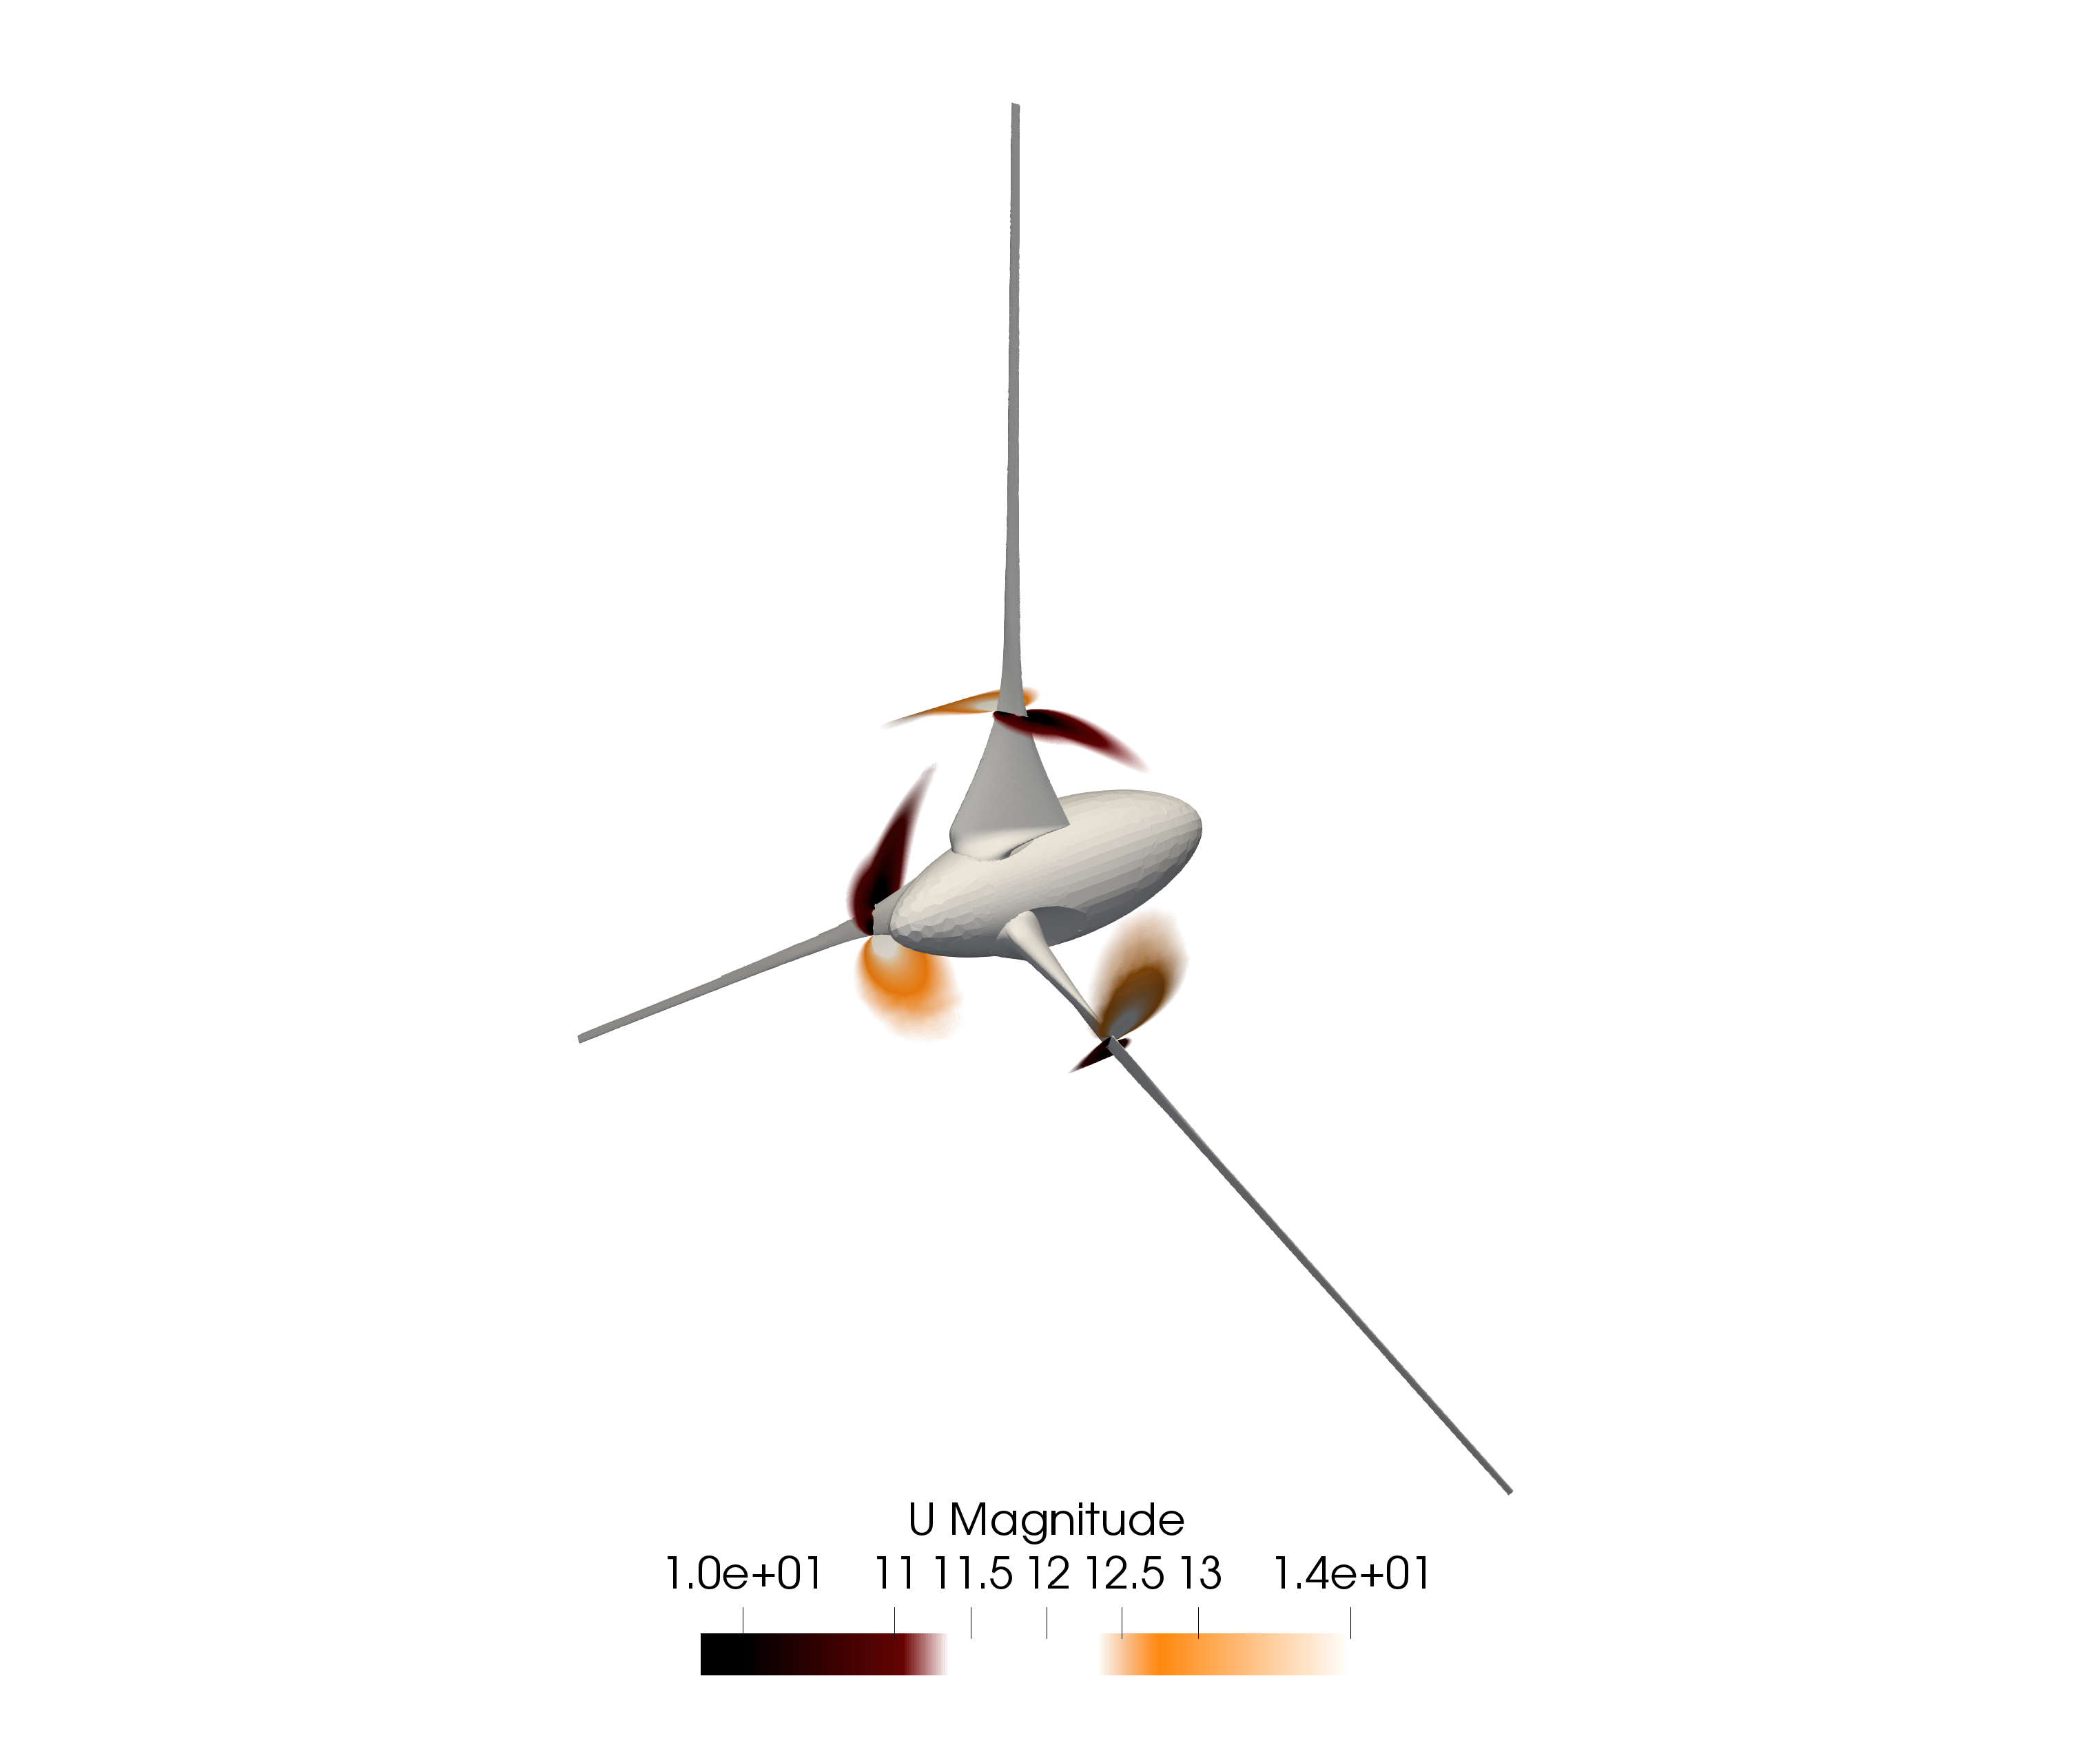
Figure 1: Slice around a cylinder where axis of rotation is the centre axis for the cylinder
\underline{\textbf{Clip}}
Clip filters remove results from inside or outside a primitive. The default type is planar clipping where results are removed from a side of the plane. This filter is useful for removing unwanted results or for peering into a field without removing the rest of the results.
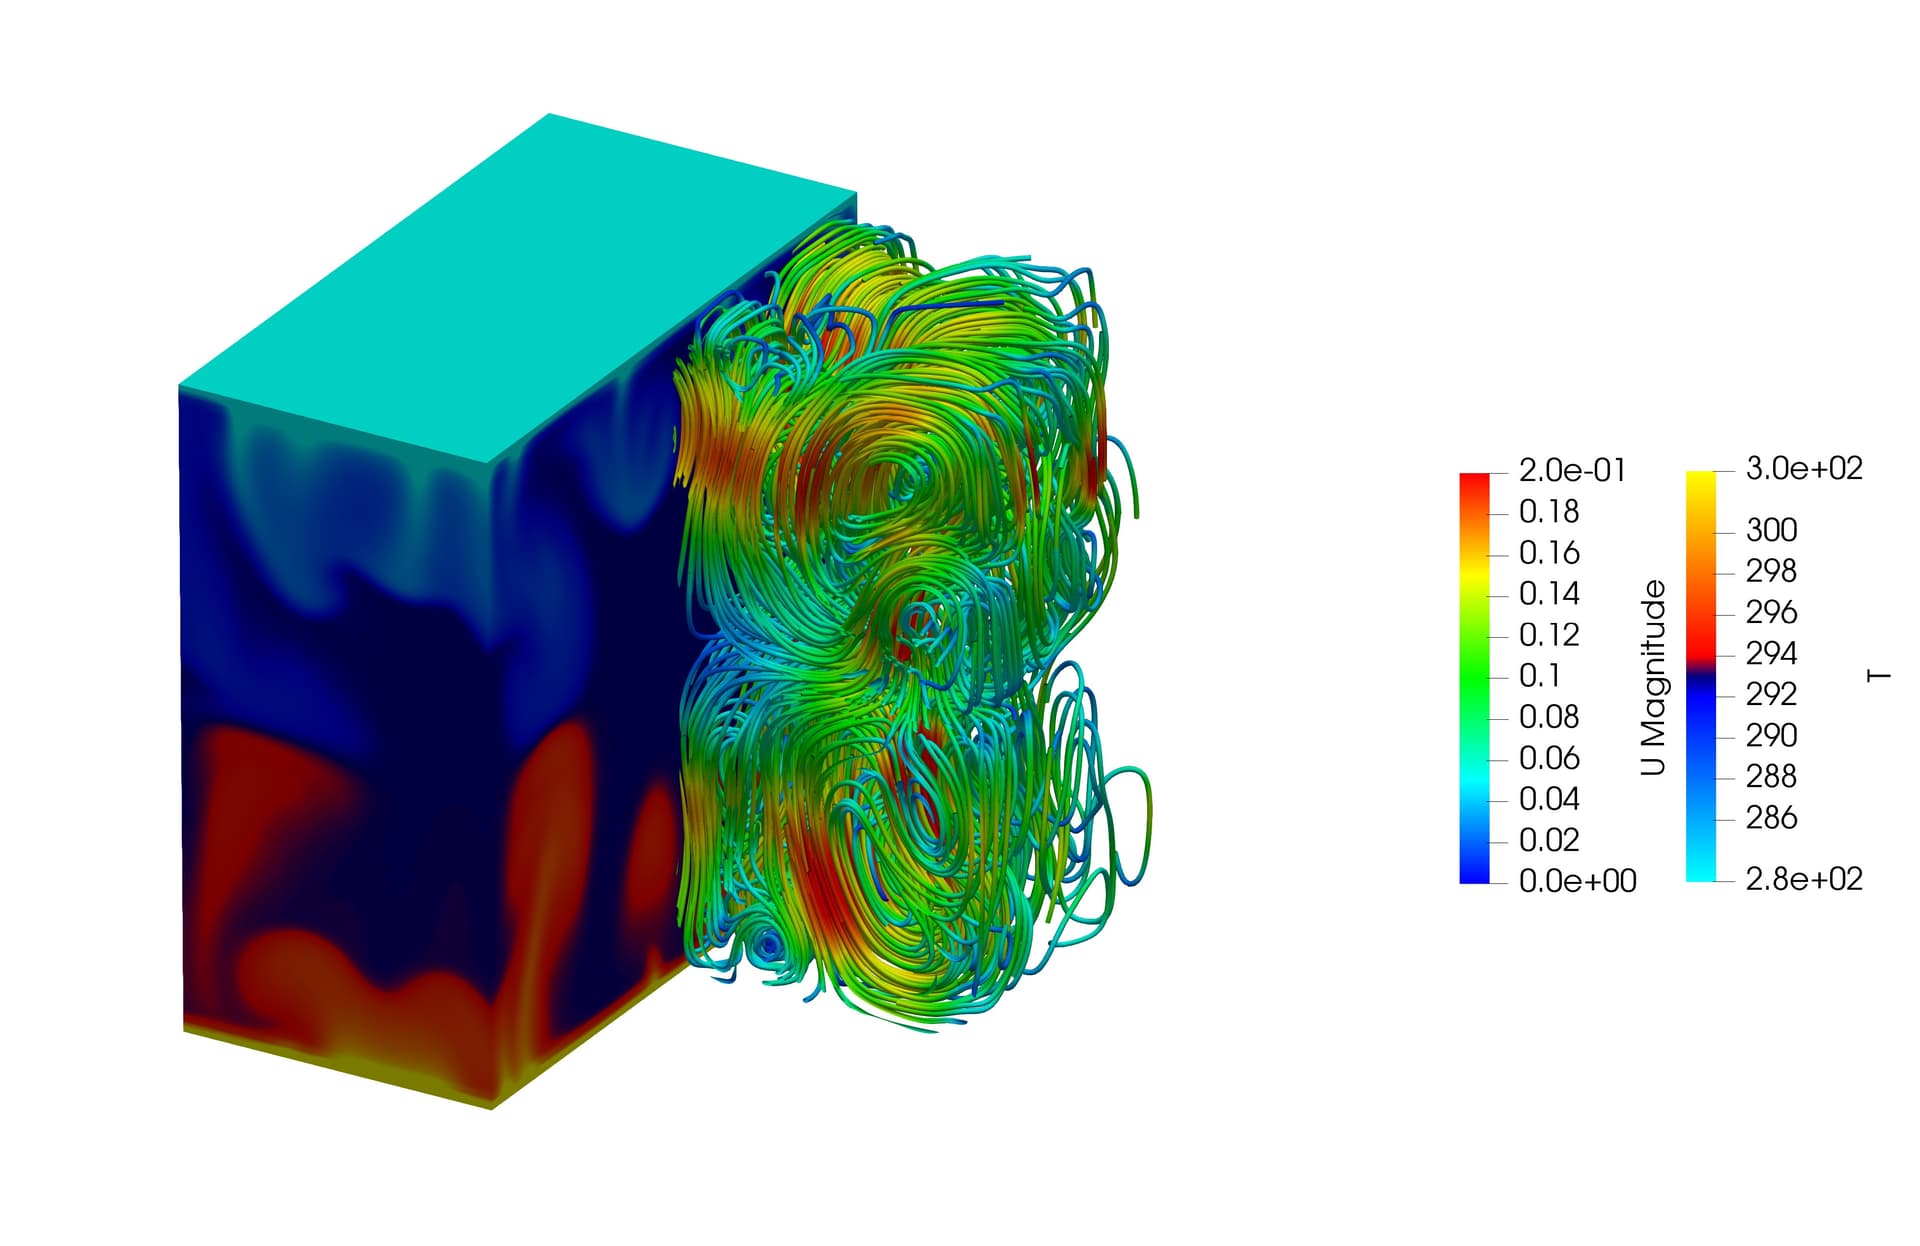
Figure 2: Clipping temperature to reveal streamlines, and clipping streamlines to better show vortices. Results coloured by temperature and streamlines coloured by velocity
\underline{\textbf{Streamlines}}
Streamlines are used to visualize direction and path of a field of vectors, being used most commonly in CFD applications to visualise fluid flow using velocity vectors, however, they can also be used to visualize heat flow in both CHT applications and FEA.
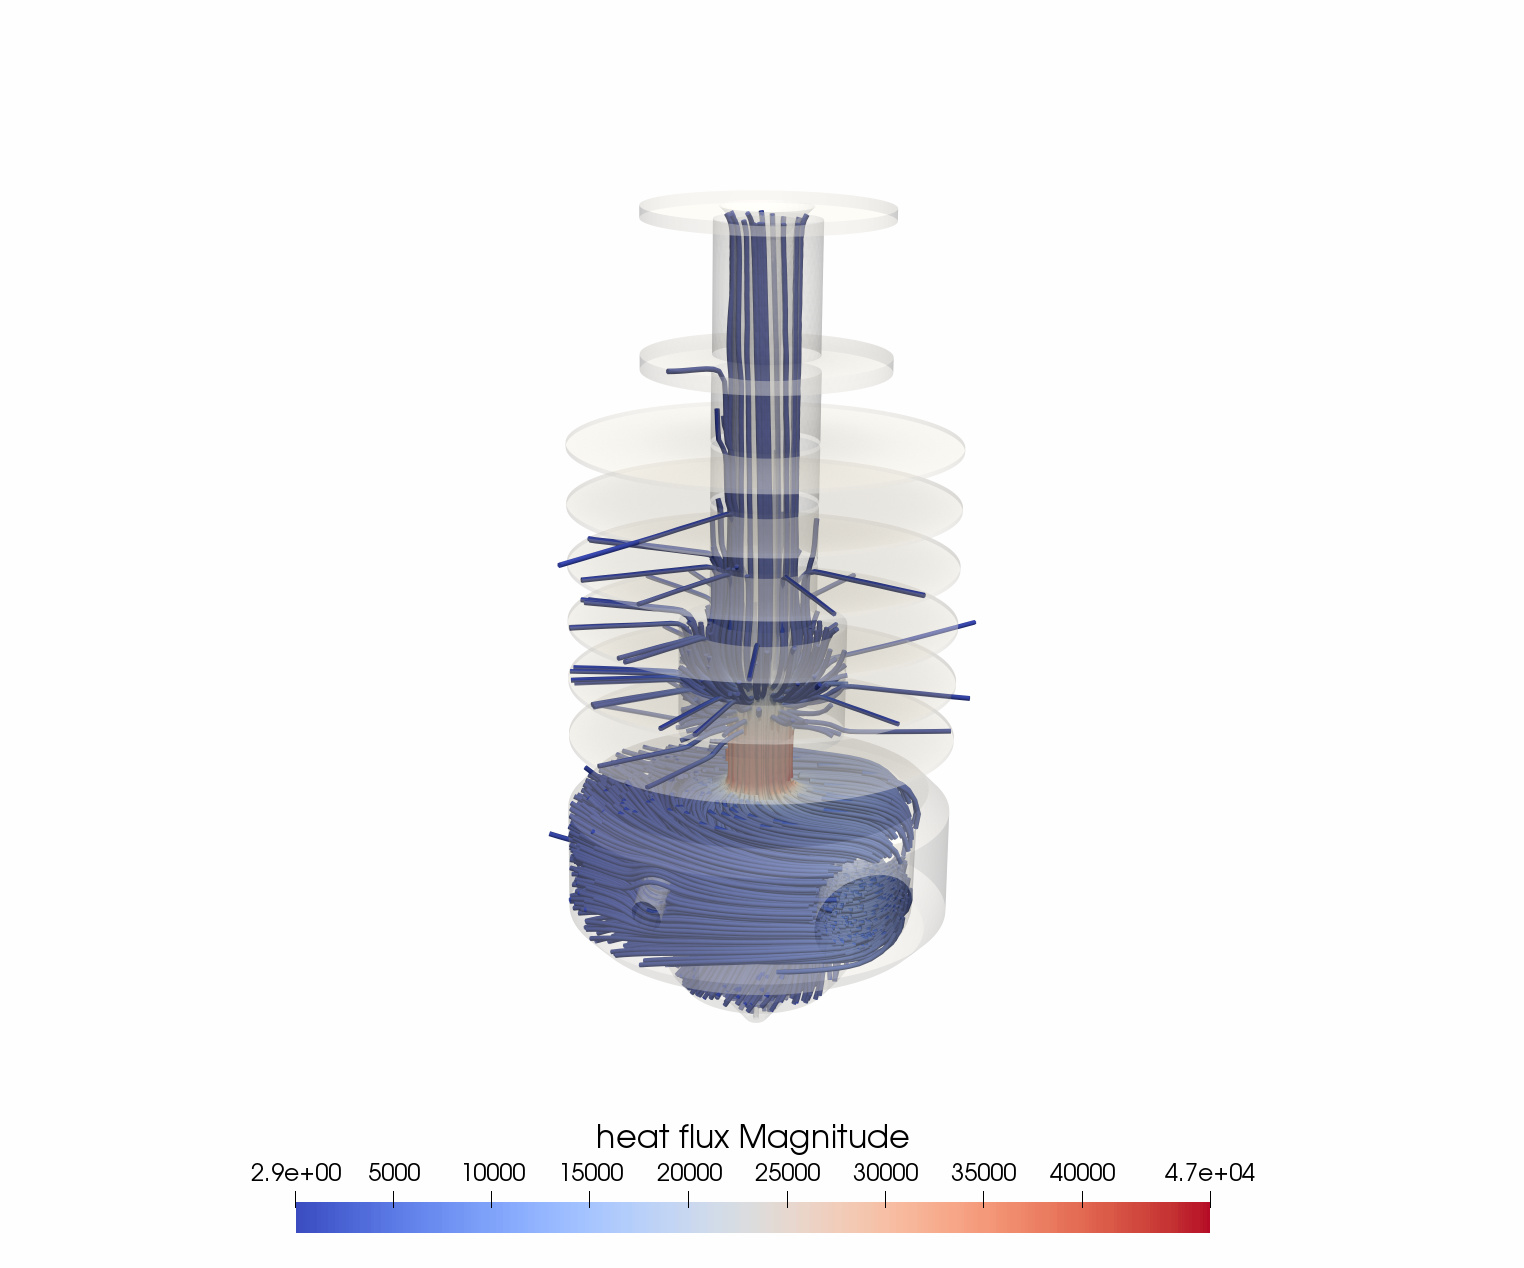
Figure 3: Streamlines of heat flux within an extruder, coloured by magnitude of heat flux
\underline{\textbf{Glyph}}
It is often necessary to visualize the direction of a vector which can be done by using the Glyph filter. The Glyph filter can be used to show direction and optionally magnitude of a field. Uses include visualizing a flow field’s instantaneous direction, or a deforming object’s deformation direction.
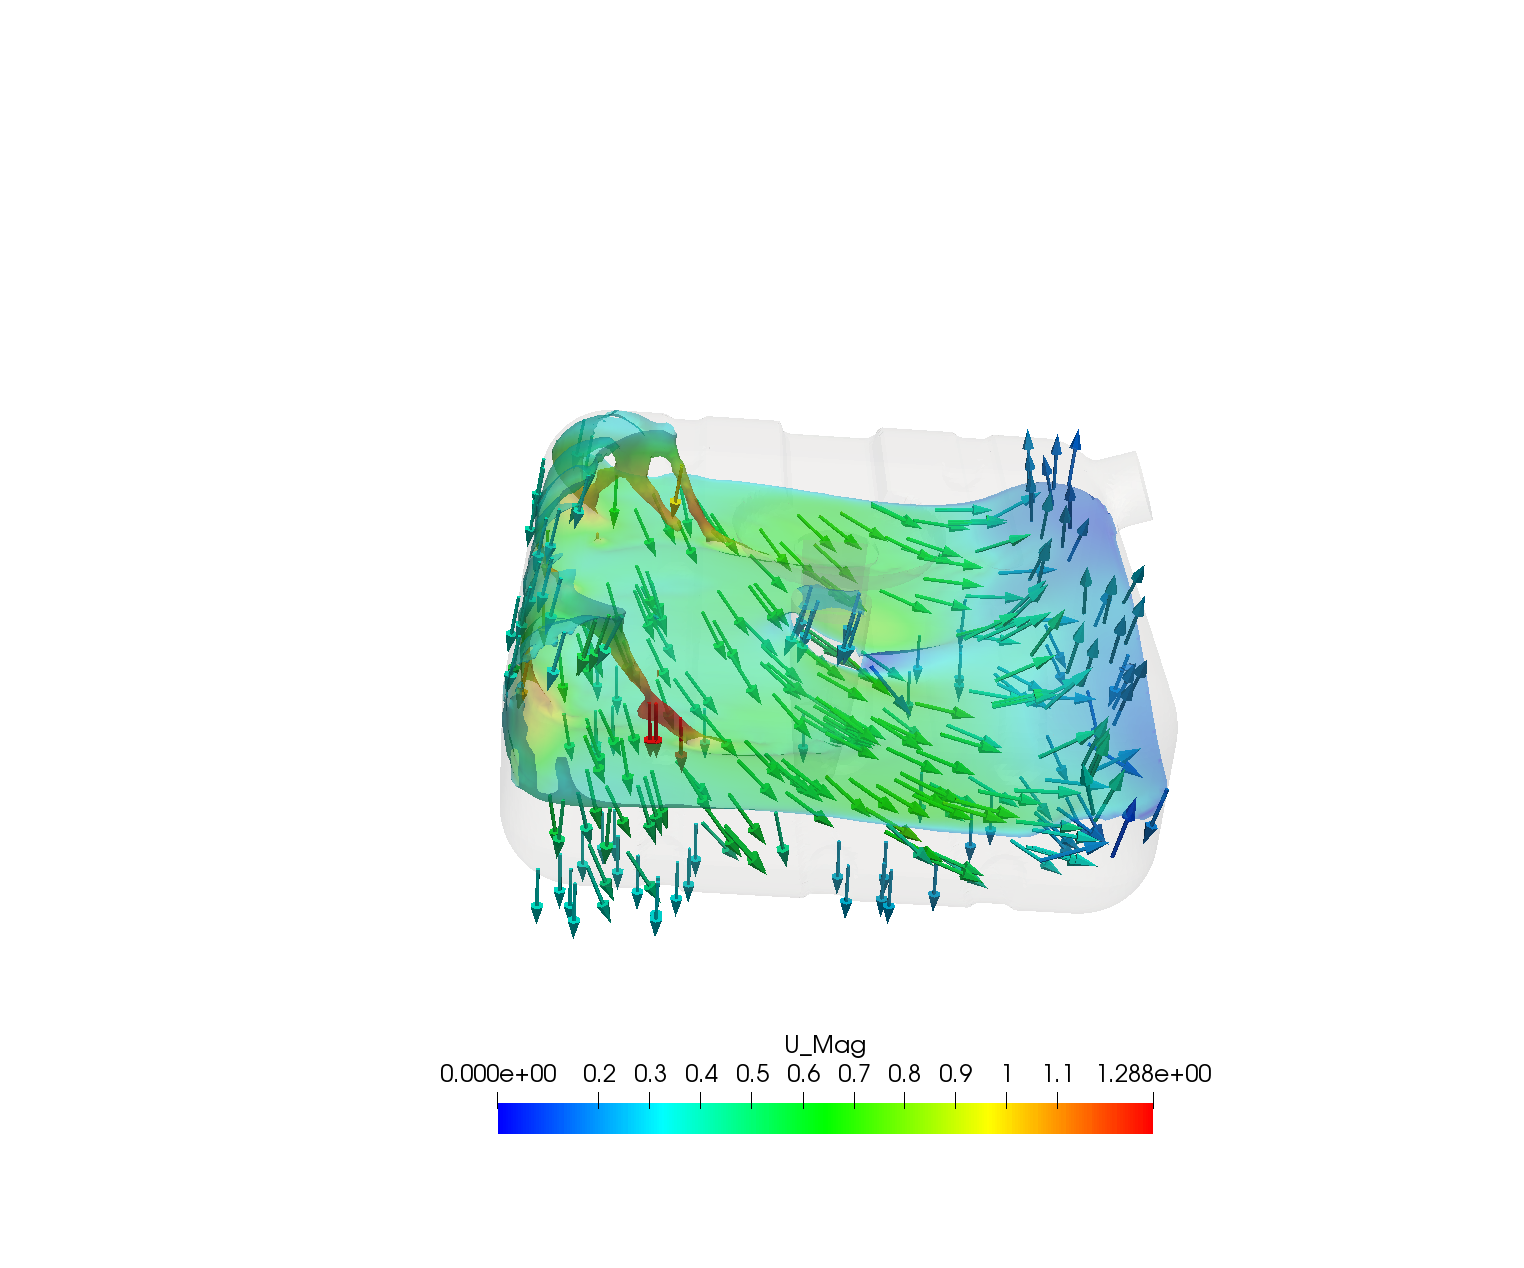
Figure 4: Glyph of velocity vectors, coloured by velocity magnitude
\underline{\textbf{Threshold}}
Threshold and clip filters are similar in the sense that they remove unwanted data, but instead of removing due to a geometric filter, a threshold filter removes data by evaluating whether each cell falls within given bounds of a field. The result of this filter isn’t very visually pleasing and is usually used to intelligently filter out data to visualise another filter such as the glyph filter (see the example for Glyph where cells containing air were removed to visualise only velocity in the fluid).
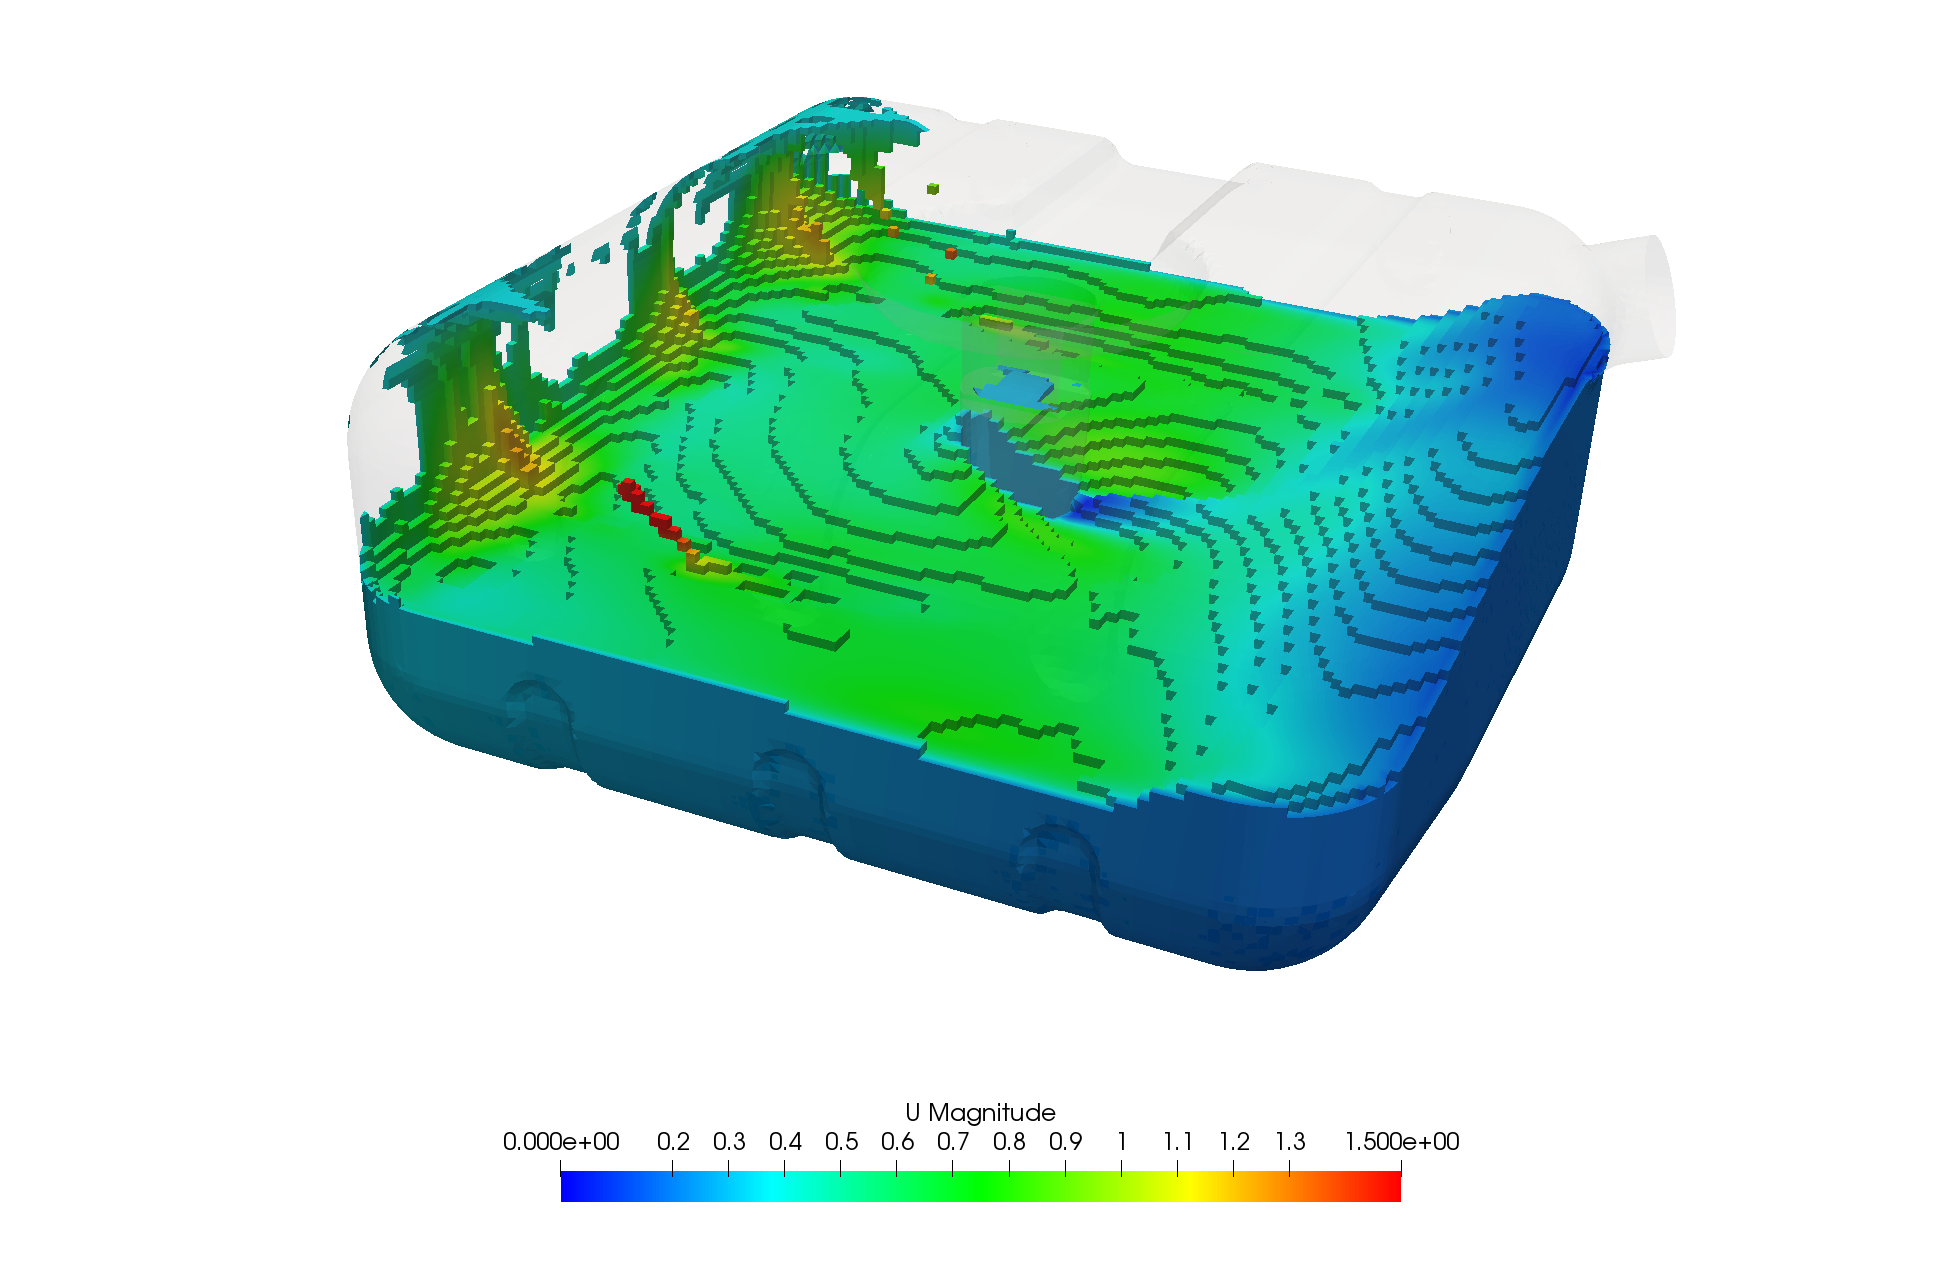
Figure 5: Threshold filter removing cells containing air, threshold visualises petrol volume coloured by velocity
\underline{\textbf{Contour}}
Contours create surfaces when contouring 3D data or lines when contouring 2D data. Surfaces are created on values of a defined field, for which many values can be specified. Contours have often been used to visualise fluid surfaces in multi-phase and for visulising pressure layers.
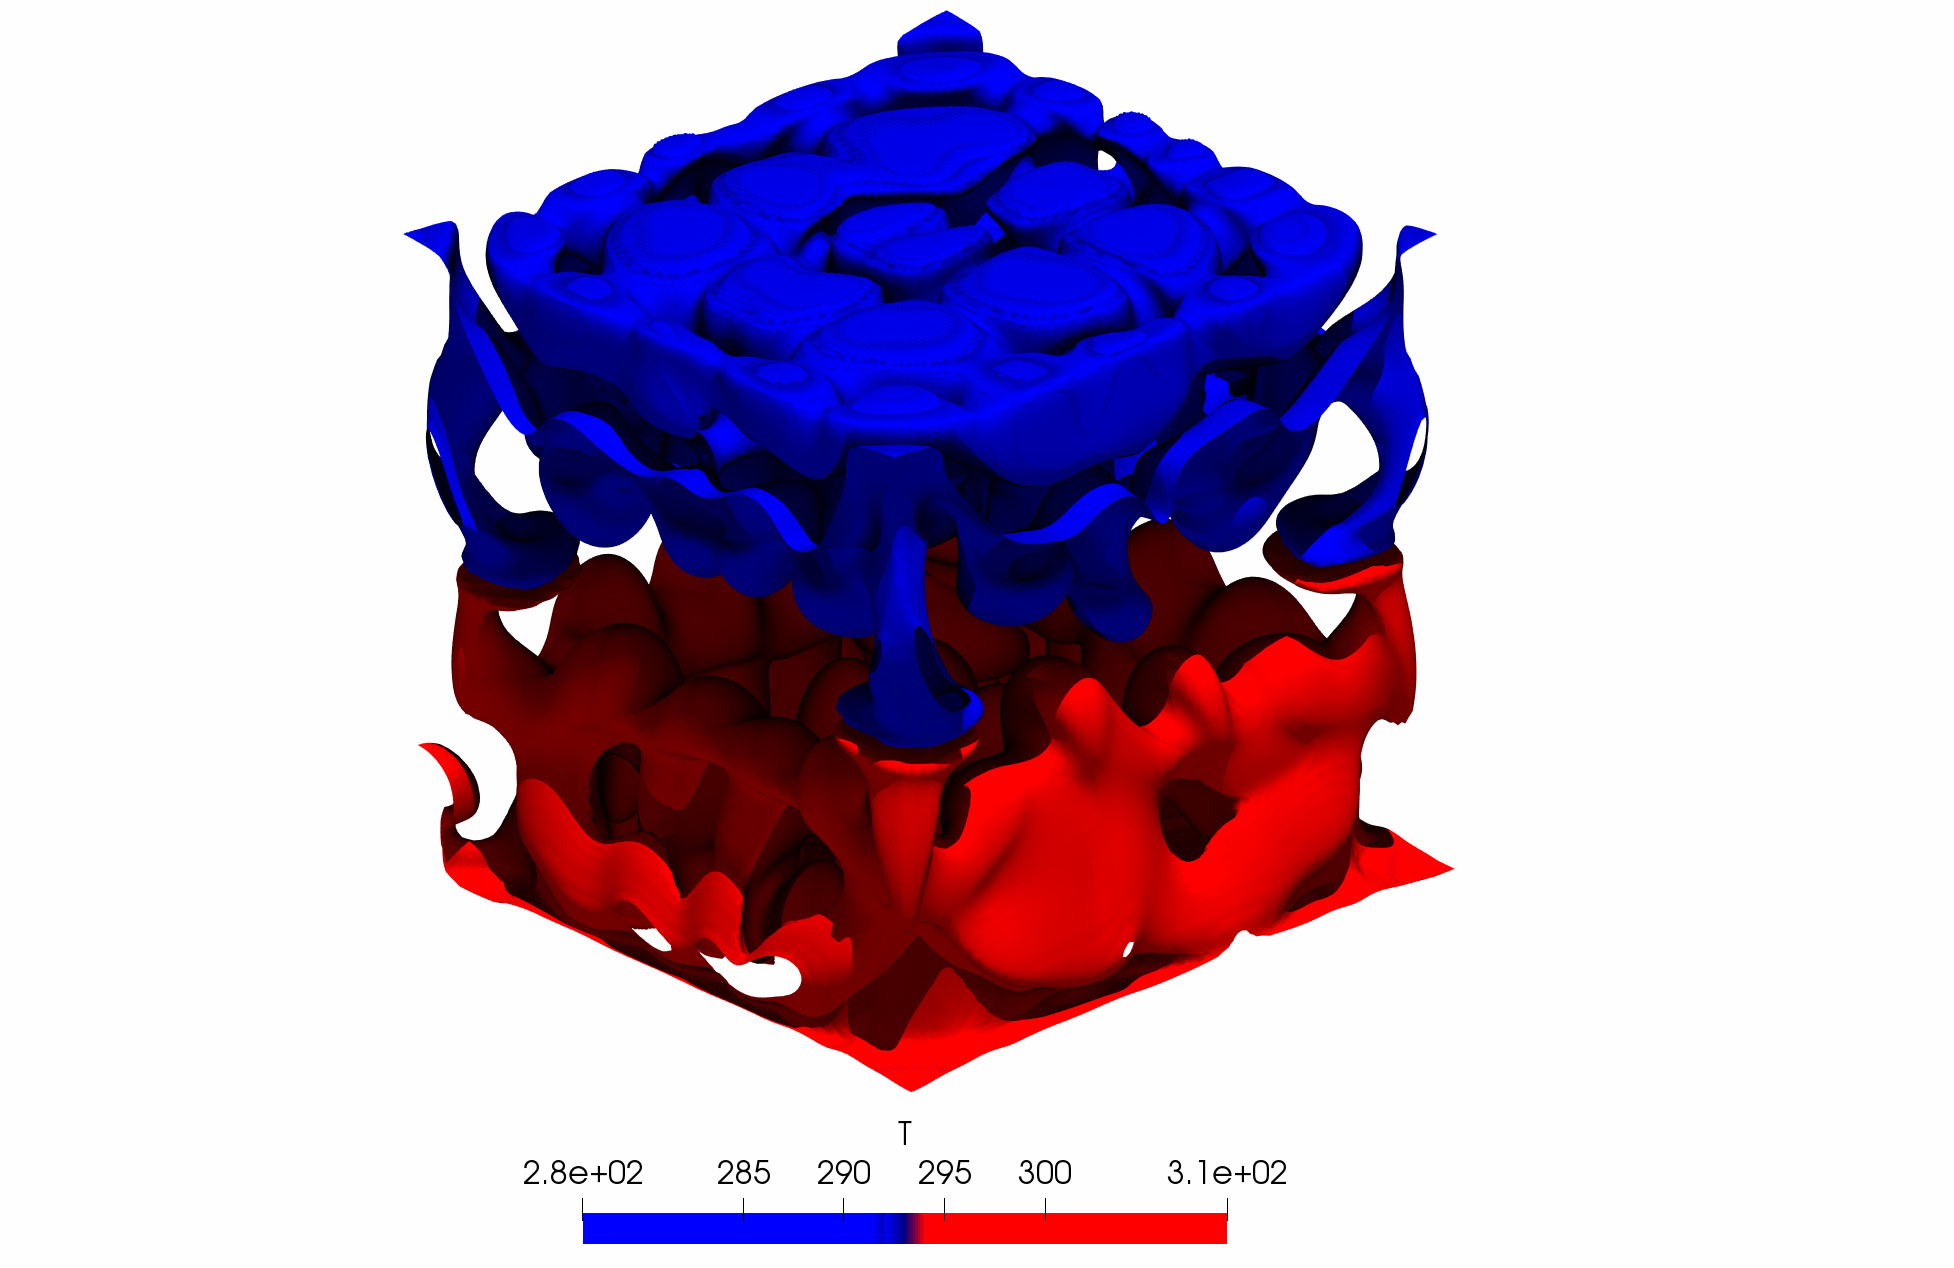
Figure 6: Countour plot of two temperatures, showing plumes from hot and cold surfaces.
\underline{\textbf{Want to read more about Post-Processing in ParaView?}}
Data Types
Layering filters (Coming soon)
Exporting your data (Coming soon)
Credits to PowerUser Darren (@1318980)
Contributions and suggestions for improving this page are welcome, please private message @1318980