After focusing more time on getting the porous media results to match the simulated radiator results, I have found some areas that are unclear. The first calculations of the Darcy Forchheimer coefficients have been recorded using alpha and beta values from the curve fit polynomial. The problem lies in the fact that removing the Y-Intercept changes the alpha and beta values in the equation. Doing so results in the following equation:
y = 4,39x2 + 22,922x
Where:
Alpha = 22.922
Beta = 4.39
This results in the following coefficients for the porous media
| Darcy Coefficient without Y-intercept | 72895531.88 |
|---|---|
| Forchheimer Coefficient without Y-intercept | 403.59 |
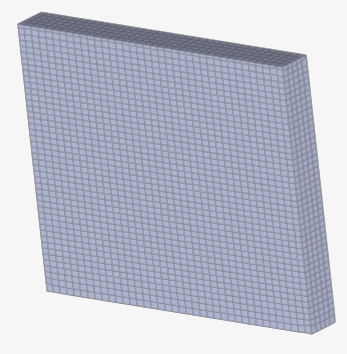
I then ran two straight on porous media tests with the velocity and pressure drop data to relate to. This test was done with the following settings
Rad porous media test
- 35 deg c
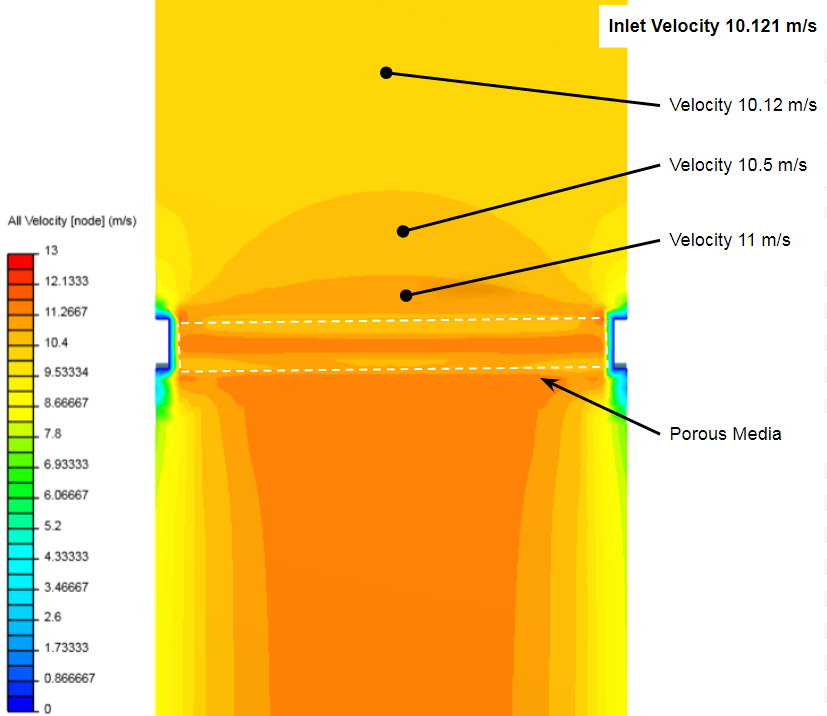
- 10.121 m/s
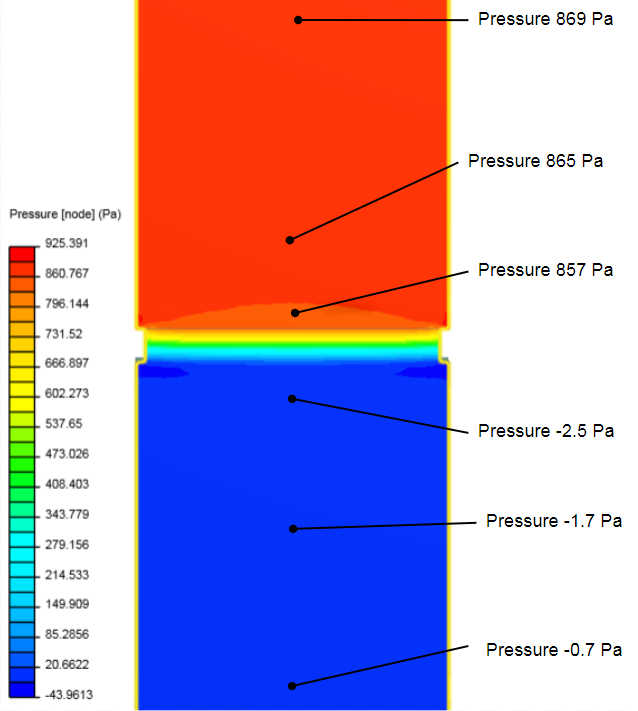
Average Pressure drop assumed
Pressure before = 869 Pa
Pressure after = -2.5 Pa
Pressure drop = 871.5 Pa
Without y- intercept value - Pressure
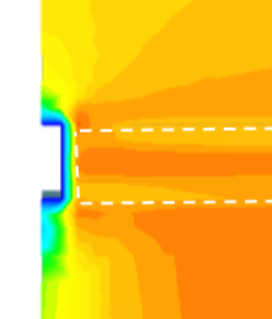
Without Y- intercept value - Velocity
Velocity at face = 11 m/s

Results of Straight on Porous media without Y- Intercept VS actual data
| Straight on Porous media without Y- Intercept | Actual Data | ||
|---|---|---|---|
| Velocity m/s | Pressure Drop Pa | Velocity m/s | Pressure Drop Pa |
| 11 m/s | 871.5 | 10.121 | 679 |
| Difference | 0.879 | 192.5 |
With y- intercept value
The second radiator run was done using the same velocity settings as the first run (10.121 m/s). However this time the curve fit equation was slightly changed by adding the Y-Intercept selection. This gives the full equation, and with the Y- intercept ignored a new alpha and beta result. Which results in the equation.
y = 4,1342x2 + 26,185x - 8,7
This gives the following coefficients
| Darcy Coefficient | 83272380.35 |
|---|---|
| Forchheimer Coefficient | 380.07 |
Pressure before = 879 Pa
Pressure after = -2.5 Pa
Pressure drop = 883.4 Pa
With Y- intercept value - Pressure

With Y- intercept value - Velocity
Velocity at face = 11m/s
Results of Straight on Porous media WITH Y- Intercept VS actual data
| Straight on Porous media WITH Y- Intercept | Actual Data | ||
|---|---|---|---|
| Velocity m/s | Pressure Drop Pa | Velocity m/s | Pressure Drop Pa |
| 11 m/s | 883.4 | 10.121 | 679 |
| Difference | 0.879 | 204.4 |
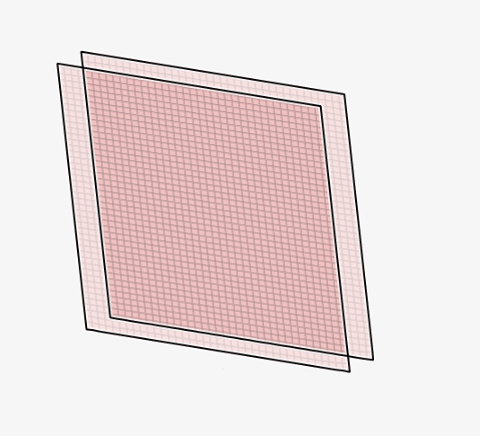
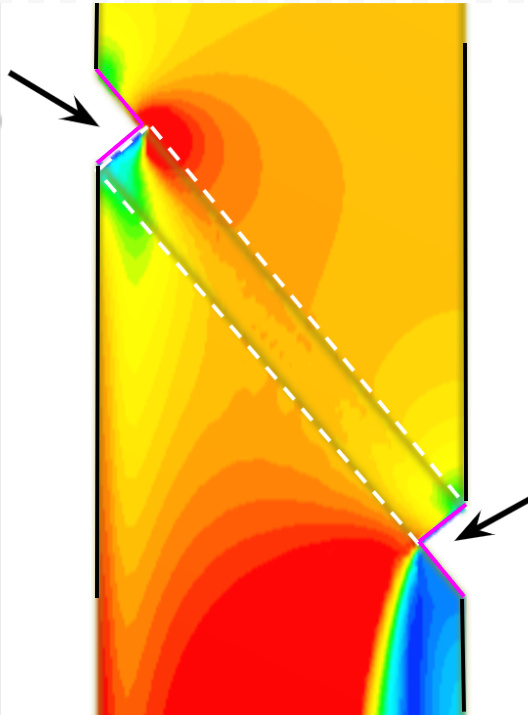
Rad verification sideways
Next I decided to simulate the radiator at the 50 degree angle it will be positioned at on the car. The results from these simulations provided better coherence to the actual data, which makes me think this was taken into account with the real radiator simulations. The first sideways radiator run was done using the same alpha and beta results WITH the Y-Intercept values kept and again using the same coefficients.
| Darcy Coefficient | 83272380.35 |
|---|---|
| Forchheimer Coefficient | 380.07 |
Pressure before = 625 Pa
Pressure after = -12 Pa
Pressure drop = 637 Pa
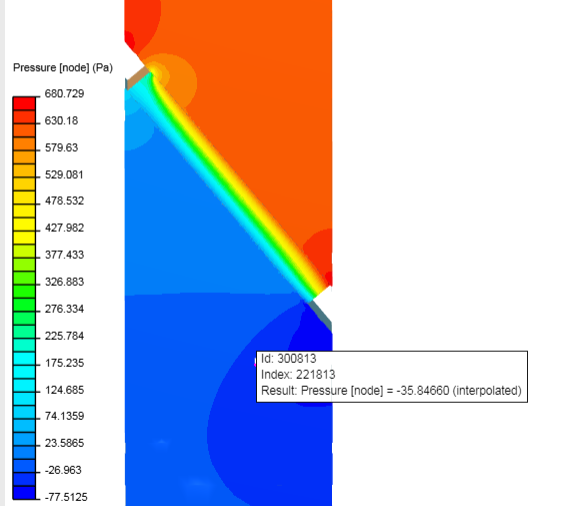
50 deg angle - With Y- intercept value - Pressure

50 deg angle - With Y- intercept value - Velocity
Velocity at face ~ 10.8 m/s
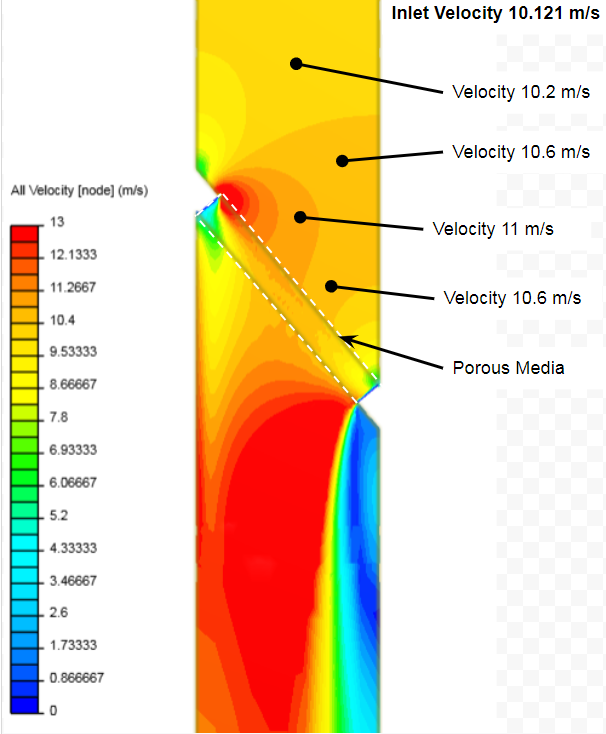
Results of 50 deg angle Porous media WITH Y- Intercept VS actual data
| 50 deg angle Porous media WITH Y- Intercept | Actual Data | ||
|---|---|---|---|
| Velocity m/s | Pressure Drop Pa | Velocity m/s | Pressure Drop Pa |
| 10.8 m/s | 637 | 10.121 | 679 |
| Difference | 0.679 | 42 |
Now there are some questions along with my setup of these tests.
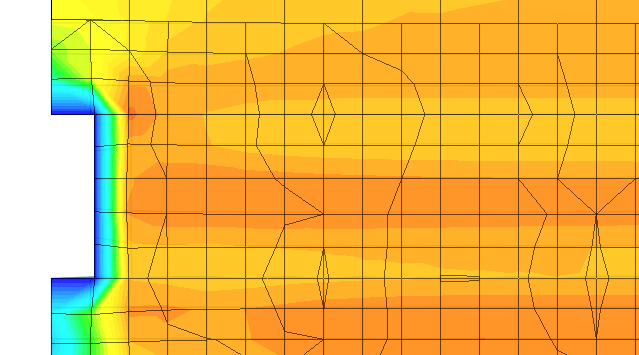
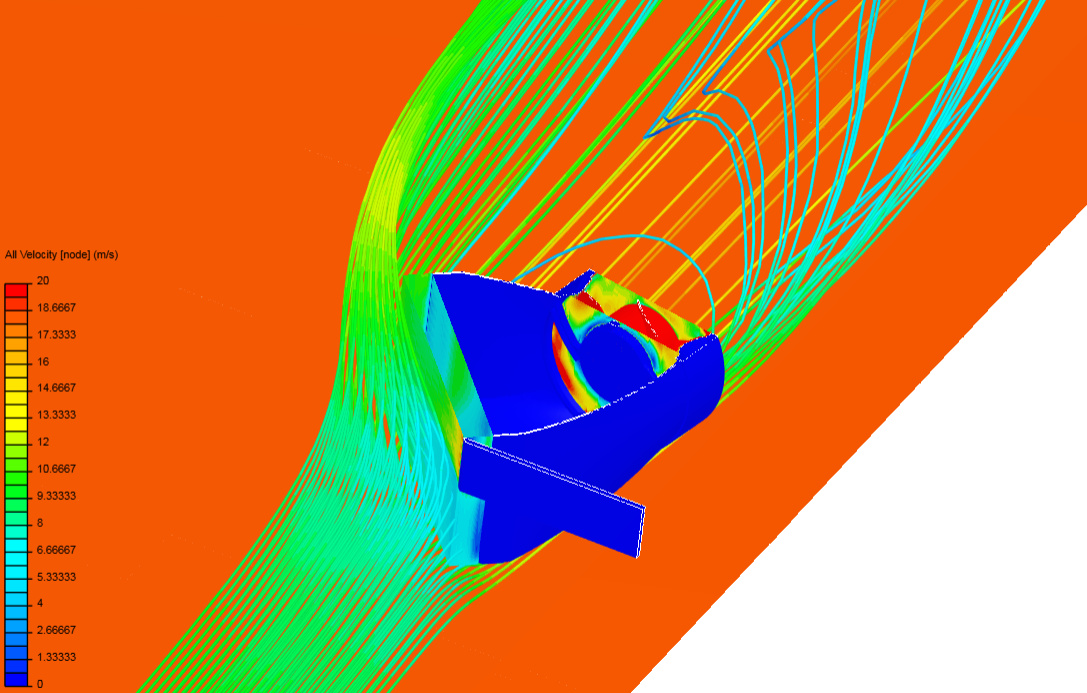
- In my straight on simulations, the velocity cutting plane shows a large increase along the edges of the radiator. Is this normal or did i set something up wrong in my meshing or simulation?
-
In the 50 deg angle porous media i setup a housing so that the square porous media would not get cut off by the bounding box. The pressure and velocity cutting planes show disturbance in these areas and i’m not sure how it will affect the results
-
The data to be selected can vary a lot. The tilted radiator is, in my opinion, very close to my actual data, and if I simply collect my simulated data from different points i can make it match almost exactly. Sampling from this location gives me -35Pa after the radiator wich makes my new pressure drop 660 Pa. How accurate must this actually be? there are so many variables. I also have 10.121 m/s as inlet velocity not face velocity. This will further change the measurements.