Pollution exhaust in a garage

Hi @grosua

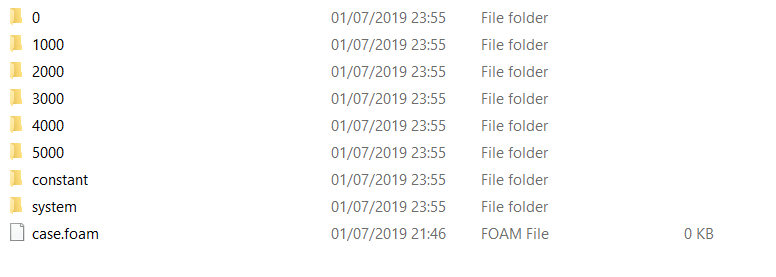
I am glad that helps you further along the road. If running low, don’t hesitate to ask me to run some of your sim, or we could ask Jousef. To download you simply go into the project I shared with you, in Run 2 there is a download button. It says 0 seconds but the results should be there, what you will obtain after downloading is this folder structure:

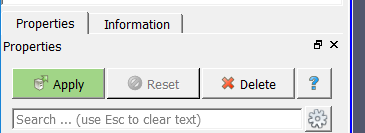
After starting paraview, you click open and select the .foam file, after opening the file, it is not loaded yet and you have to click on apply:
afbeelding

To get a cut plane, click here and adjust the normal vector and center location to your wishes:
afbeelding

afbeelding

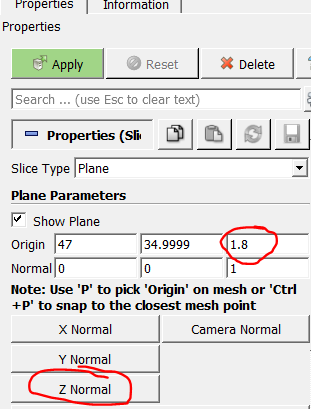
Don’t forget to click apply.

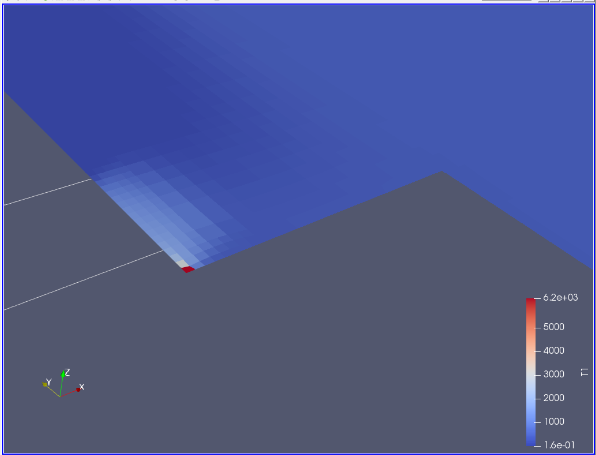
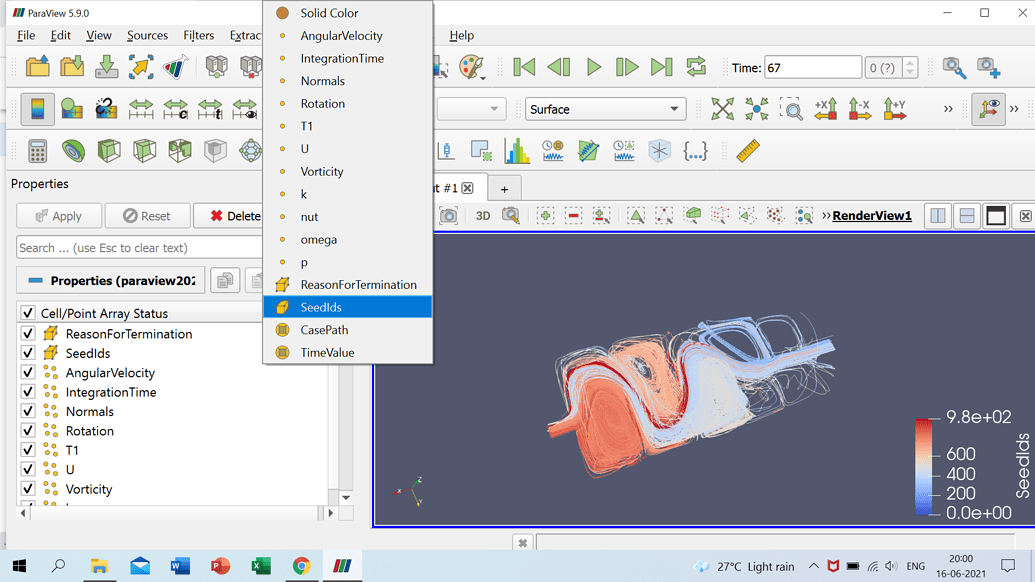
Now in the top you can pick a variable and its component if it has components:
afbeelding

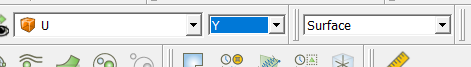
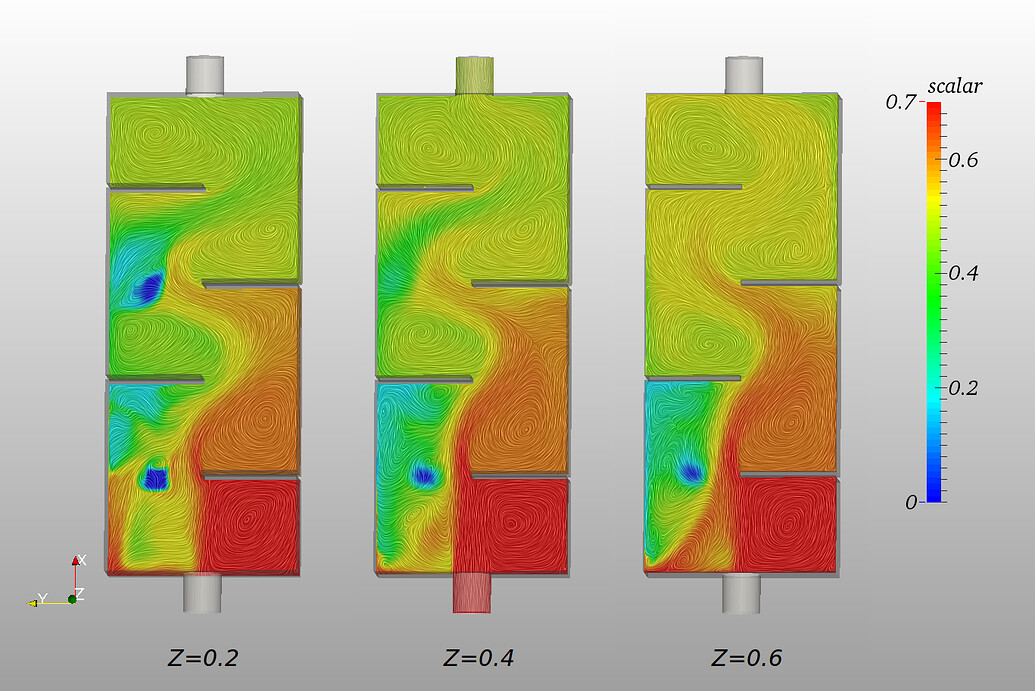
With this method you can get cutting plane results.

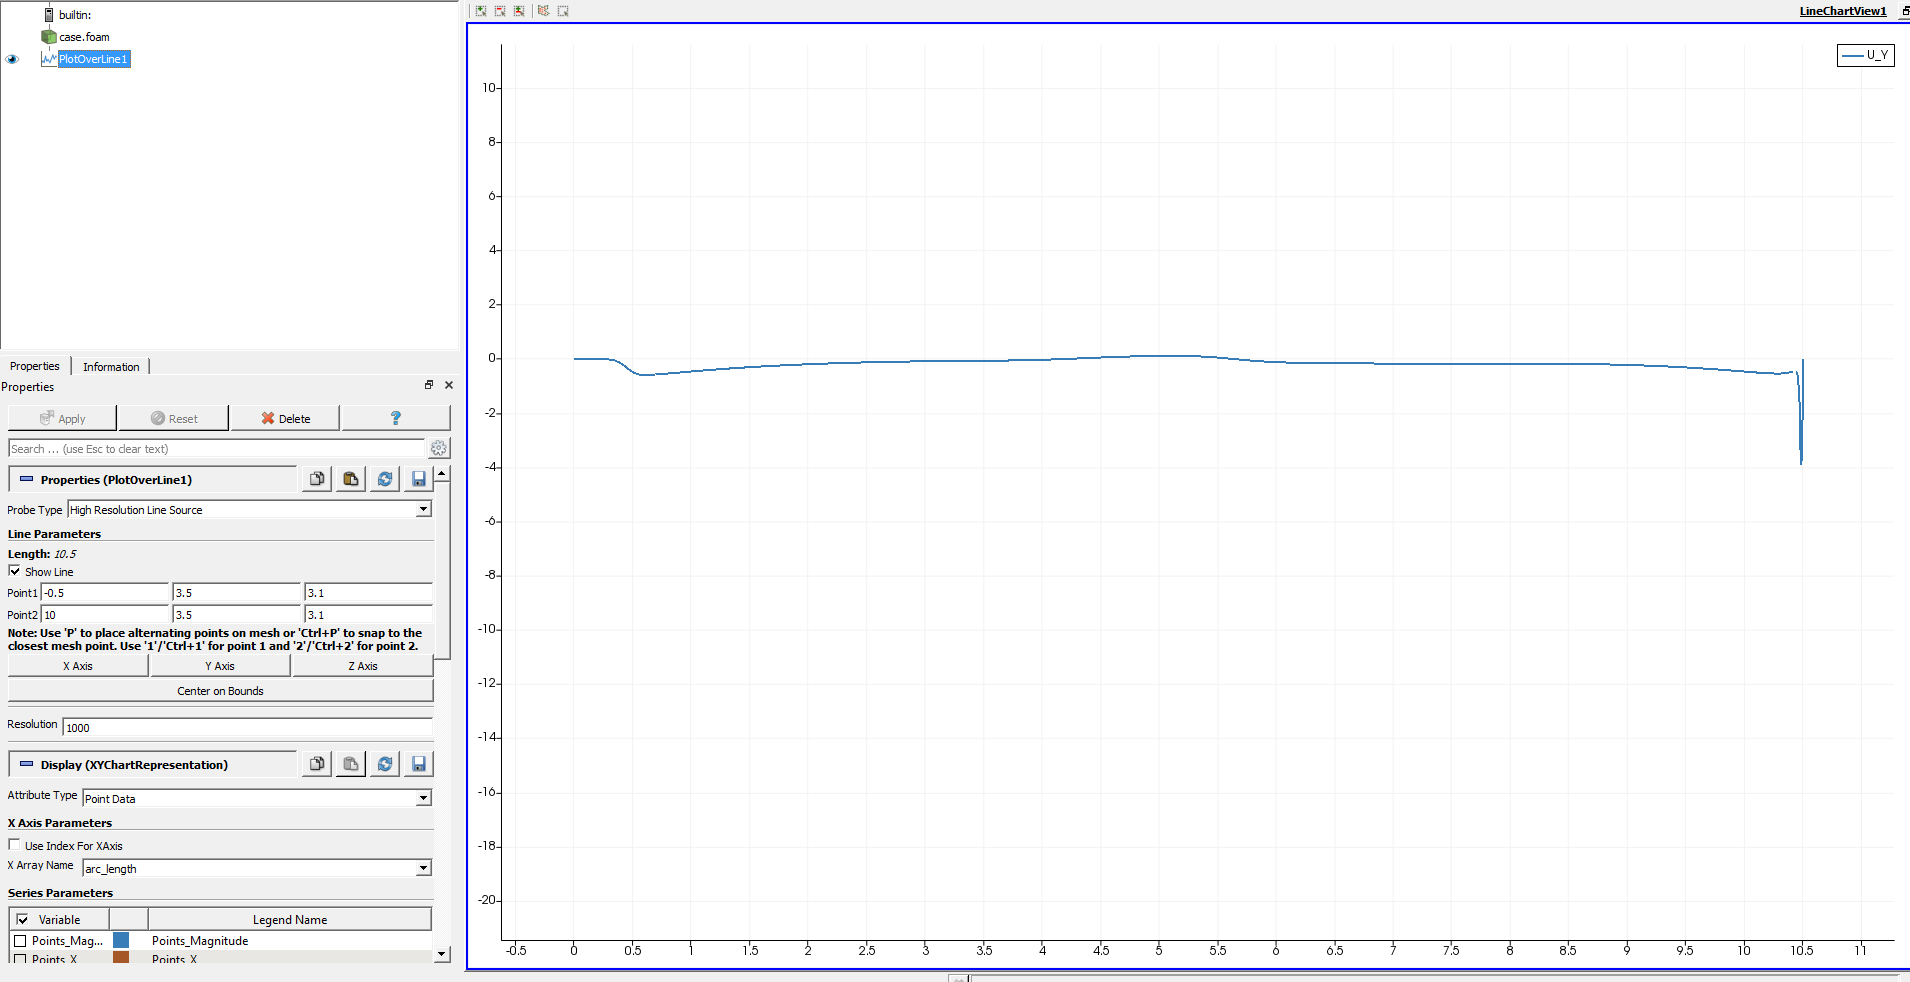
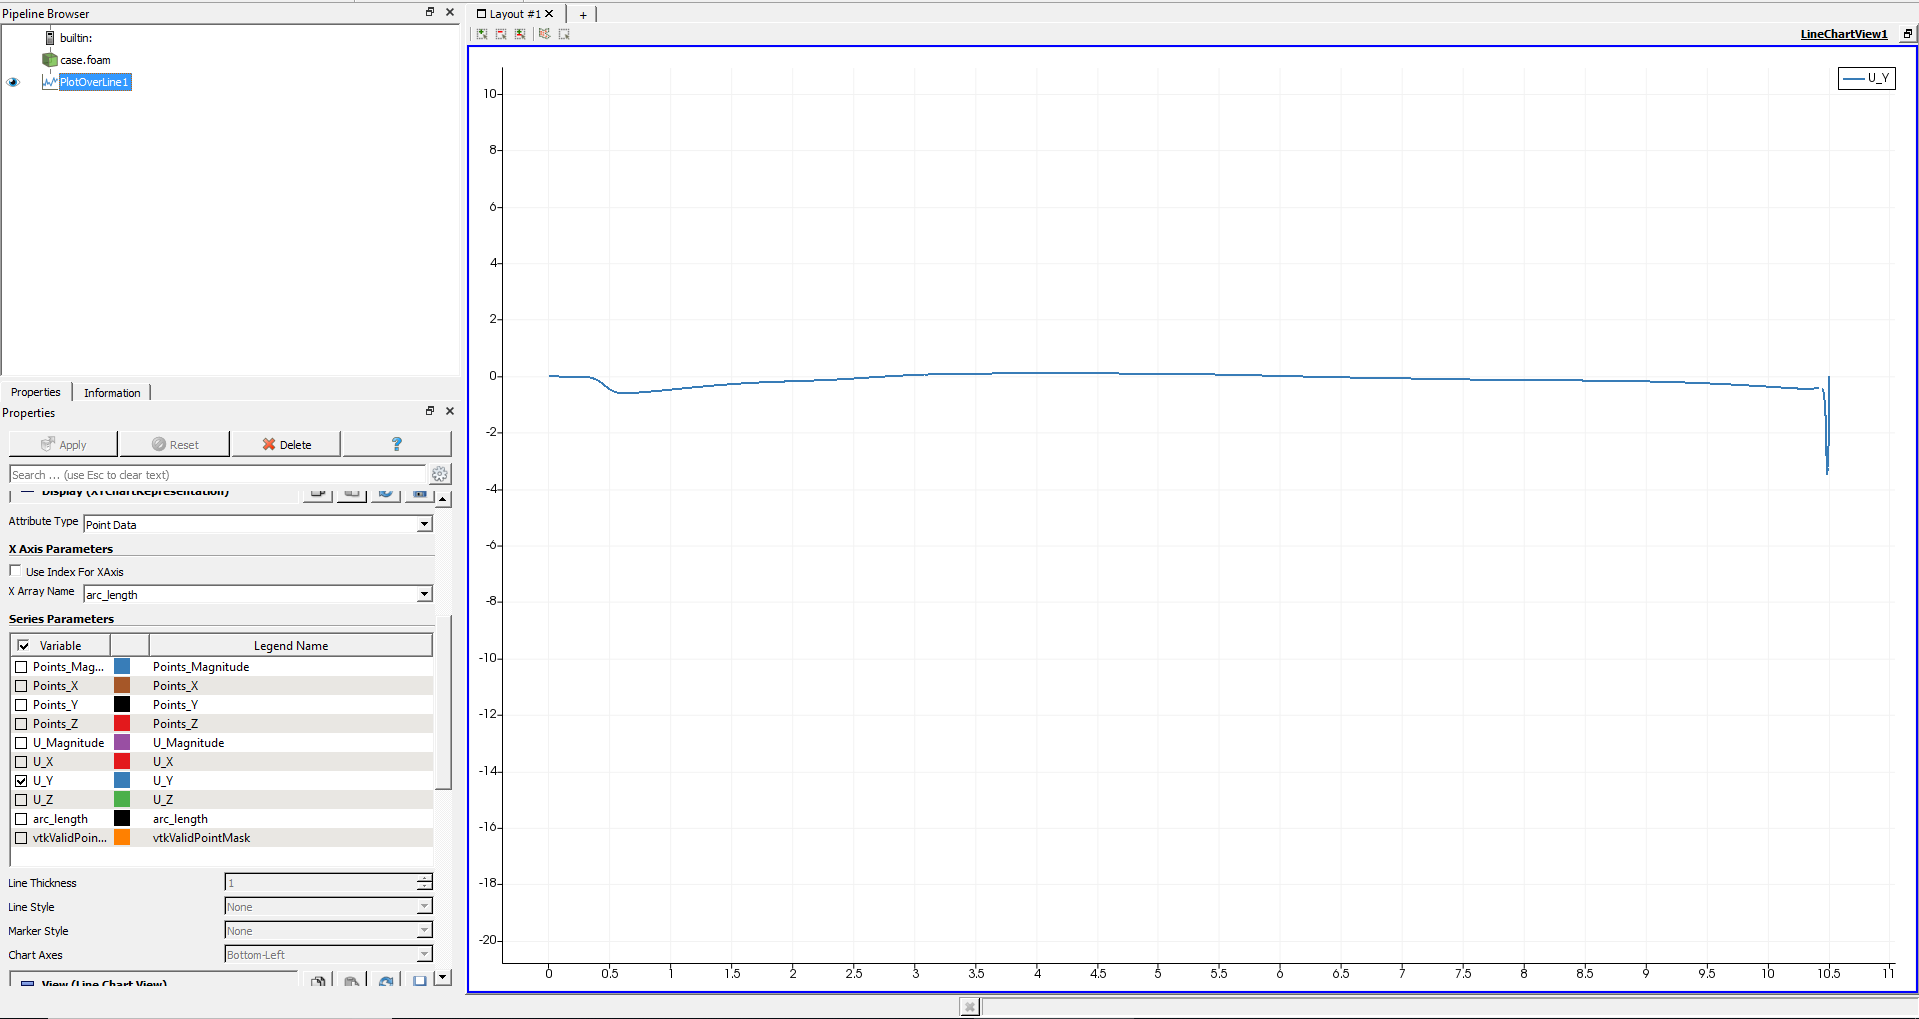
To get a line plot, you need to proceed differently. I deleted the slice that was just created and then clicked this buttonafbeelding

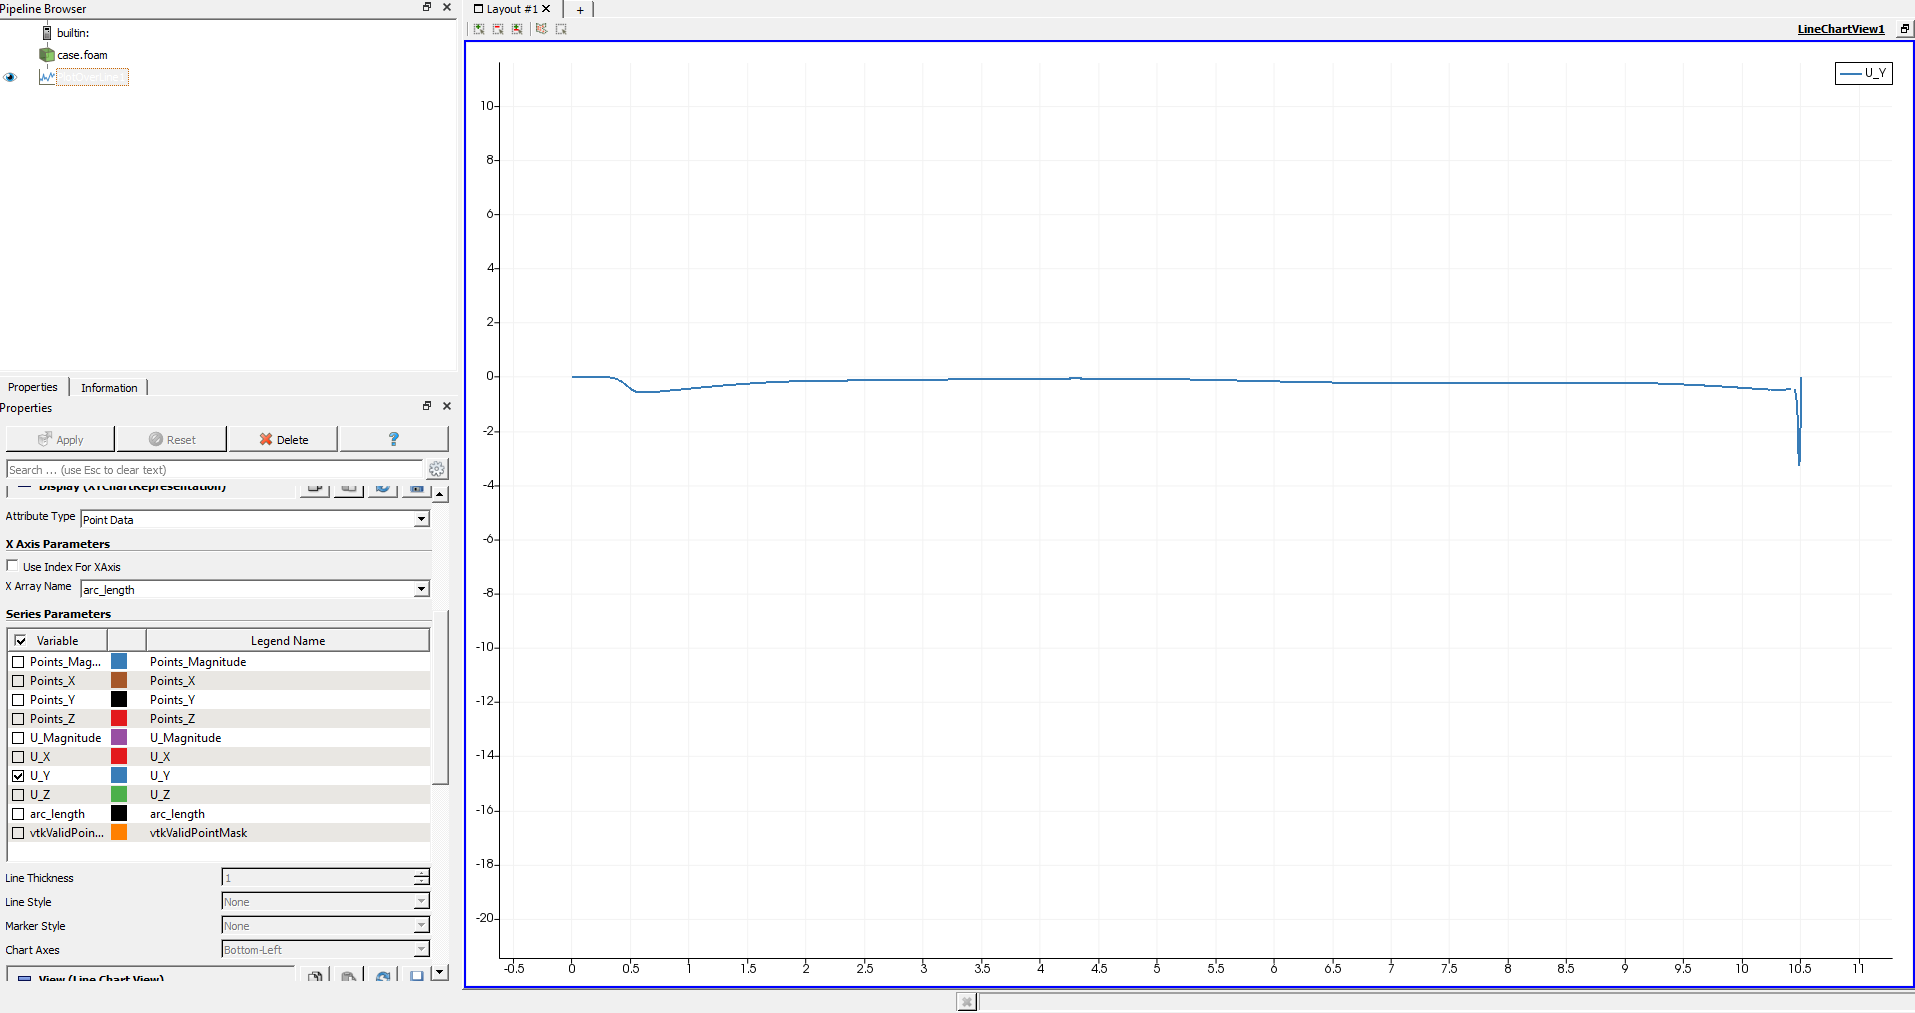
By default a line which goes accross your whole domain will be created, but you can change the start and end points to your own wishes. Every time when you perform an operation in paraview, do not forget to click apply. After applying the plot line, you will get something like this

And here you can see the T1 values around the order of magnitude 1e3.

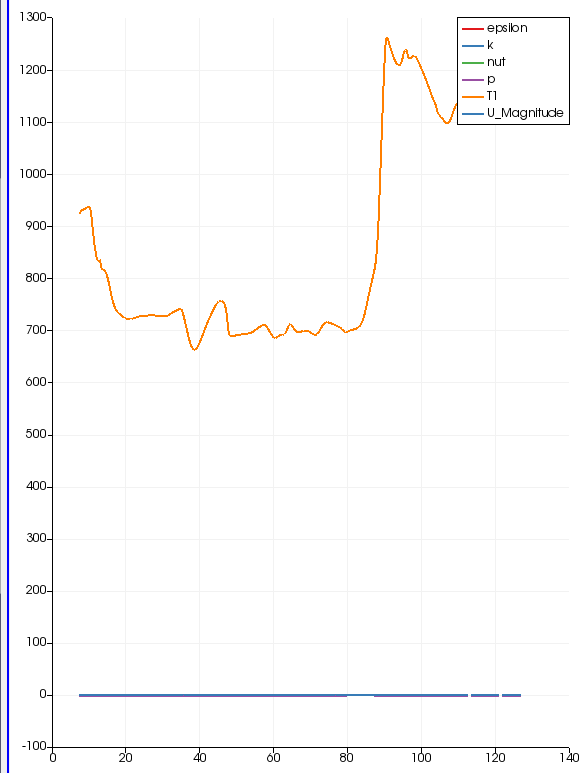
I will suggest to start from a simpler case and try to work your way to more complexity. With a smaller domain, you might be faster in trying to get the optimal sim settings and also to check how T1 behaves with mesh refinement.

Hope that helps,
Kind regards,
Tolga

4 Likes

Hi @tcakir

Thank you very much, for the detailed explanations, they were really helpful.
I really appreciate that you offer to help me to run the simulations, for now, I still have some hours, but I am wondering if there is no other way to request more hours? in order not to bother you guys with this.

I understand your point, to create a simpler case and establish the right parameters and mesh, and then run it for the garage, I will create a smaller geometry with the exact same features and study its behavior, I will let you know how it goes.

Thank you again, have a nice day!

@grosua I think @jousefm could perhaps help out on the hours. Jousef can normal users request extra hours? Using a simpler case, will give you a better idea, if you can converge T1 better in the first place and it also allows you to make yourself a trade-off in sim time and desired accuracy, regarding the T1 convergence.

Please let me know how it goes.

Have a nice day!

1 Like

Hi @grosua!

Thank Tolga for mentioning it! :wink: I will add a few CH to your account, make sure to keep in touch with Tolga so that you have an idea of what you want to simulate as these simulations can get quite expensive in terms of CH consumption. You should have some CH in about 5 minutes :wink:

Best,

Jousef

1 Like

Hi @tcakir and @jousefm

Thank you very much guys for helping me with this, you guys are awesome.
I already made a simulation on a simple geometry considering the parameters and the set up I have now, I will continue to refine the mesh a few times to check how is the simulation changing, and then we can decide what next steps will be. I will share this simulation with you Tolga, so you can also have a look, at first look it seems like T1 it’s converging a bit better on a smaller volume and its values seem right and in the same order of magnitude as in the initial simulation, maybe indeed there is a meshing problem because the volume it’s huge but let’s see how it’s evolving.

Kind regards!

1 Like

All props to @tcakir!

By the way, would be very nice if we have a well documented project from you in the end which people can find easily if they google for pollution exhaust in garage or anything similar to that.

Let us know if you have any further questions or concerns!

Jousef

2 Likes

@jousefm Thanks for helping increase the hours.

That would be a very great addition to SimScale, if there is a nice documented version of this project. Also relating the T1 convergences, could be something very useful, for all of us on the platform.

@grosua I just noticed, you are indeed making a small test project, that looks really good and I am already seeing some good T1 convergences. I am awaiting your results with great pleasure. If there is anything else, you know to find me :wink:

The original project, is big indeed and hence my request and advice for you to do a smaller test project yourself. We can always increase complexity, but better is to start from a simple I always think. Great you are doing that.

Kind regards,
Tolga

2 Likes

Hi guys,

@jousefm Once I am done with my thesis, I will be more than glad to sum up everything and put it in a documented article.

@tcakir Indeed, I made a small version of the garage and tried some things to see how it affects the simulation. By now I have run 3 simulations as it follows:
Run 1 - I kept everything the same as in the last simulation you set up and it seems like the convergence plot looks quite similar, all parameters except T1(really shaky) are converging well, the scale still seems a bit off, the max value of T1 is 13806 and all the planes are completely blue which doesn’t seem right to me.
I tried to rescale the values of T1 to max 500 to check where are the affected areas, and I found out something strange, there is this corner near the entrance, where it seems to be the highest affected area, which is pretty strange considering that is an open inlet to the exterior.

Run 2 I have spoken with a guy from the Support Team, regarding the mesh enhancement and he said that the mesh I have now it’s quite alright. If you think the mesh can be problematic, can you please let me know what kind of refinement will you apply to it?

Though this guy had also a look on the numerics and suggested to change the Relaxation Factor for the Passive Scalar Equation from 1 to 0.3, which I did and the convergence plot looks better, seems like T1 it’s converging the same way as the other parameters and it’s not that shaky anymore. Even though I just ran the simulation for 1k more iterations to check if it’s going to stabilize at some point.
The max value for T1 is 4516 and the cutting planes started to show how the concentration it’s changing inside the domain.

Run 3 In this run I kept the settings from Run2 and improved the mesh for the side faces of the pressure inlet to check if the problem stated above (Run1) will disappear. It seems like that concentration point near the inlet disappeared, but the max value for T1 went even lower to reach 884 and the cutting planes are showing even better how the concentration is changing in the garage. Though the convergence plot for all the parameters looks a bit shaky, do you think this is acceptable? I am planning to also run this simulation a bit longer to check if the convergence plot will look better.

Please let me know your thoughts about these simulations and what should I try to improve or change next?
I will also have a look at them in ParaView to check the T1 order of magnitude, and how the cut planes are looking there.

Thank you guys! Looking forward to hear from you !
Have a nice weekend!

3 Likes

Looking into your latest results now @grosua I will update this reply later on.

1 Like

@grosua great that you made 3 simulations, i think you are good along the way.

For run 1: i noticed indeed the shaky T1 convergence, luckily you seemed to have solved that by the relaxation factor, thanks for the support person that suggested that. Though it did cross my mind before too. T1 you saw is not the max I observed in paraview: I made 3 slices at height: 0.25, 1.5 and 3 and reported values are approximately 450, 400 and 400, except for the peak. There I do see just a very small area with a peak T1 value see figure below
afbeelding

Maybe running more iteration might resolve this problem. I am trying to figure out what might cause this. The boundary condition is the one from the original project, however a fixed value for the passive scalar is set. I am not sure if this is a proper boundary condition. I tried running inlet-outlet type boundary conditions but those did not converge so I just suggest to stick to the original bc and continue with these results, perhaps running more iterations.

Regarding mesh refinement let’s just stick to the current mesh, including more refinement at your inlet, also if the support person suggested that too.

The values in run 2 seem half of the values of run 1, however the flow field is also significantly different, because the flow field has converged more (4k in run 2 vs 2k in run 1). So it is natural that T1 is going to be differen too.

Personally, before continuing I would rather check if your velocities do converge depending on number of iteration. If your velocity changes by 10% if you add a few k more iteration, i would really suggest to do more iterations as you may imagine that makes more sense.

For post processing , I am having difficulty with the in-browser post processor, so I strongly advice paraview.

Maybe it is good to see how the velocity profile along a fixed line develops with increasing number of iterations, and see if it converges truly, before deciding what is a good number of iteration, because the flow field is really what decided the values for T1 at the end.

PS: If you need any help on post processing in paraview let me know, so I could help you out with that perhaps. Regarding values, I think you are going in the good direction with Run 2 and Run 3, even if the values are oscillatory, the order of magnitude of T1 has decreased to lower values, than we were initially at (1e-2). That is important of course.

1 Like

Good morning @tcakir

Thank you for taking the time to have a look at the simulations.

Regarding the T1 peaks, indeed the ones I mentioned are only found near that small area at the main inlet, and the values across the domain are smaller. I also played with ParaView after writing the previous post and observed this. In my opinion, I think the reason why the in-browser results look weird is that small area where the max value for T1 it’s showing, I will further investigate what can cause this problem.

Ok so for further simulations, I will keep in mind the following things.

  1. Keep the same mesh, with small refinement if really needed.
  2. Check how the velocities do converge depending on the no of iterations. If changes higher than 10% appears, run it longer.
  3. Identify the right no of iterations to run

I totally agree with you, if the flow converges well, then T1 should also have good values. One thing, by “check how the velocities profile along a fixed line develops” you mean to use the “Line plot” function in paraview and see how the plot looks for different no of interations?

For now, I will continue, to run for longer Run2 as it is the only one, which allows me to continue from the last iteration, it seems like there is a problem with this feature and they are taking care of it, in order not to lose CH.

For now, I can handle the simple stuff in paraview if I will encounter any problems I will let you know. In the meanwhile I did a little practice in paraview and explored some of its functions, it’s quite impressive how you can manipulate the results.

I am glad this is heading in the right directions, this would not be possible without your help along the way. I really appreciate you being as enthusiastic about this project as I am.

Kind regards!

1 Like

Hi again,

A small update, I have run simulation Run 2 for 3k more iterations and it seems like the velocity values went down with an average of 30 %, and T1 decreased with almost 67 %, you can check out the values in the picture below.


What do you think ? should I run it for another 3k to check what’s happening?

Greetings!

1 Like

Yeah I mean use the line plot, say at a fixed height all the way from the inlet(big inlet) to the wall where you have an outlet, at constant height. And you can try to see if the y velocity components, converge really.

I am really glad to help out and am curious to your further results.

Just as a question, is a mesh independence study also part of your research? Usually in cfd, it is common to compare some quanity, whether it converges, when the mesh size decreases. It would be relatively easy to do in the simple test case we are looking at right now. So it also gives us a view of, how the velocity develops, with finer mesh.

About your results in your second post, about number of iteration versus Ux,Uy,Uz and T1, what do these velocities mean? Are they point values?

The changes you mention are very significant changes, I think. Yeah please run another 3k and see how those compare to 7k. Can you report the residuals too, of those 7k and 10k (that still need to be done)? I am curious, I thought the residuals went pretty low already, maybe I did not see that clear yet.

Kind regards,
Tolga

1 Like

Good morning @tcakir

Alright, I will give it a try in paraview today and post the results after that.
Regarding the mesh independence, it is not really a part of my research, but if you think it can help us to figure out how to set up this simulation properly then we can give it a try.

I took the velocities in the previous post from the convergence plot(residuals), at 4k and 7k iterations, I will run it for 3k more iterations and post the results here.

Is this what you mean by “I would rather check if your velocities do converge depending on number of iteration” to compare the residuals values between different number of iterations ? I am not sure I understood you well.

Kind regards!

Hi @tcakir

I think I made a mistake last time when I was calculating with what percentage the values of the velocities changed, I did some new calculations, you can have a look here: link

I also created 3 plot lines for Uy at 4k, 7k, and 10k iterations as you indicated from inlet to outlet at a constant height of 3.1 m
I am a bit confused, there is not much changing in the plot view between different no of iteration, I can’t say what’s really happening there if you please can have a look, maybe I am doing something wrong.

4k iterations

7k iterations

10k iterations

What do you think should I do next? Should I run it longer?
Thank you !

Greetings

Hi @tcakir

Did you had a chance to have a look at the results ?

Have a nice evening !

1 Like

@grosua I am going to have a look today, will update you later

1 Like

Hi @grosua

Regarding mesh independence is always a very important aspect of any CFD study, but again it depends on what kind of accuracy and deep insight you are looking for. Usually it is a no-brainer in involving it in your study I think.

I understand where you got your velocity values from, you actually showed the residuals of the velocity, but I meant what you showed in the post 4d ago, where you plot the velocity along a line in the domain.

What I would like to see is, if we plot this line multiple times, each time at a different increasing number of iteration. At some point, will it stop changing significantly. I do not know if that makes sense. So here a quick sketch of what I mean:
afbeelding
So in this graph, suppose on the horizontal axis is the x coordinate, and y axis is for example the velocity of the fluid in y direction Uy. Red line is theortically the exact solution. Orange line is solution after 3k iteration, green after 6k iteration and blue after 9k iteration for example. You can see that with increasing number of iteration you get closer and closer to the exact solution. Take note, this is not related to mesh independence, though you can make a similar study for mesh independence in this way.

So what you showed in your post is what I am looking for. If you could plot them in the same figure it would make more sense, so you can see how the 3k iteration velocity profile, is relative to the 6k and 10k and so on.

Just looking at those values, it seems like the value does not change significantly, so regarding number of iterations I think it is good.

Also the residuals you showed previously, would seem for me satisfactory regarding the convergence of the flow field, with respect to number of iterations.

So I think we can proceed with what you want to achieve initially. The test case is done for now I propose, if needed we can take a look later. I think we could now run, a more complete simulation, with the things we have learnt so far. For example the T1 relaxation factor and number of iterations?

If you tell what direction you want to go into, that might help.

Kind regards,
Tolga
Ps: sorry for late reply

2 Likes

Hi Tolga,

You are right, the mesh independence it’s a very important thing for any simulation and I understand the impact it can have in the results, but like you said it’s depending on the level of accuracy you are looking for, even though I want my results to be as close as possible to the real process, I am not looking for a high level of accuracy here because this study will not be implemented in the real life. It’s just a study, of a ventilation system which is already validated and used a lot these days, meant to prove the power of CFD in the validation process and to enhance my skills within the software.
One plus here is that I have copied an existing study, where the mesh was already tested in order to obtain decent results, this means we had a pretty good start with the previously used mesh settings.

Now it’s very clear for me what you wanted to achieve and observe with this line plots at different no of iterations. I will keep this in mind for the next simulations as it can be useful also to study mesh independence.

Indeed I should have plotted them in the same figure, so they can be easily compared, but I did;t new exactly how to do that I ParaView so plotted them independently.

Considering the important insights we learned in the test simulation and also your interpretation of the results, as you suggested, I will prepare a new simulation using 10k as no of iteration and a relaxation factor of 0.3 for the real garage.

During last week I have checked the preliminary results with my guiding teacher, and he seemed happy with the results, he also suggested a new approach for the inlets and outlets in the garage, I will also change this in the geometry and prepare it for the new simulation.

I hope that it’s more clear also for you what I am trying to achieve with this simulation. As for my thesis, I want to study the efficiency of the same ventilation system, having two adjustable levels of the fans, the first level will handle the CO dissipation (level 1- 75k m3/h) and the second level will handle the Smoke extraction (level 2-150k m3/h). Besides these two cases, I also want to add jet fans for each case, in the areas where recirculation of the air will appear, in order to improve the ventilation system. It will result in 4 simulations as follows.

Scenario 1: CO dissipation
a) default ventilation system (inlets/outlets) - current simulation we are working on
b) default ventilation system (inlets/outlets) + jet fans

Scenario 2: Smoke extraction
a) default ventilation system (inlets/outlets) - I also have started with this one in the meanwhile
b) default ventilation system (inlets/outlets) + jet fans

Thank you very much Tolga for helping me with the simulation, you are a great guy, I really appreciate your effort to help me. I will let you know when I will have some new results.

Kind regards

3 Likes

Hi @tcakir and @jousefm
I am working towards validating a Simscale-Paraview Project for my Undergraduate Capstone Project similar to the ones discussed above:
https://www.simscale.com/projects/Ali_Arafat/water_purification_process/

I have obtained the results until the velocity streamlines on ParaView but am unable to obtain the scalar distribution of water contamination. I believe it is something to do with the T1 variable however it’s unclear as to how it was done. I would be extremely grateful for your help.
The scalar distribution output is expected to look like this:


I have obtained results until this stage:

I have granted access to my project should you require it:
https://www.simscale.com/projects/ameethhp/water_purification/
You must received two invites, please refer to the latest invite. Thank you!