Dear All,
I would like to do a simulation as described:
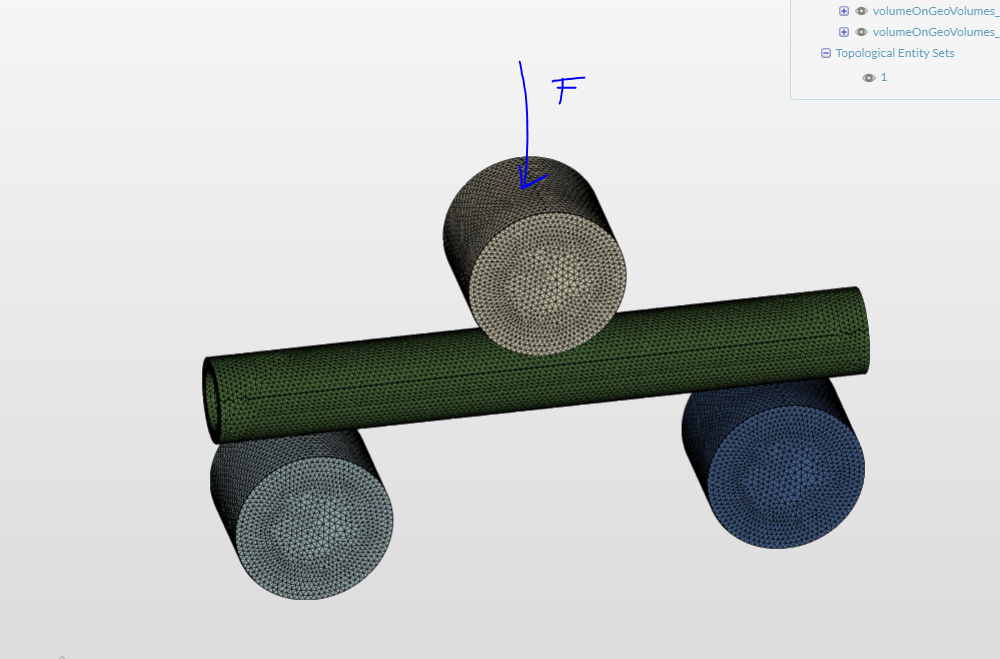
there is a 2 point support system, and a tube we want to bend with the top cylinder moving down then hold the load then release for a bit, and again this cycle until it passes plasticity (simulating fatigue in the same time),
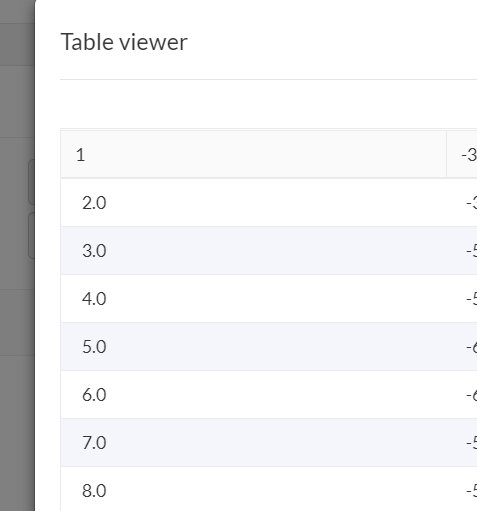
using the time and force is given in a table.
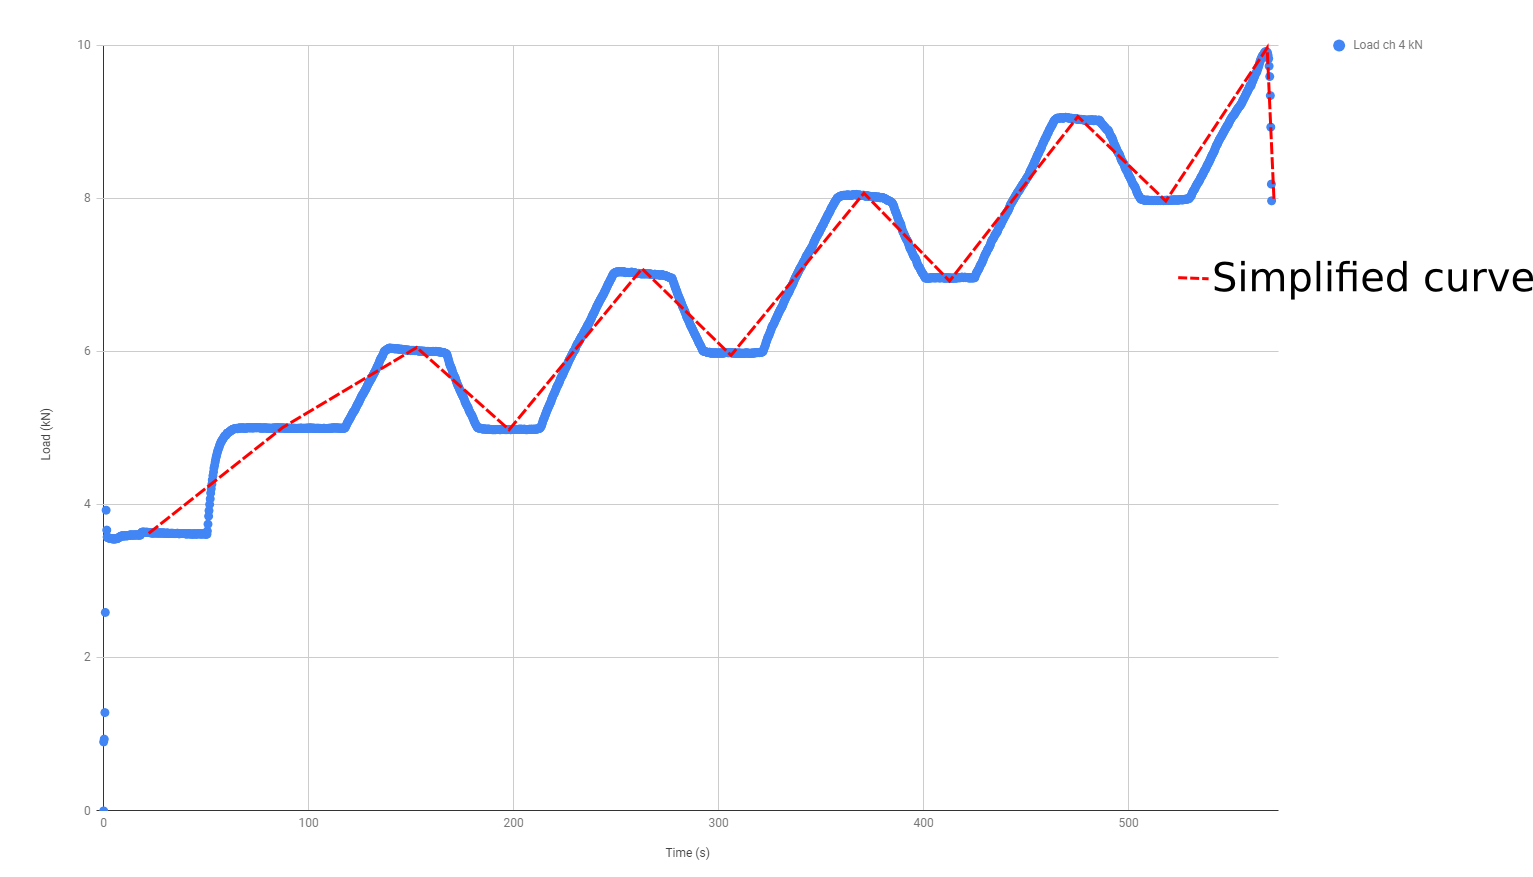
please see attached load and time chart for more understanding.
I was able to set up this layout for static analysis and with 1 load, but was not able to do it for dynamic analysis.
or shall I use static simulation
with -non linear analysis ?
thanks a lot,
Regards,
Richard
dear @jousefm , you did many ‘similar’ simulations.
many thanks for your time 
Hi @tenshinshoden!
You could do a .csv upload of your load over time sheet and do a nonlinear static analysis if you like - that should work.
I am tagging @BenLewis, @cjquijano and @ggiraldo here, maybe they can give you some more input.
Best,
Jousef
Bruno kindly helped me to set up the simulation, but it is not working with ‘the load over time table’
Hi,
Could you link here the latest project that @anon94132533 shared with you, so we do not need to start from scratch?
Best,
Richard
Hi @tenshinshoden,
I took a quick look at your setup and I noticed two things.
- Your running a Static analysis so time is not relevant (think of it more as solution steps not actual time). Your simulation runs from 0 to 1 with .1 time step. Your load table goes from 0 to 214. One issue is that the table can not have a 0 time in it, but the other issue is that your simulation is over before any load is really applied. I modified you table as shown below and then I ran the simulation from 0 to 8 with a step of .5.
- The other issue I saw is when the solution starts, initially the pressing rod is unstable. I added an elastic support to this part.
Let me know if this helps at all.
Good Luck!
Christopher
Hello @cjquijano,
Many thanks for the reply. Will have a look at it tonorrow
So how could I simulate the Time-load diagramm stated in the first post?
Thanks
Richard
Hi @tenshinshoden,
If you need to run the loading for 214 seconds then your only option will be a Dynamic analysis. I am not sure what you will gain when you are just sitting at each load for 30-45 seconds. Typically a timed based Dynamic analysis is for when you want to capture vibration, inertia loads, or some type of quick load/unload scenario.
Christopher
Dear @cjquijano ,
this real test been done in a test laboratory for the pipe specimen and I need to make the simulation according to that time-load chart.
basically they meant to represent some fatigue behaviour with these steps as 1 cycle:
-load up
-keep the load
-reduce load
-keep the load
then again the same process.
thanks a lot
Hi @tenshinshoden,
a few comments:
- Is there any reason why you do not want to use symmetry in your model? The model that @anon94132533 shared with you works and uses quarter symmetry, which reduces the runtime by at least a factor of 8 and also simplifies the simulation setup and reduces numerical difficulties. Please move on from this project: Pipe bending - SimScale Support by rszoeke | SimScale
- Regarding your load history. If you use a static analysis without any strain-rate dependent material model or creep, there is no need to replicate the exact load curve from the lab test. As the load changes very slow, I do not expect any dynamic effects playing a significant role. Thus you can simplify your load curve to a simple “saw tooth” curve:
Most importantly you do not need to calculate 1000 time steps, just use the one that are needed to capture the simplified curve + nonlinearities correctly.
- Finally, do you have a nonlinear stress-strain curve for the pipe material - without that, there is no point in doing this load cycles at all.
Hope this helps.
Best,
Richard
dear @rszoeke,
-I started it with that quarter model
-I tried to specify the load over time and getting error results.
(can you give me an example how would you do it for the above diagram /the ‘saw tooth’ curve)
It seems I am really missing here something 
I managed to upload the stress strain curve, and seem top be working for a simple 0.175t function (for the displacement Y direction as Bruno did it)
thanks,
Hi @tenshinshoden,
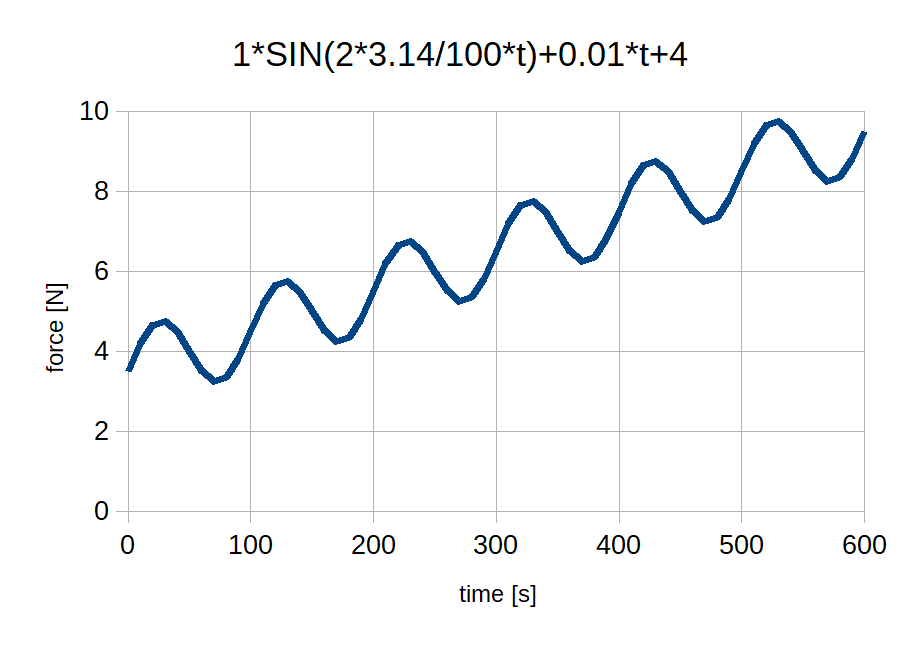
You can control your load profile with a formula rather than a table. I find this more convenient in most cases because you can make changes on the fly without having to generate a new table each time.
For example, the following equation will produce the load profile you require.
-1 * SIN(2 * 3.14 / 100 * t) - 0.01 * t - 4
The general form is:
A \times sin(2\pi/T \times t) + m \times t + c
where:
A = amplitude [N]
T = period [s]
m = slope [N/s]
c = inital offset [N]
sorry, cannot see the table properly.
thanks
wow,
thanks a lot, like your solution!
how do I set up the 600sec simulation time?
thank,s
richard
hi,
how would you set up that time steps and the saw tooth lines?
I am really struggling with it.
thanks
dear @BenLewis ,
I cannot get it done even for a small pipe bending simulation

To terminate the simulation after 600 sec go to Simulation Control > Timestep definition > Details and set Simulation interval to 600 seconds.
Hi @tenshinshoden,
This project demonstrates how to use the load profile formula.
[!!!THIS LINK IS NO LONGER AVAILABLE!!!]
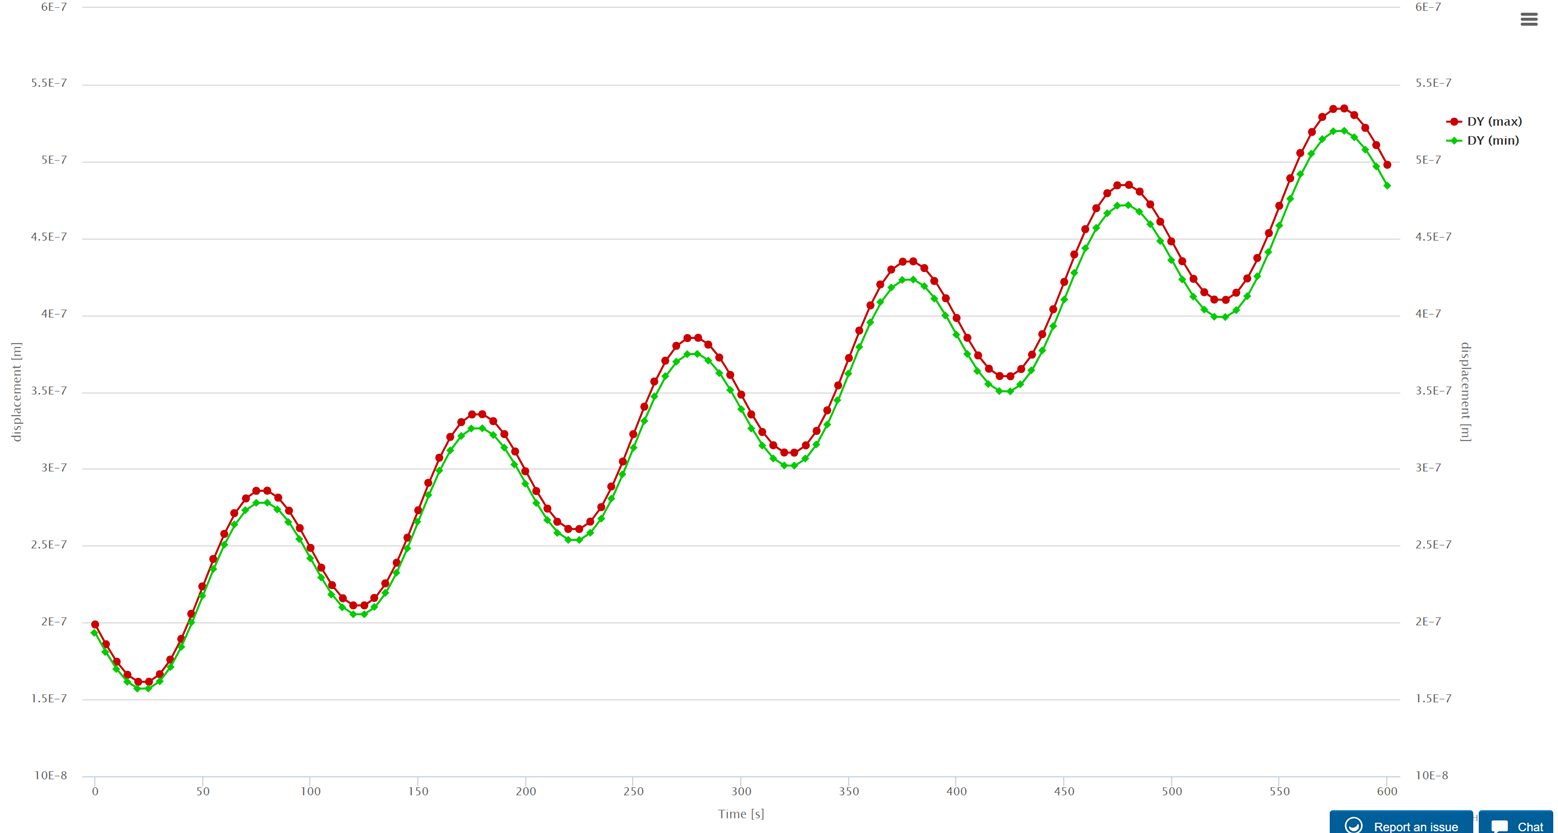
Here is the displacement plot.
Note, I had to reverse the signs in my original formula, as the load was going in the wrong direction.
thanks a lot.
Just a question,
Why did you use local force?
Thanks
The remote force is not important. It was simply used to demonstrate the use of the equation load profile. It can be done with a regular force also. I have updated my project with another example.
The remote displacement is required at the support so that no stiffness as added (equivalent to pin joint).
However, using a load profile like this, in a linear static simulation, has no real value because you cannot learn anything more from 60 load steps than you can from one. The resulting stress is always linearly proportional to the load. So I am sharing this simulation to help convey the concept, you will need to adapt this to your own (presumably non-linear) application to get the results you need.