Optimizing mesh quality and Y+ layer formation on an FSAE car

thanks for the advice!

yea i am currently working on the squished cells by increasing the distance of the first region refinement level from the geometry.
Test 1.9 has level 9 at 0.001
Test 2.1 has level 9 at 0.005
Test 2.2 has level 9 at 0.01

I have also added decreasing levels as the distance from the geometry increases but im not sure if they are getting overwritten. Im going to finish my report of test 1.9-2.2 and report in a bit

RW Test 1.9

Changes:

  • Suggested to change the bounding box to 1m
Level 0 (calculated) 1m
Level 1 0.5m
Level 2 0.25m
Level 3 0.125m
Level 4 0.0625m
Level 5 0.03125m
Level 6 0.015625m
Level 7 0.0078125m
Level 8 0.00390625m
Level 9 0.001953125m
Level 10 0.0009765625m
Level 11 0.0004828125m
Level 12 0.000244140625m
  • New boundary layer calculation to increase average Y+ values

0.001953m * X = 0.00182182m

0.00182182m /0.001953m = X

X = 0.932

Inflate boundary layer settings - layer calculation Y+ Value
Layers 3
1st 0.001078 Y+ = 50
2nd 0.0014014
3rd 0.00182182
Overall thickness 0.00430122 Y+ = 200 = 0.004311
Expansion ratio 1.3
Min thickness 0.001m
Final layer thickness (RATIO) 0.932
Relative 0.932
Absolute 0.00182182
  • Region refinements added as distance from geometry in addition to wake boxes
  • Trailing edges surface refinement level reduced
  • Wing surface refinement level reduced

Results:

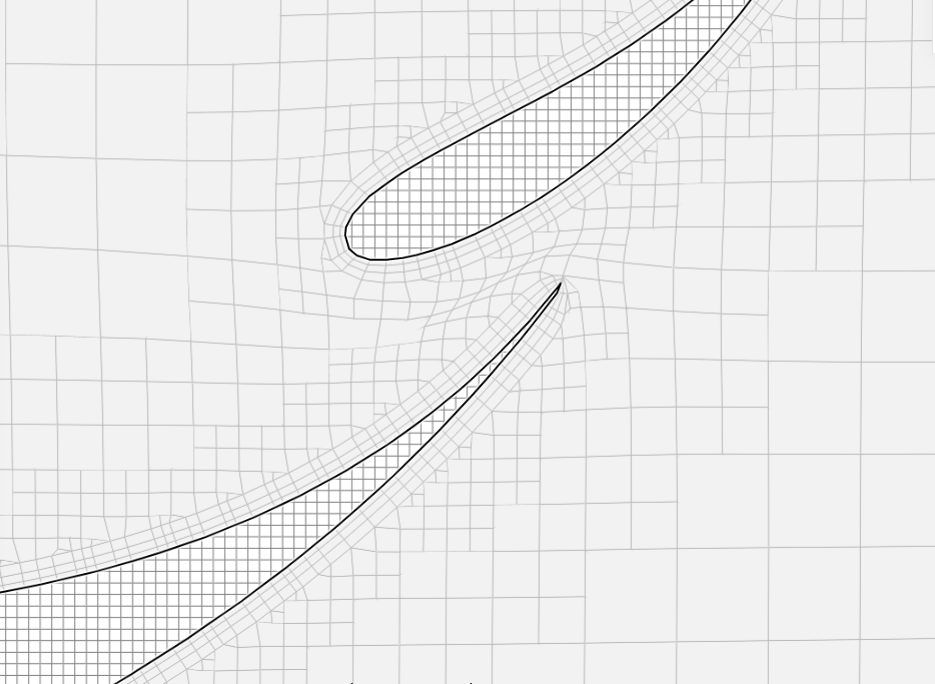
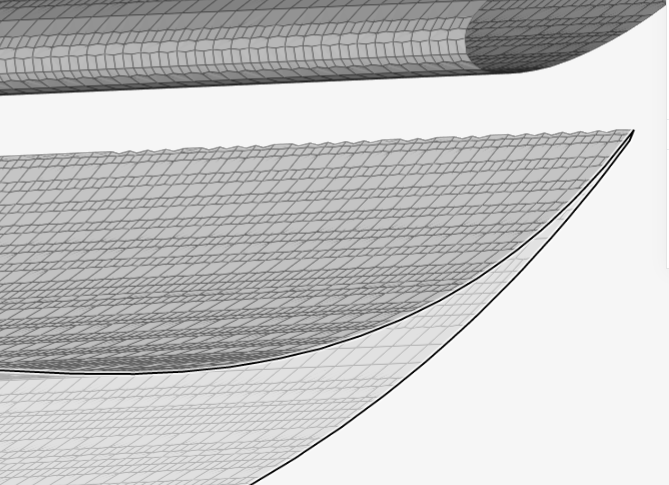
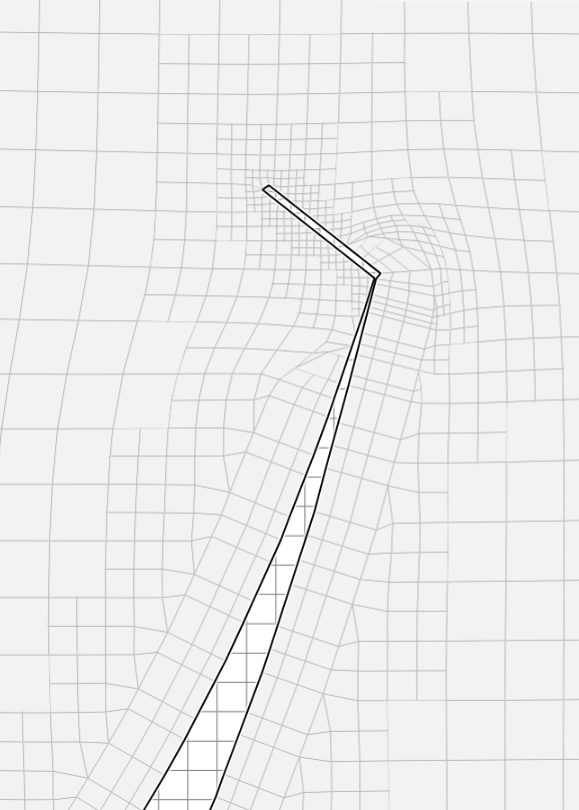
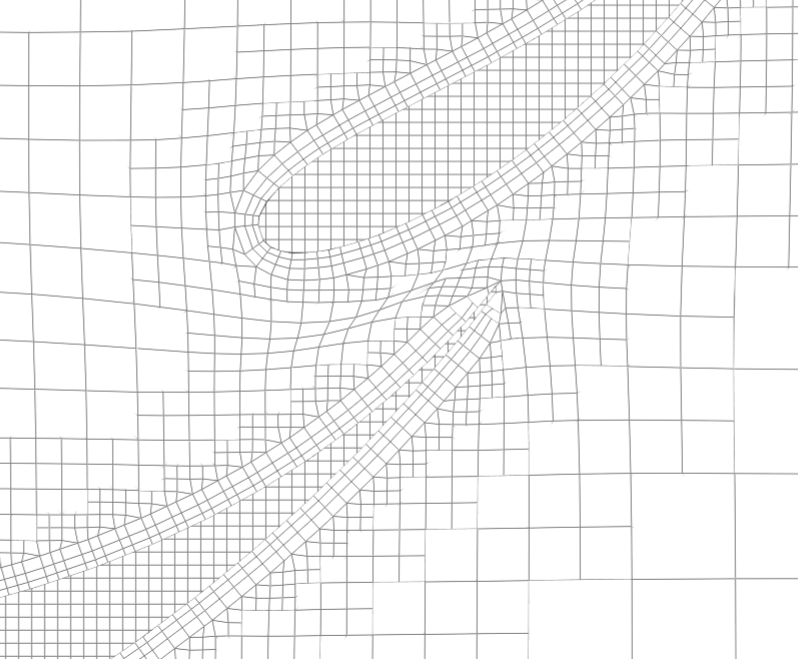
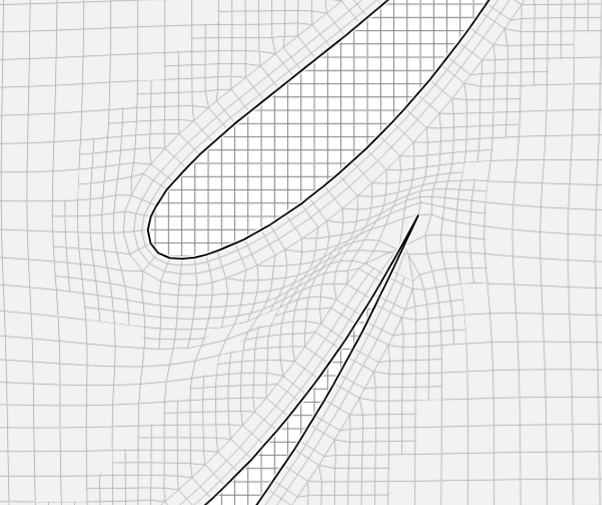
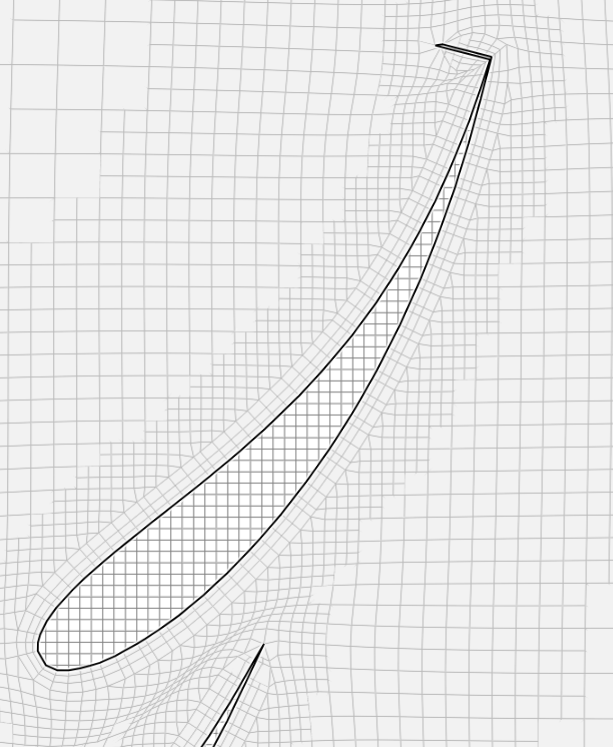
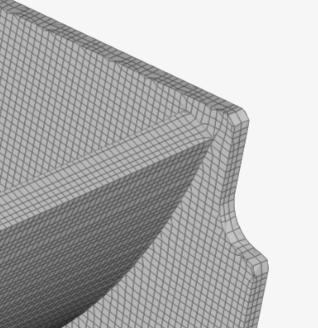
Test 1.9 Pic 1: Cell squish between main wing and elements. Not many cells shown of level 9 region refinement at 0.001 - must increase distance from geometry.

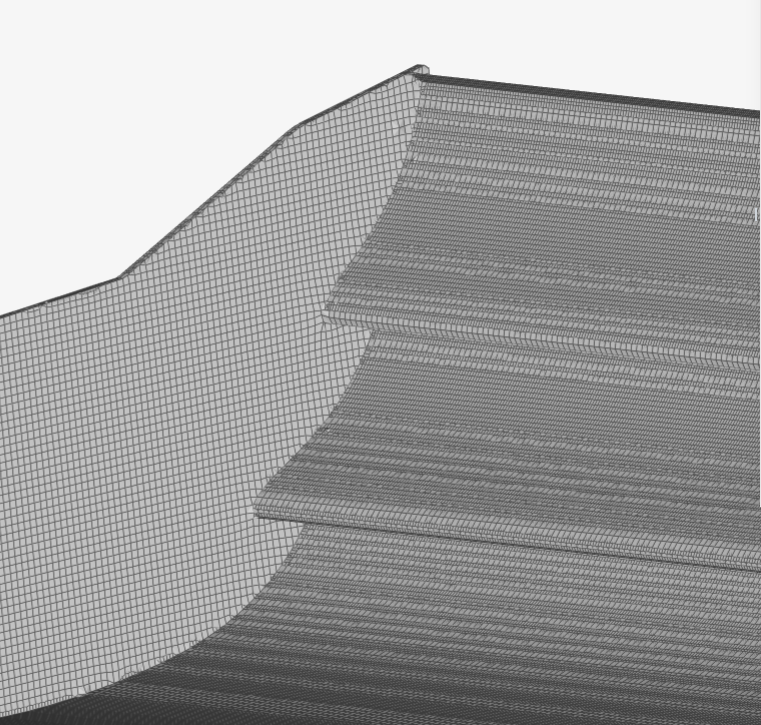
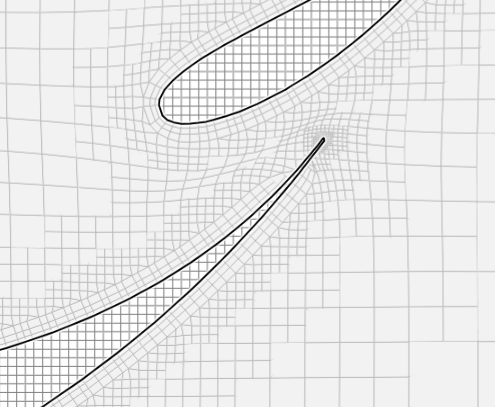
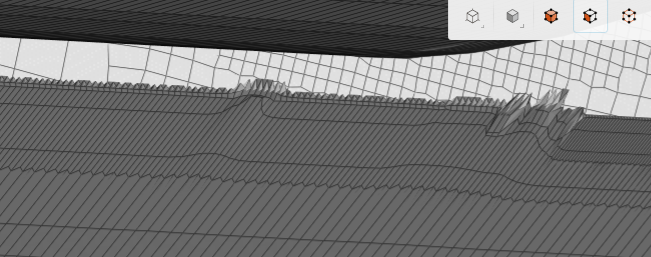
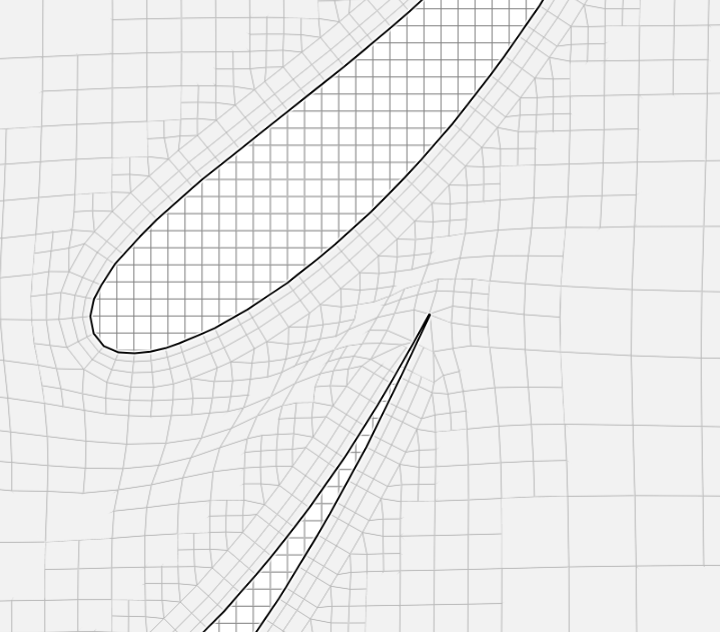
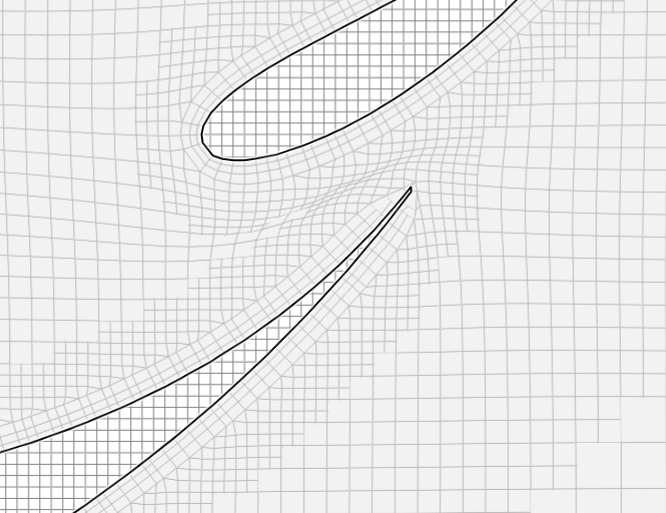
Test 1.9 Pic 2: Cells are not even along wing surface - solutions could be adding feature refinement or unequal min max of refinement

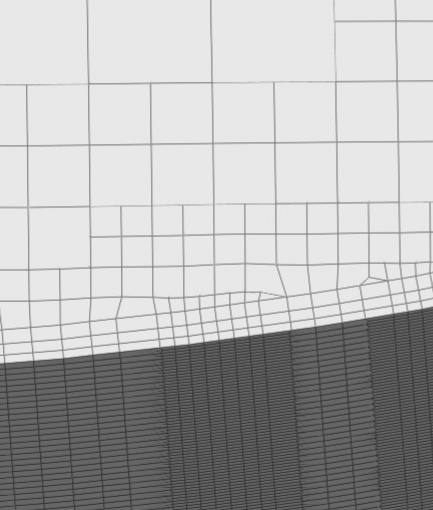
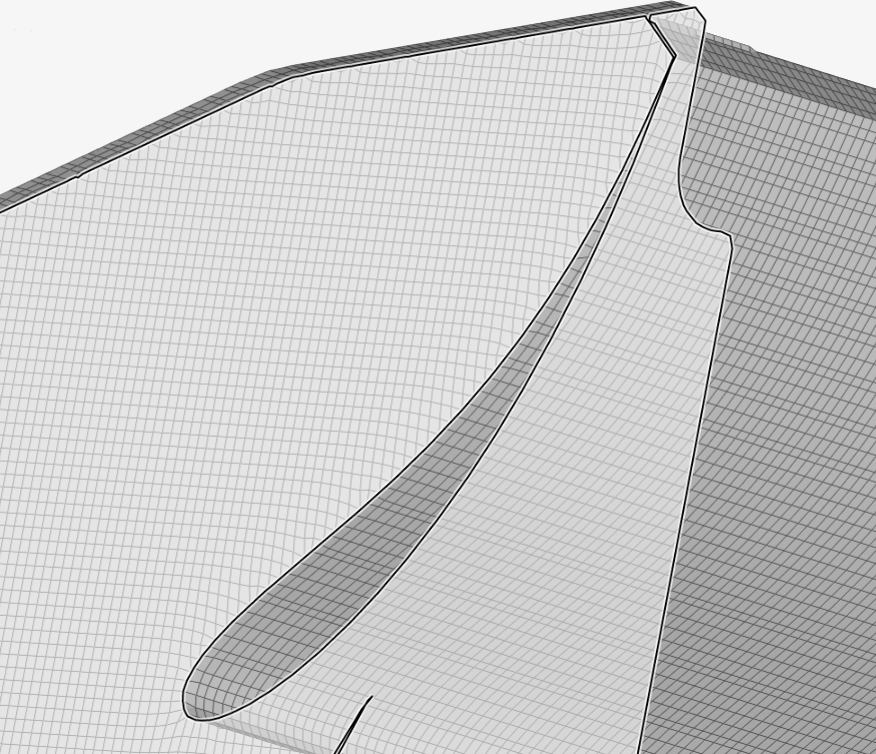
Test 1.9 Pic 3: Shown again the surface refinement levels of the wing surface affect the boundary layer cells making unequal cell sizes - no bueno

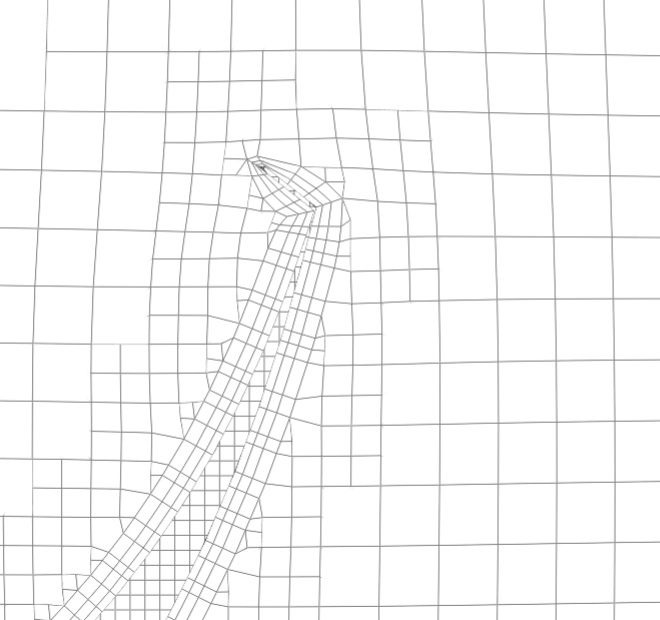
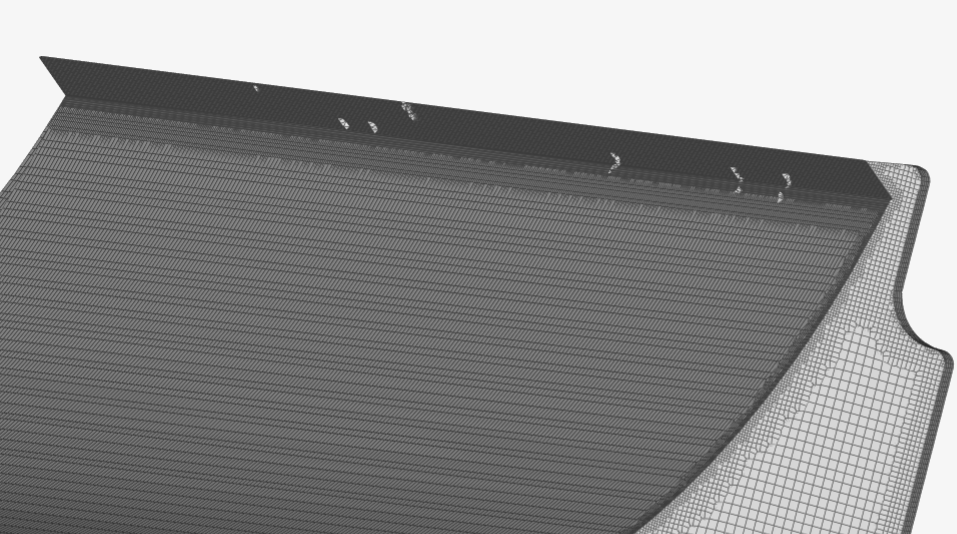
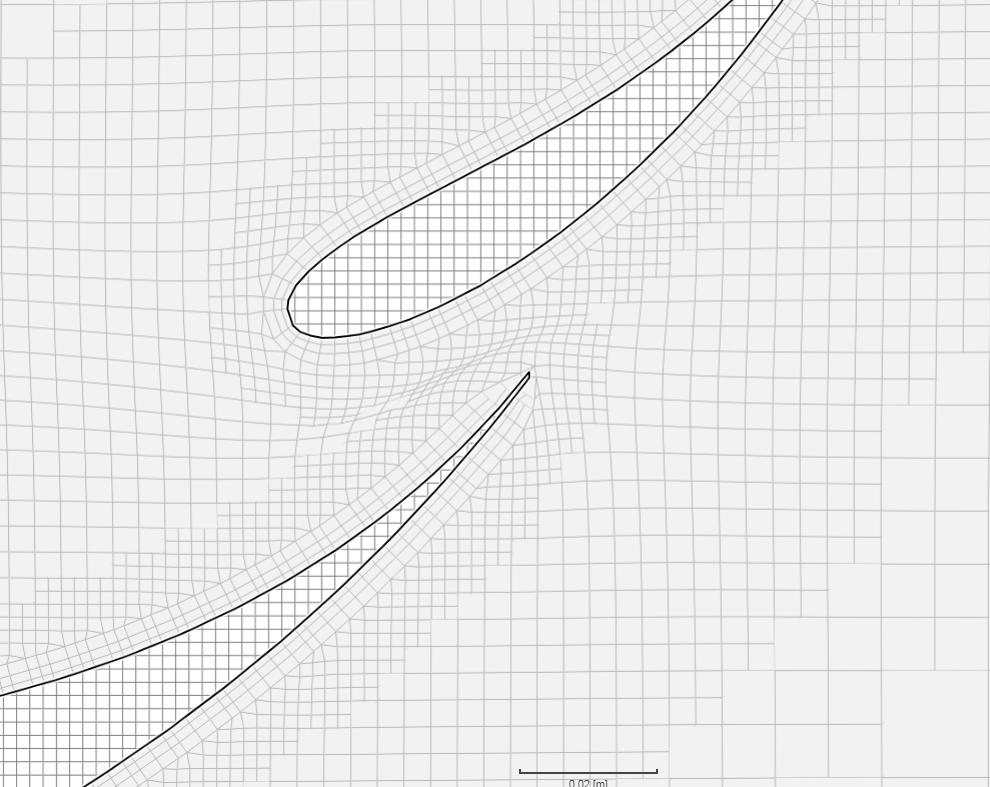
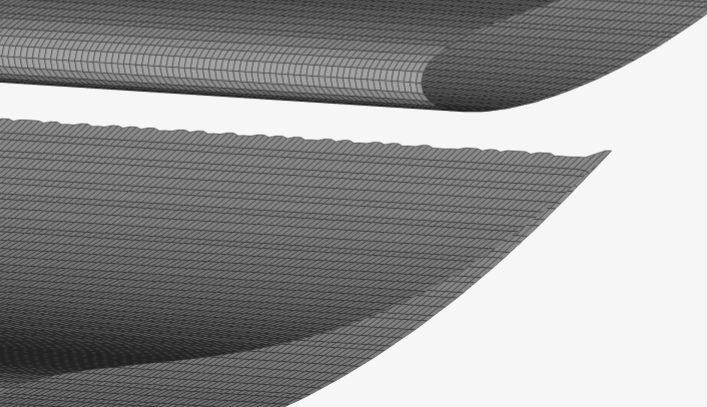
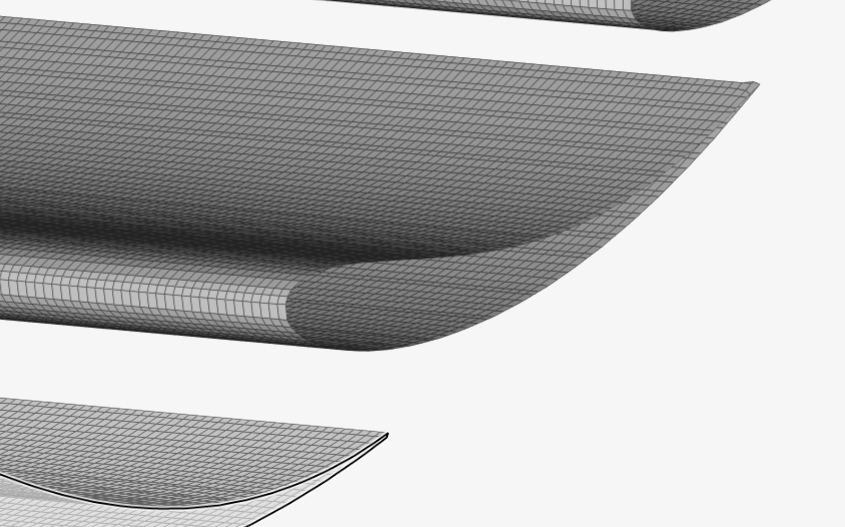
Test 1.9 Pic 4: Trailing edge gurney flap boundary layer is well meshed

Test 1.9 Pic 5: Trailing edge of 1st element has jagged trailing edge

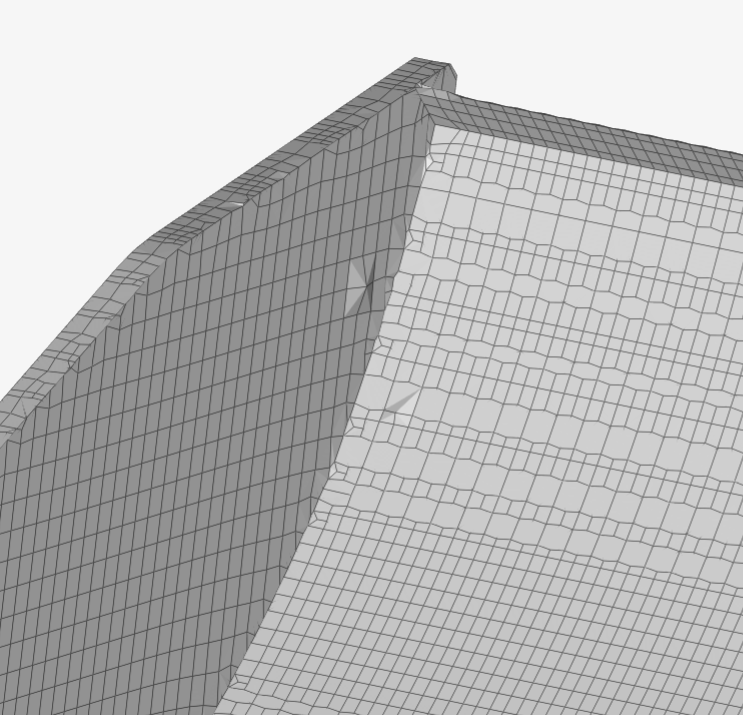
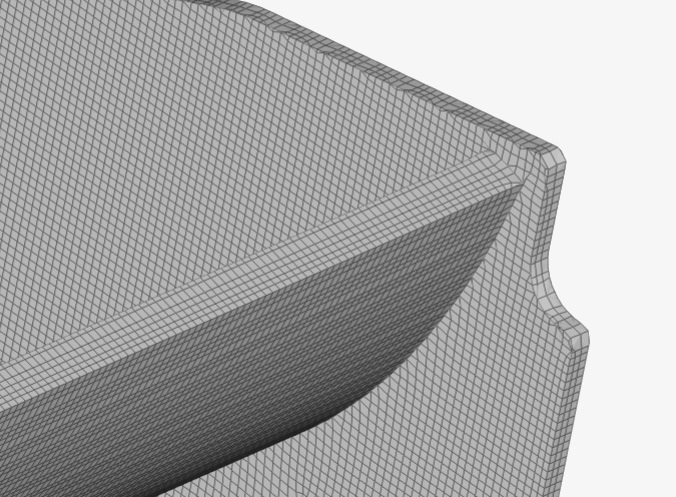
Test 1.9 Pic 6: Edge of endplate has some odd cells - solution could be unequal min max levels

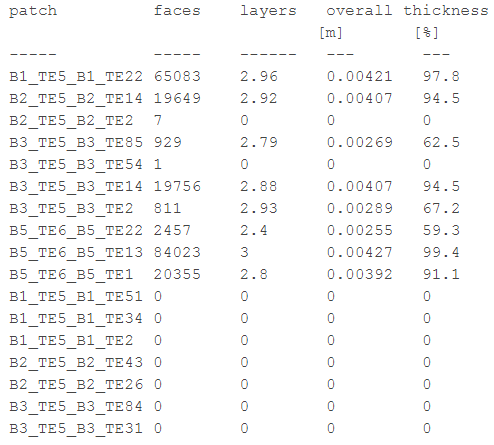
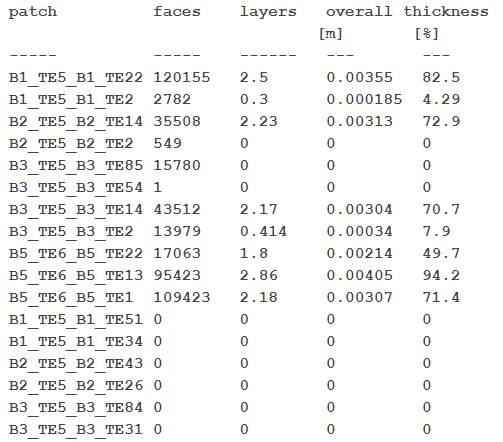
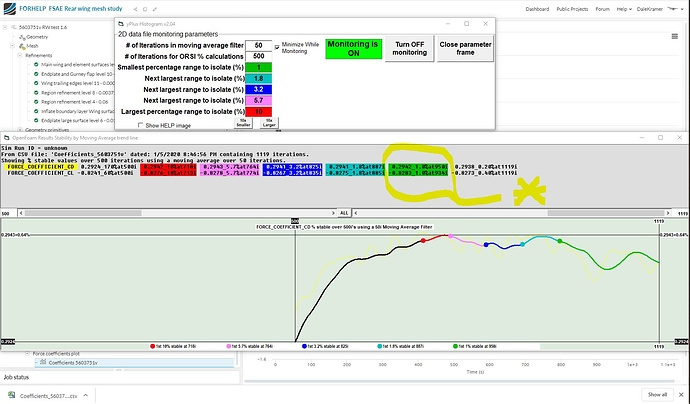
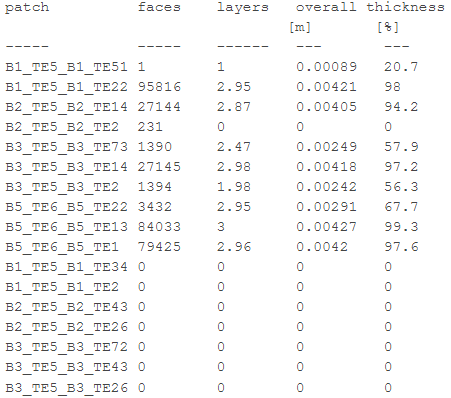
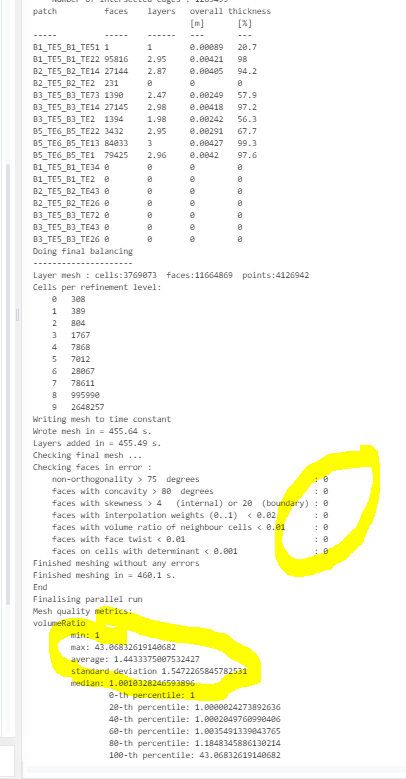
Test 1.9 Pic 7: Layering chart from the meshing log. Thicknesses are good in some areas but need to be approved in others.
image
Overall results: Surface and region refinements need work
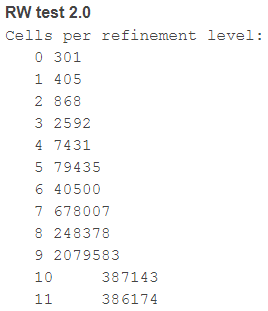
RW Test 2.0

Changes:

  • Exact same as test 1.9 but with feature refinement
    • 0.0004 level 11
    • 0.0009 level 10

Results:

Test 2.0 Pic 1: Region refinement level 9 is more prevalent even though the distance is not changed. Trailing edge boundary layer cells gone in main wing trailing edge. Squish is reduced slightly

Test 2.0 Pic 2: Gurney flap boundary layers gone, but cell refines to a lower level - most likely to surface refinements moving to lower levels

Test 2.0 Pic 3: Main wing trailing edge has many jaggies even though cell size is reduced near the edge

Test 2.0 Pic 4: Gurney flap has some bad cells

Test 2.0 Pic 5: mesh thickness log shows less coverage then test 1.9 without the feature refinement.

image
Overall results: Feature refinement allows transition to designated higher level surface refinements to show up. In test 1.9 the higher level trailing edge refinements (especially at the gurney flap) are not recognized

RW Test 2.1

Changes:

  • Distances to surface of region refinement increased
  • Feature refinement removed
  • Wing surfaces surface refinement changed to min lvl 9 max lvl 10
  • Endplate main surface refinement increased to lvl 8
  • Wake region refinement levels reduced
  • Wake region box smaller

Test 2.1 Pic 1: Increased region refinement level 9 to 0.005 gave better results then test 1.9. Increased distance of level 9 did not help with cell squish - solution, maybe this needs to be increased further to conjoin the two regions

Test 2.1 Pic 2: Same as pic 1 Showing how the surface and region refinements are related. It can be seen that in Test 1.9 Pic 1 with a region refinement distance of level 9 at 0.001m away from the geometry, this does not surpass the overall thickness of all three layers which results in 0.0043m This is why the level 9 region refinement doesn’t show up well on the mesh clip and seems to go directly to the next lower level 8, which was set at 0.005m. In this picture below the level 9 region refinement distance was changed to 0.005, and level 8 to 0.01m which is why there is better coverage outside of the boundary layer. Understanding that with distance from geometry region refinements, the first level distance value should be larger then the overall thickness of the boundary layer.

Test 2.1 Pic 3: Cell squish is still apparent even with increased level 9 region refinement distance.Also notice that the boundary layers near the trailing edge have disappeared. - solution could be to make unequal min max levels for trailing edges

Test 2.1 Pic 4: Endplate edge cells are better and wing surface cells are also better.

Overall results:

Boundary layer depletion around trailing edge - no good

Cell squish is not gone - solution is to increase the distance of level 9 region refinement

RW Test 2.2

Changes

  • Increased region refinement distance of highest level - level 9 = 0.01
  • Increased trailing edge level to min 11 max 12

Test 2.2 Pic 1: Increased level 9 distance did not remove cell squish

Test 2.2 Pic 2: Trailing edge boundary layers gone still between 1st and second element

Test 2.2 Pic 3: Trailing edge has jaggies just like test 1.9. I think the unequal cell sizes on the surface refinement is to blame. Not sure how to fix this

Overall Results: Need to find new solutions to problems

2 Likes

Going though what i have done again. I feel that my attempts to get a really good mesh using different refinement settings might be towards its end. I think if i understood the mesh settings better, especially the snap controls and layer adding controls, i would be able to better manipulative the cells by changing these settings. This is where i need more guidance

Yep, that is why I would likely do this.…
.
.
.

Would be fixed by squaring off TEs and making sure TE is 0.5mm like I said here:

.
.
.

That is tough I have same issue on my CyberTruck tire tread, I tried changing all ‘Snap control’ parameters but no luck yet…

Don’t worry about squish if mesh log does not complain at the end of it…
.
.
.
.

My advice now is make the CAD geometry file edits I suggested and try again…

EDIT: When you try again (just in case you are not using ‘copy mesh settings from’), just make a new sim with the new Geometry, then on ‘mesh’ dropdown, select ‘copy mesh settings from’ and select the mesh that you like best so far, say 2.2 if that is your best… That way your new edited mesh refinements will not overwrite any other mesh… I use a new sim for EVERY successful (or error-ed) mesh, I REALLY suggest you continue to do the same…

Golden rules:

  1. Best CAD file first.
  2. Then make best mesh from it…
  3. Then simulate…

Don’t be afraid to go back to CAD and fix regularly…

I found an OK workaround for the ‘floating point exception’ issue… Support has not come up with anything yet :frowning:

Ok dale im going to go back and change the CAD files. It was still worth it to see how everything works together. I have a lot of CAD work to fix on other parts of the car so i will be doing that at the same time. I might be able to have most of it done by tomorrow. Ill do another wing run when im done then hopefully a simulation of that will give me a good Y+ average overt the surface.

I also want to know how you got this measurement tool. Is this within simscale or your own setup?
image

After that I have to learn the Paraview post processing. So i can make the awesome Y+ histograms. SOO much to do. Ill keep chugging away

Rear Wing 2 Test 1.0

  • All surface refinements reset to equal min-max levels

RW 2 Test 1.0 Pic 1: Trailing edges still looking good

RW 2 Test 1.0 Pic 2: Element and gurney flap boundary layers also looking good. Cell squish still an issue

RW 2 Test 1.0 Pic 3: Trailing edges very clean - Dale had it right with CAD geometry being the problem (not surprised he knew this)

RW 2 Test 1.0 Pic 4: Gurney flap also looking very good. Still funky cells on endplate edge though. I am not concerned about this, the wings are most important

RW 2 Test 1.0 Pic 5:
image

Overall Results: While I am very pleased with these results, and would consider stopping here in terms of overall mesh quality. I would still like to have more understanding and control over certain areas such as:

Surface refinement control

  • Even though i have given higher surface refinement designations to edge or small face areas, the finer mesh doesnt seem to be showing up. The only test where my higher level surface refinements seemed to work is when I add a feature refinement to the mesh. I believe this is because it acts as a bridge for cell reduction, just as the”Cells between levels” setting does in mesh control. In this picture RW 2 Test 1.0 Pic 4: and in many others it seems that the whole mesh is refining to level 9 only. This is also shown in the log where my test with a feature refinement is the only test that has cells up to level 11

The new problem of mesh squish

  • I am not sure how important this plays into accurate results. I would like that the cells between elements form together better and i am not sure if this has to do with region refinement levels or distance, or if it has to do with mesh control setting such as face twist, non-orthogonality, or skewness.
1 Like

Moving onto simulation settings. I am starting to read up on the correct numerics for my situation. I have read through some of your old threads such as Initial Values for turbulence coefficients and continued with the paper from Spalart and Rumsey. I am trying to start at the beginning with understanding the Initial Conditions settings as the FSAE tutorial said to use do the following changes:

image image

Based on my brief reading on these topics, this recommendation from the Spalart and Rumsey paper gave a good explanation.

B. Boundary-Layer Levels, and Device Reynolds Numbers

Another very concrete consideration in aerospace applications is the gap regions between different elements of a wing. These are normally designed to allow a “potential core” between the two boundary layers. It is all too easy to set the ambient νt so high that this potential core is smeared, and to be ignorant of this fact, deeply hidden in the flow field. Yet, this will make CFD inaccurate, and sensitive to ambient values.

  1. As i understand it, the initial condition values for (k) and (w) are for the ambient air in the bounding box. These values can be set so that the ambient air has laminar or turbulent characteristics, which through the paper, suggests that there is an effect on boundary layer transition, simulation convergence ability, and effects slot gap boundary layer measurement accuracy.

A. Free Decay

As mentioned earlier, for large decay rates, the coarseness of the grid far from the body may make the solver unable to support an accurate computation and the decay can be grossly underestimated.

  1. Would this be a factor when our level 0 mesh size is 1m?

Using significantly lower values for freestream ω, however, the decay rate is dramatically reduced, and CFD predicts the levels with greater precision on all three grids (lower curves).

  1. Does a low (w) value, even with a coarse mesh from #2 mean that precision is not a problem?

III. Ambient Values

We also consider the common situation in which the ambient values are picked to trigger turbulence in all boundary layers without local tripping, except perhaps at very low Reynolds numbers.

  1. Should I be purposely picking a turbulent ambient flow?

C. Recommended Values

the SST model can encounter a particular problem when the ambient value of νt/ν is large and ω is set too small. The main problem with this erratic behavior is that convergence can stall. Figure 3 suggests that values of ωc/U up to 100 would be more than safe, so that the useable range is not too narrow.

To summarize, the following ambient freestream turbulence values (in the region near the body) are recommended for general use for most typical external aerodynamic applications with two-equation turbulence models: k/U2 = 1 × 10⁻⁶ (or Tu near ≈ 0.1%), εc/U3 = 4.5 × 10⁻⁷, ωc/U = 5. These values yield an ambient eddy viscosity ratio of νt/ν ≈ 2×10⁻⁷ ×Rec. Thus, for example, for Rec = 10 million, νt/ν ≈ 2; and for Rec = 1 million, νt/ν ≈ 0.2. Again, these ambient levels are not achievable if the turbulence variables are allowed to decay naturally according to the turbulence equations. One easy way to achieve these ambient levels in practice is to impose them as both inflow and floor values.

  1. From what i have read, an FSAE car operates under low turbulence intensity of less then 1%. My (k) and (w) values are dependent on desired laminar or turbulent ambient air. turbulence model plays a factor on these values. Having multi-element wings play a part. Cell size before and i assume after the model have an effect on the consistency of results.
  • My (k) value should be be under 3.

  • My (w) value is should be close to 100 using the K-W SST model.

Am i going too deep into these values? Is this really that important for my results?

Although you squared up your TEs, their thickness is still less than level 11 which is 0.488 mm.

When I said make them 0.5 mm, that was a precise recommendation, specifically because it was greater than the 0.488mm Level 11 size using a 1 meter level 0 grid…

If you make them 0.5 mm, your TEs should get layered all the way around…

I am cutting it close here with such little difference (0.012 mm) but it should be enough, it they still don’t get layered then you will have to try 0.55mm or the like…

It is VERY important for all of the geometry features that you want layered to stay above the L11 0.488mm size…

image

And squished cells seem OK when looking at log:


,
,
,
What funky cells are you worried about here?
image

Dale i understand your recommendation to make the TEs exaclty 0.5mm, and know this would help. The problem is the way the CAD is constructed, where each wing profile is an imported sketch that is extruded. If i try and change the TE width, the whole sketch profile will scales, making the wing larger. Im not at all saying there isnt a work around (im pretty good in SW) .

Ill take your word that the squish is ok if the log says its ok. But am i correct that a change in mesh setting values, say non-orthogonality from 70deg to 75deg, will show illegal cells at 70 deg but no illegal cells when its set to 75deg? What i mean by this is that there will still be illegal cells in the mesh, but since the upper limit of the log reporting illegal cells was changed to 75deg that all the once illegal cells are now “ok” and dont show up in the report?

The funky cells were the wavy ones on the endplate edge. I guess there ok

Also did a Sim of the new rear wing

Convergence Plot looks good

Coefficients graph also looks stable

Y+ values (10, 30, 50, 80, 300)

I definitely like your Y+ histogram and ORSI plot but they are your personal creation correct?

You really want to get into it don’t you ? :wink:

I am currently working on a huge understanding issue with NonOrtho (and other quality metrics)… I am using blueCFD to run OpenFoam on my PC and I am looking at OpenFoam quality metrics, which extend beyond what we see in the log…

For now, my recommendation, even when the relaxed NonOrtho value (set to 75 degrees by default) are used in the log, is that you are still OK in that regard…

NO NO, I really dont haha

1 Like

I am working on releasing and update with ORSI soon, if you so load the current version that does not have ORSI yet, make sure you switch Windows decimal and thousands separator to “.” and “,” or the histograms fail (just noticed that issue a few days ago, I guess no European people have used it)…

OK now your yPlus plots look like we can consider them, time for celebration :beers:

BUT you have way too much surface area <20… Back to drawing board… need much thicker 1st layer…

I can easily extract your airfoil curve in Rhino, edit its control points and select the last few control points on say the lower surface near the TE, then rotate those control points around the furthest forward selected control point so that the TE thickness can be changed to any value, with a smooth transition, without rescaling the whole airfoil… Then I just extrude that curve to the required span…

What CAD SW you use?

yes i noticed that, i asssume when i manually change each value of Y+ between 10, 30, 50, etc… that each value should be mostly red on the geometry. When i get towards 300 the colors should be giving other values, just as nothing should be red when Y+ is set to under 30

or should it be red under 30 just the upper limit needs to be expanded

Try forum search for yPlusHistogram and download the current version, you can have more control over how you ‘see’ your yPlus surface values that way…

You also need Paraview, but don’t worry, I have a video with program that shows how to get csv file…

But then you will never stop using ParaView :wink:

I can download that NO WAY!