I am trying to model a chilled water piping system that includes a 24" Header that connects (t-shape wise) to the two 20" pipes. I had attempted to use incompressible analysis and set the velocity in to be 136.2 in/s (converted from 16,000 GPM) and pressure out (on the bottom face of the two 20" pipes ) to be 15.5 psi. When I ran the simulation, the pressure results give me around 18-19 psi in the 24" Header, but the calculations that have been done estimate the pressure in the header to be closer to 10 psi, which when would increase to 15.5 psi at the end of the 20" pipe because of elevation change.
However it seems like the elevation change is not being considered in the incompressible case. I had attempted to do the multiphase case, but that does not seem to work well either because after all in the end, I have only chilled water flowing in the pipe in one phase.
how did you calculate the outlet pressure and what assumptions go into your modeling? Did you post your project link in one of the old threads? Please post it here and let us know how things go.
The outlet pressure for the 20" pipes have been measured during the operation at 16,000 GPM
The system is made out of the header that has the pressure of 10 psi with flowrate of 16,000 GPM from header to two separate vertical 20"in diameter suction pipes that are 11’ long. The two separate vertical 20" pipes lead to two separate pumps. The suction pipes have the outlet pressure of 15.5 psi that has been measured (as stated above).
It is assumed that the chilled water flow is turbulent and not there is not much pressure loss in the vertical 20" suction pipes.
This is the link for the project:
I would like to see the pressure profile for the system, but I am having problems with setting it up. It seems to me the incompressible case does not consider the elevation, so I tried doing the multiphase which does seem to consider elevations since it asks to specify the gravity direction, but that is not working out for me well either.
Any help you can provide would be appreciated.
Thanks,
Maria
I am keeping most of my assumptions the same such as 10 psi for the top face of the pipe, incompressible and turbulent flow. And 15.5 psi for the bottom face of the pipe.
Can you possibly take a look at it as well and let me know how can I account for the elevation change in the pipe?
Any help you can provide to me would be greatly appreciated.
You could try to use the convective heat transfer (CHT) analysis type where gravity is taken into account. To tune the incompressible analysis for so long that it finally fits your results is not the right way in my opinion unless it can be validated with other measurements from you or that can be found in papers.
Do you want to give it a spin and keep me up-to-date?
@jousefm,
Thank you so much for your suggestion. The convective heat transfer worked pretty well for me.
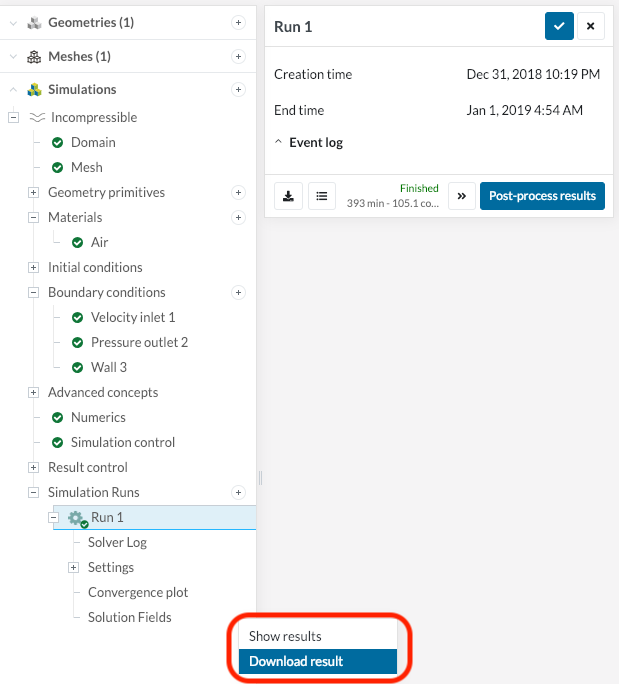
I have one more question for you. Is it possible to get the data from the simulation instead of looking at the graphic only?
I am trying to determine how the flow splits up from the header into the two pipes and I would like to know which has the largest flow rate.
I had downloaded the results as you have suggested but it looks like it only gives me how it defined the model and how the program have done the calculations (the code).
I was looking for something that would give me the final results of the simulations compiled.
Also, can you explain to me what is Paraview version that you are talking about?
I do have couple of questions for you.
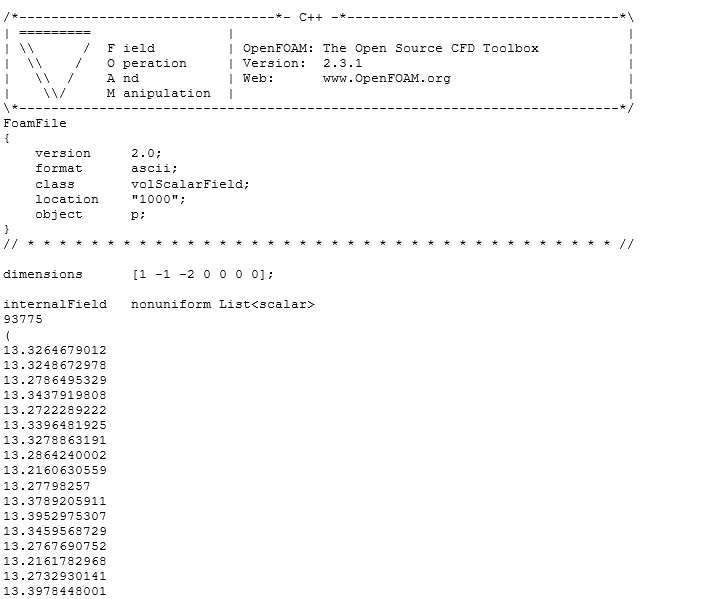
I read in one of the forums online that " Folder ‘numbered’ : this is the written results at the numbered time."
I have a folder that is called 1000 in the zip file that I downloaded from my simulation. I opened the 1000 folder and it gives me a long list of numbers for several factors such as velocity, pressure and alpha. I have attached the screenshot of what I see when I look at the pressure file.
However what I am confused about are the calculated values shown are the values that have been calculated over time? Or is this at different locations?
If they are at the same location, how do I know where it is in my model?
I just realized that I might have not been clear about what I was looking for from the model results.
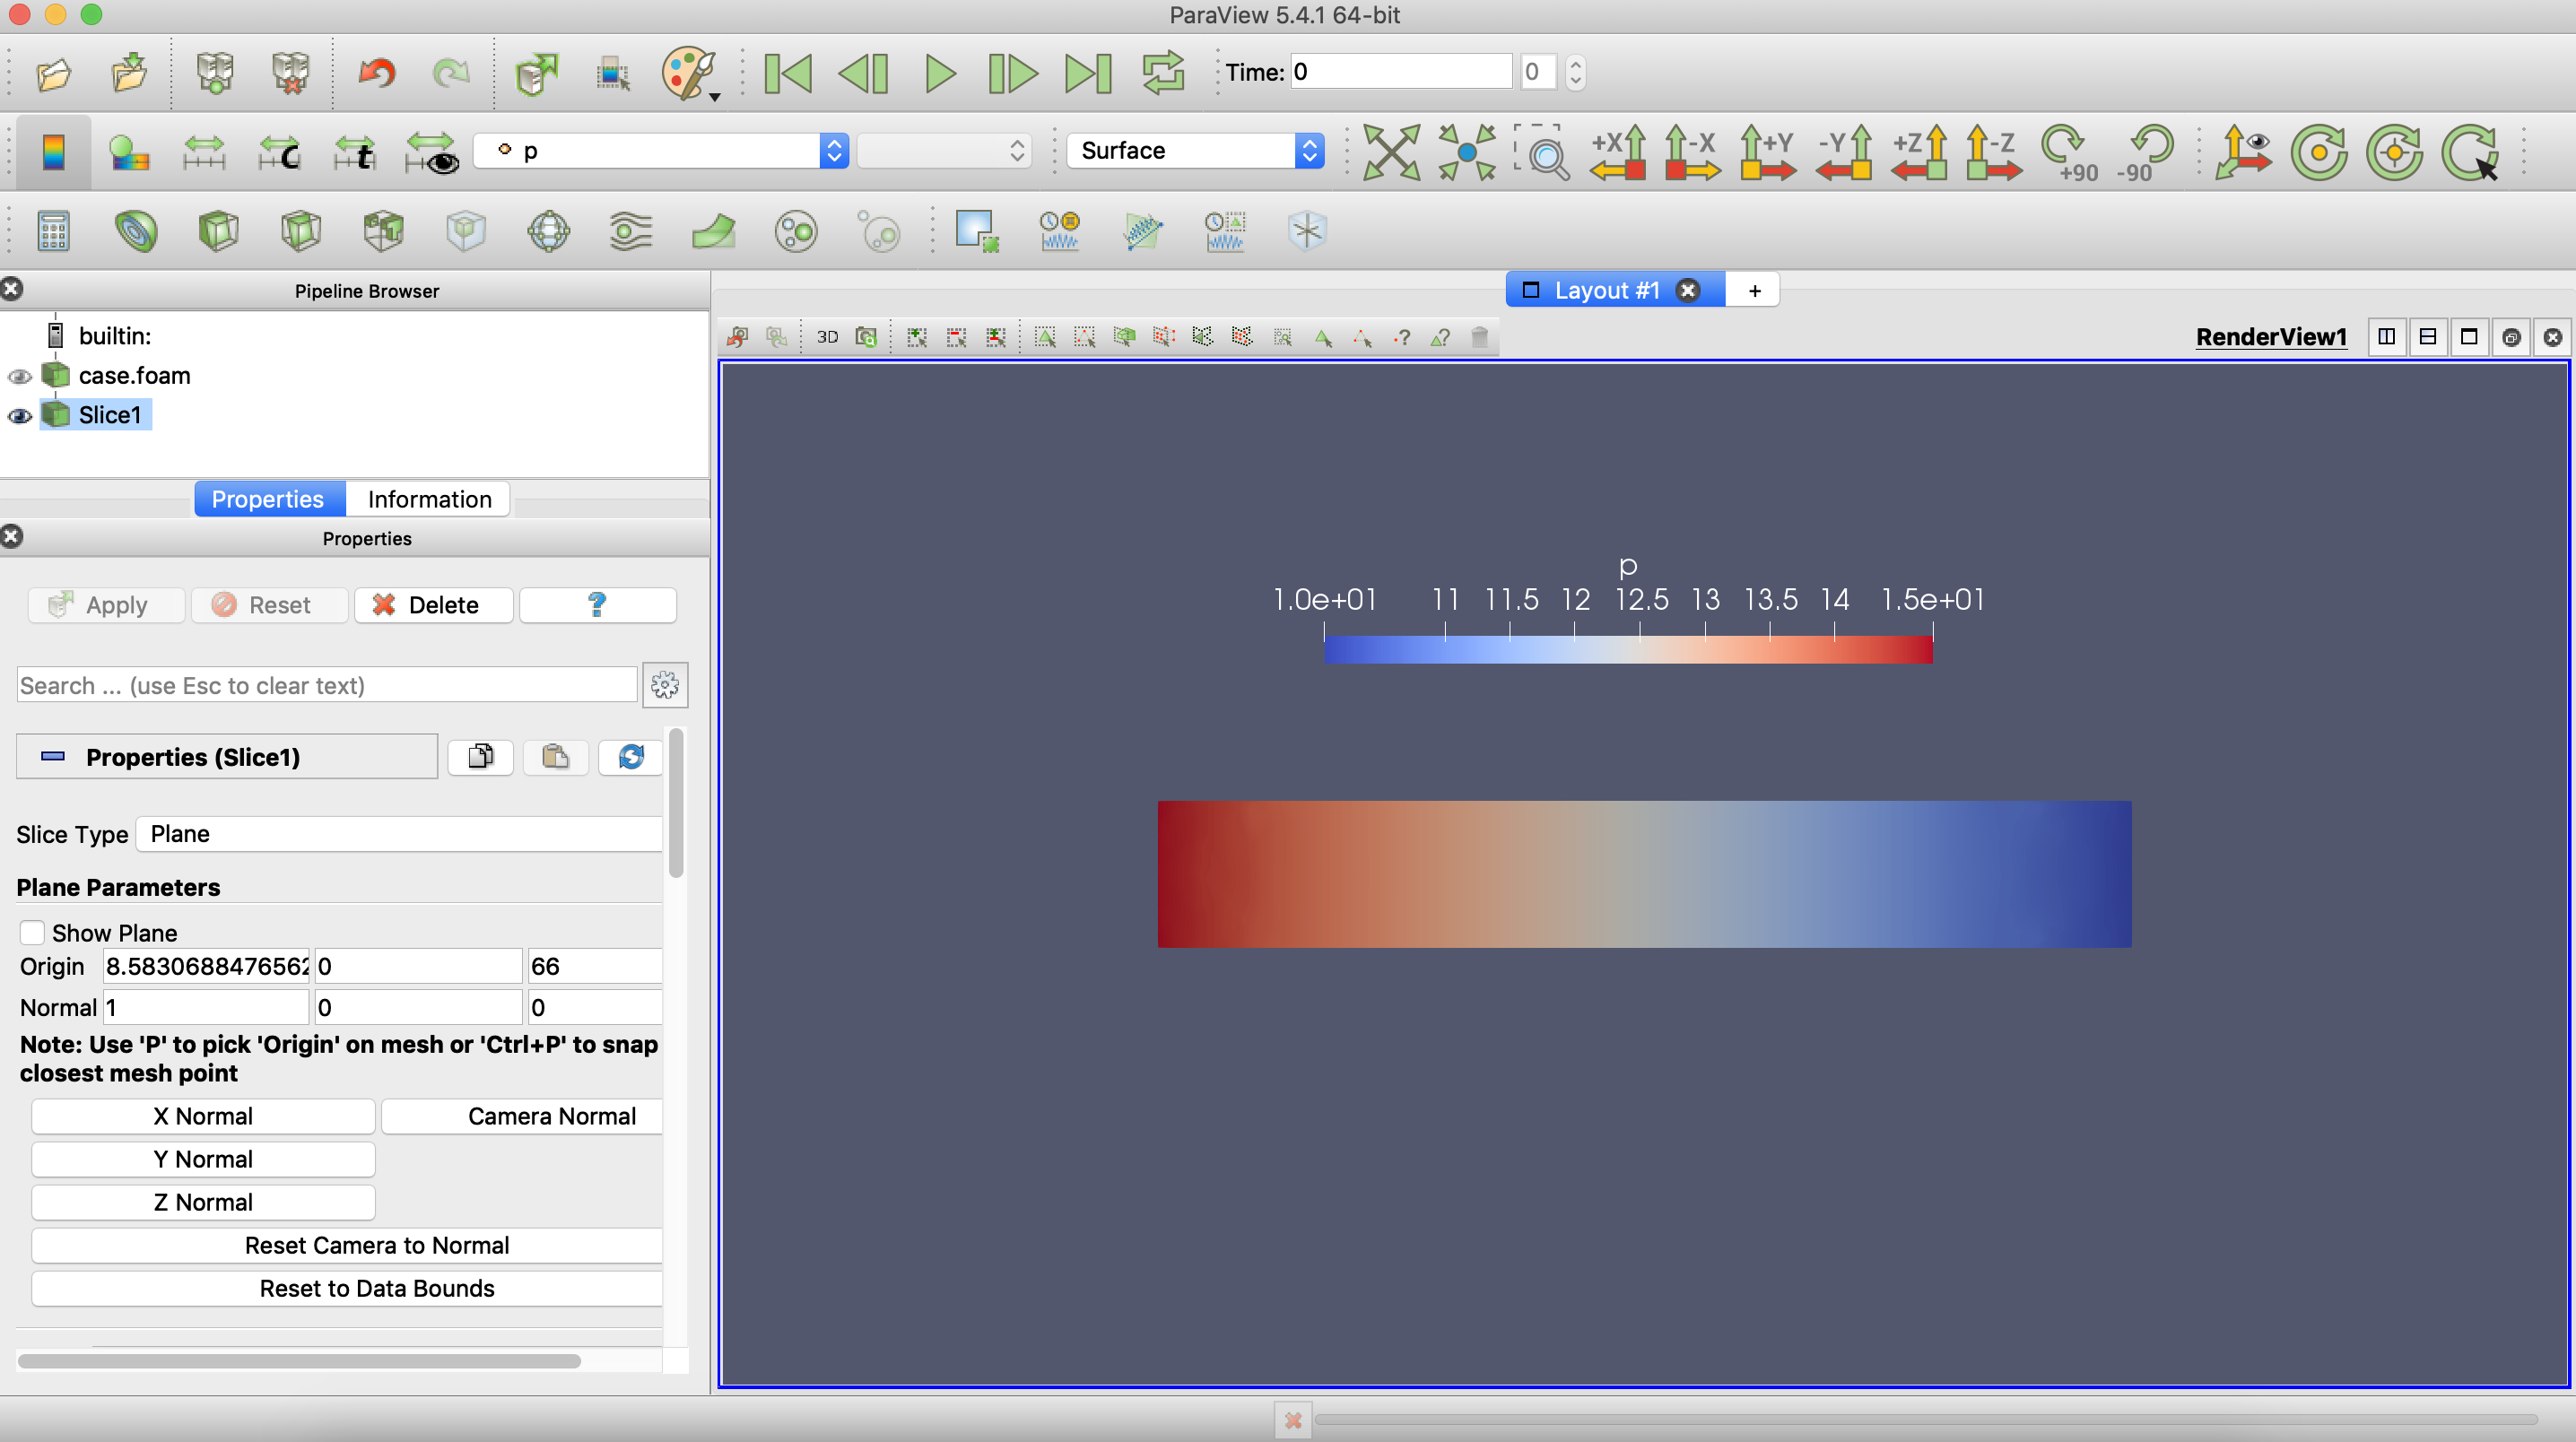
I am hoping to see the data set for velocity and pressure profiles from program, not only the graphic.
You did tell me that I can download the results but I am having some trouble interpreting the results. I am slightly confused about the locations of all those values. (if you can take a look at the post above I took a screenshot of what I see when i open the downloaded folder)
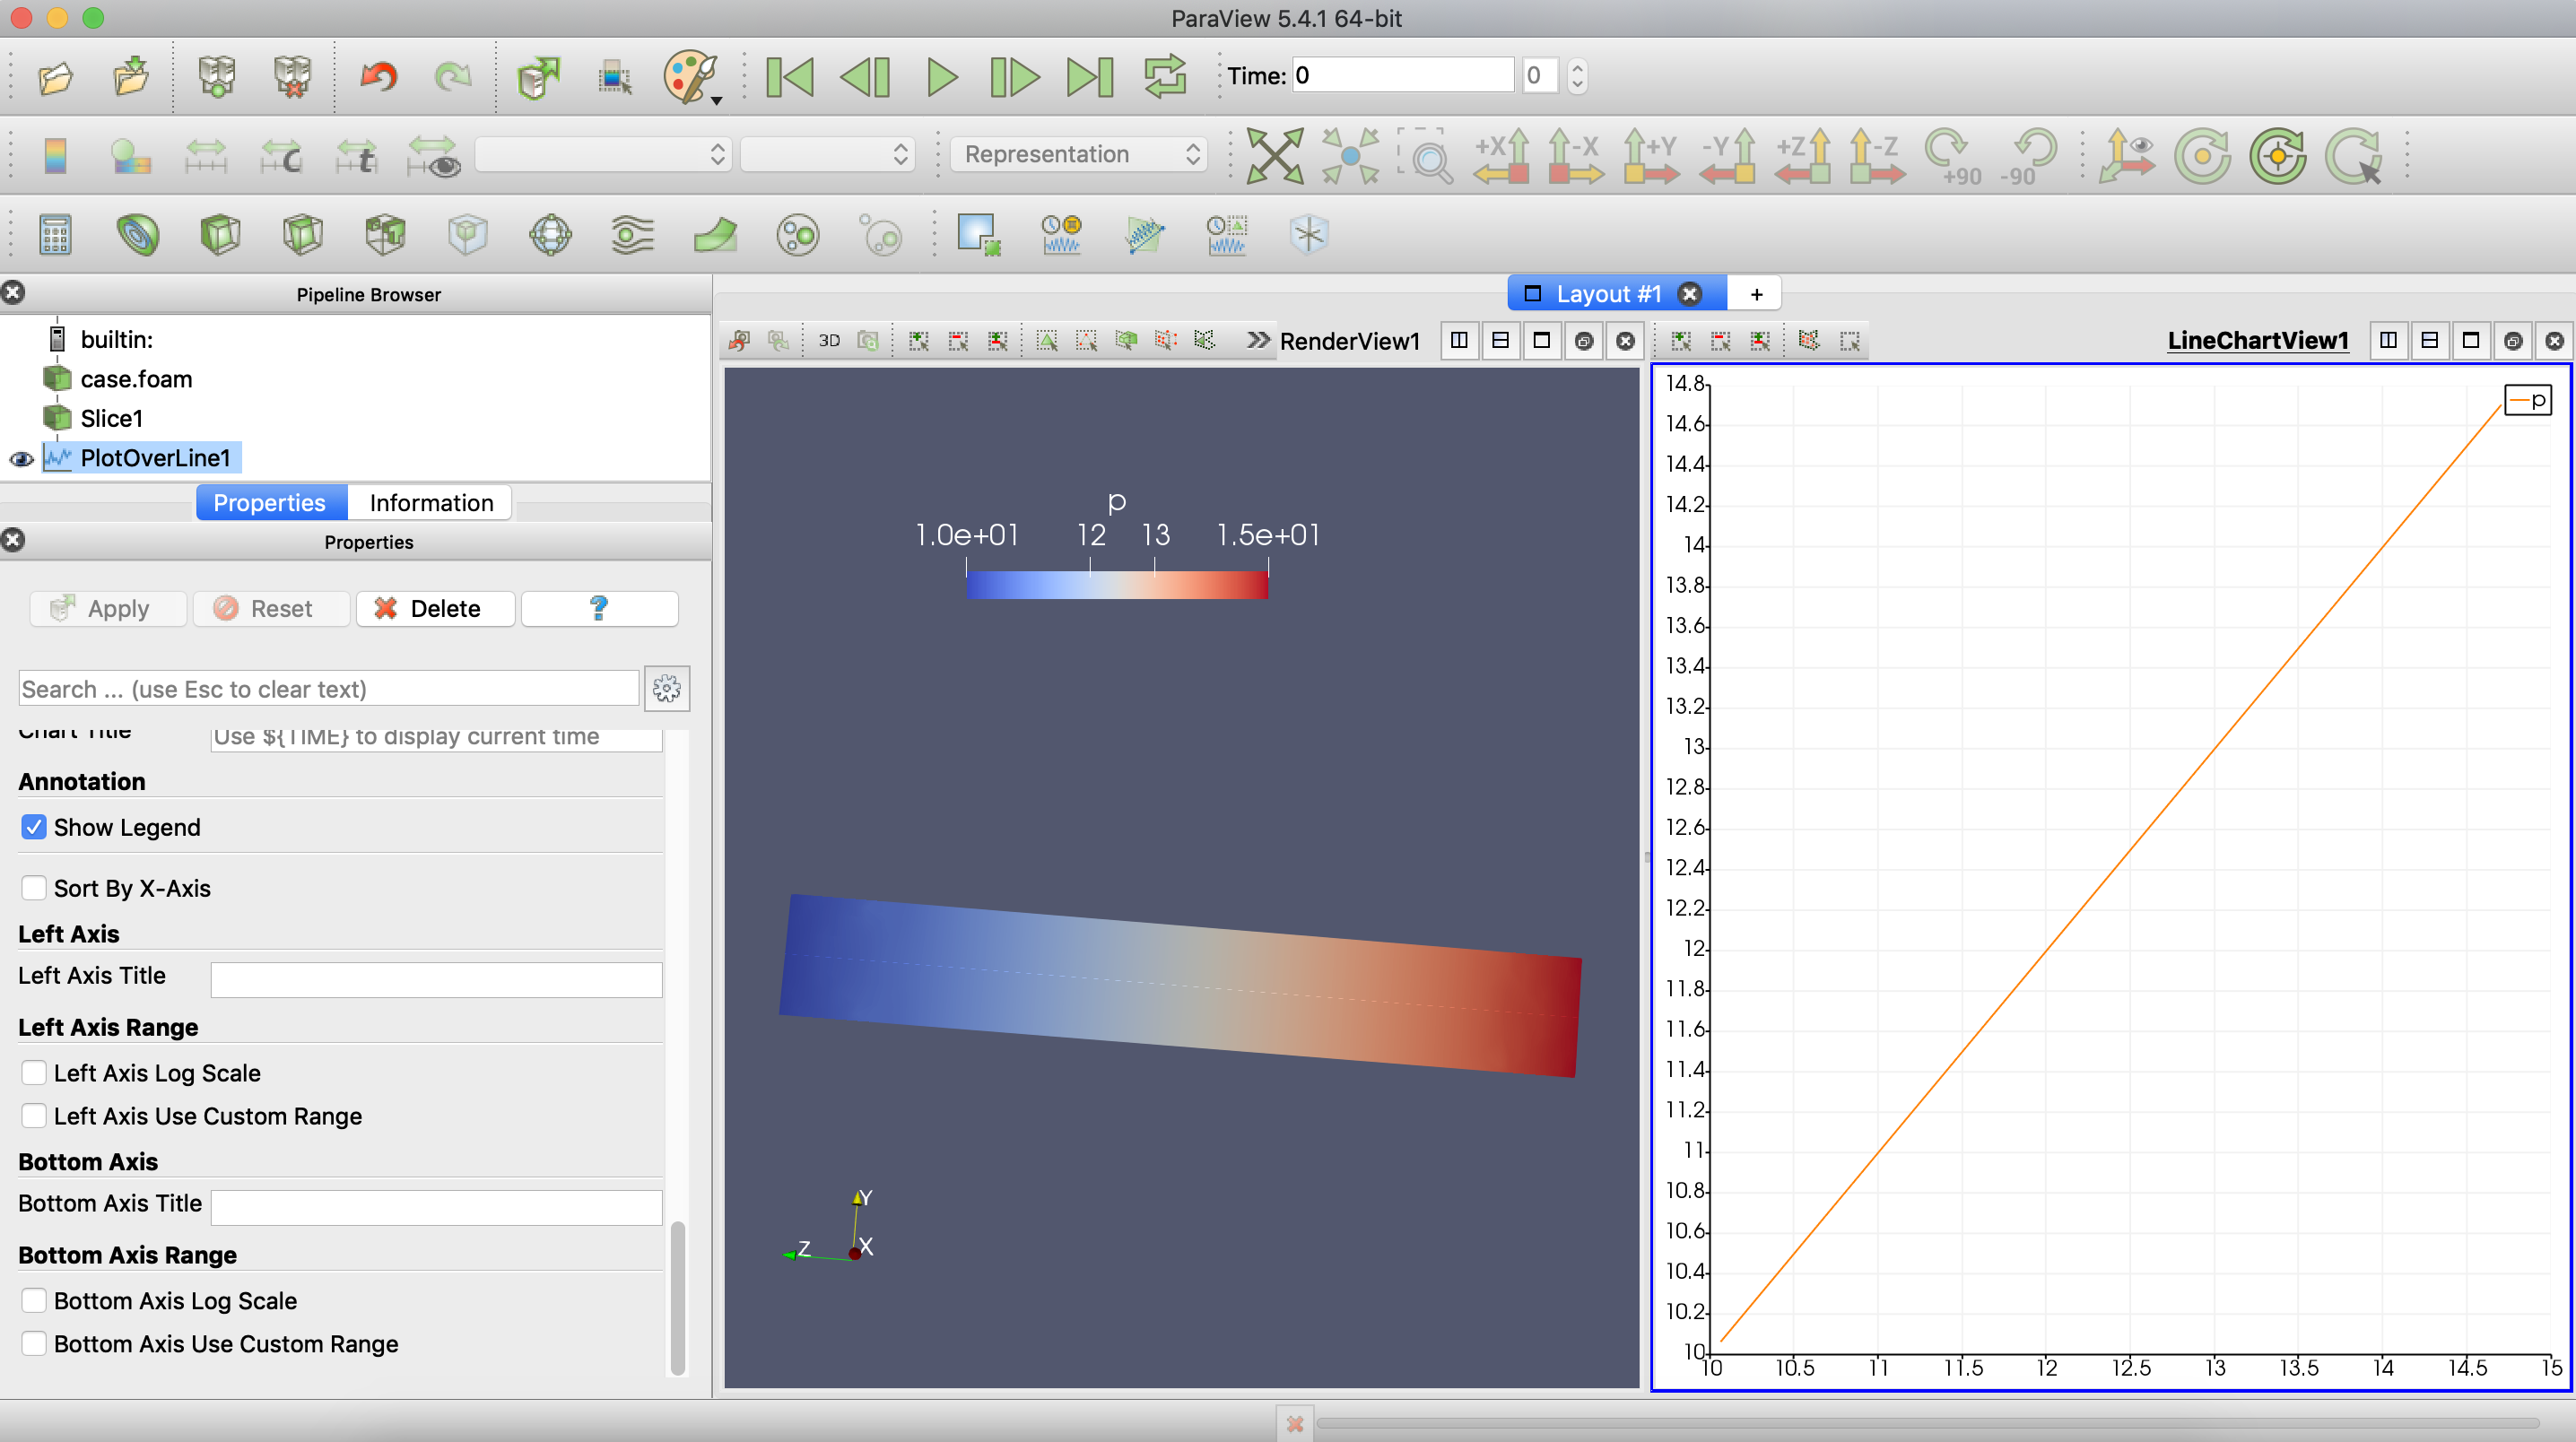
You can see the velocity and pressure profile inside of the program Paraview! You simply have to change the quantities on top (velocity, pressure, etc.) and use some additional tools to probe or plot over line - there are different ones that you can use.
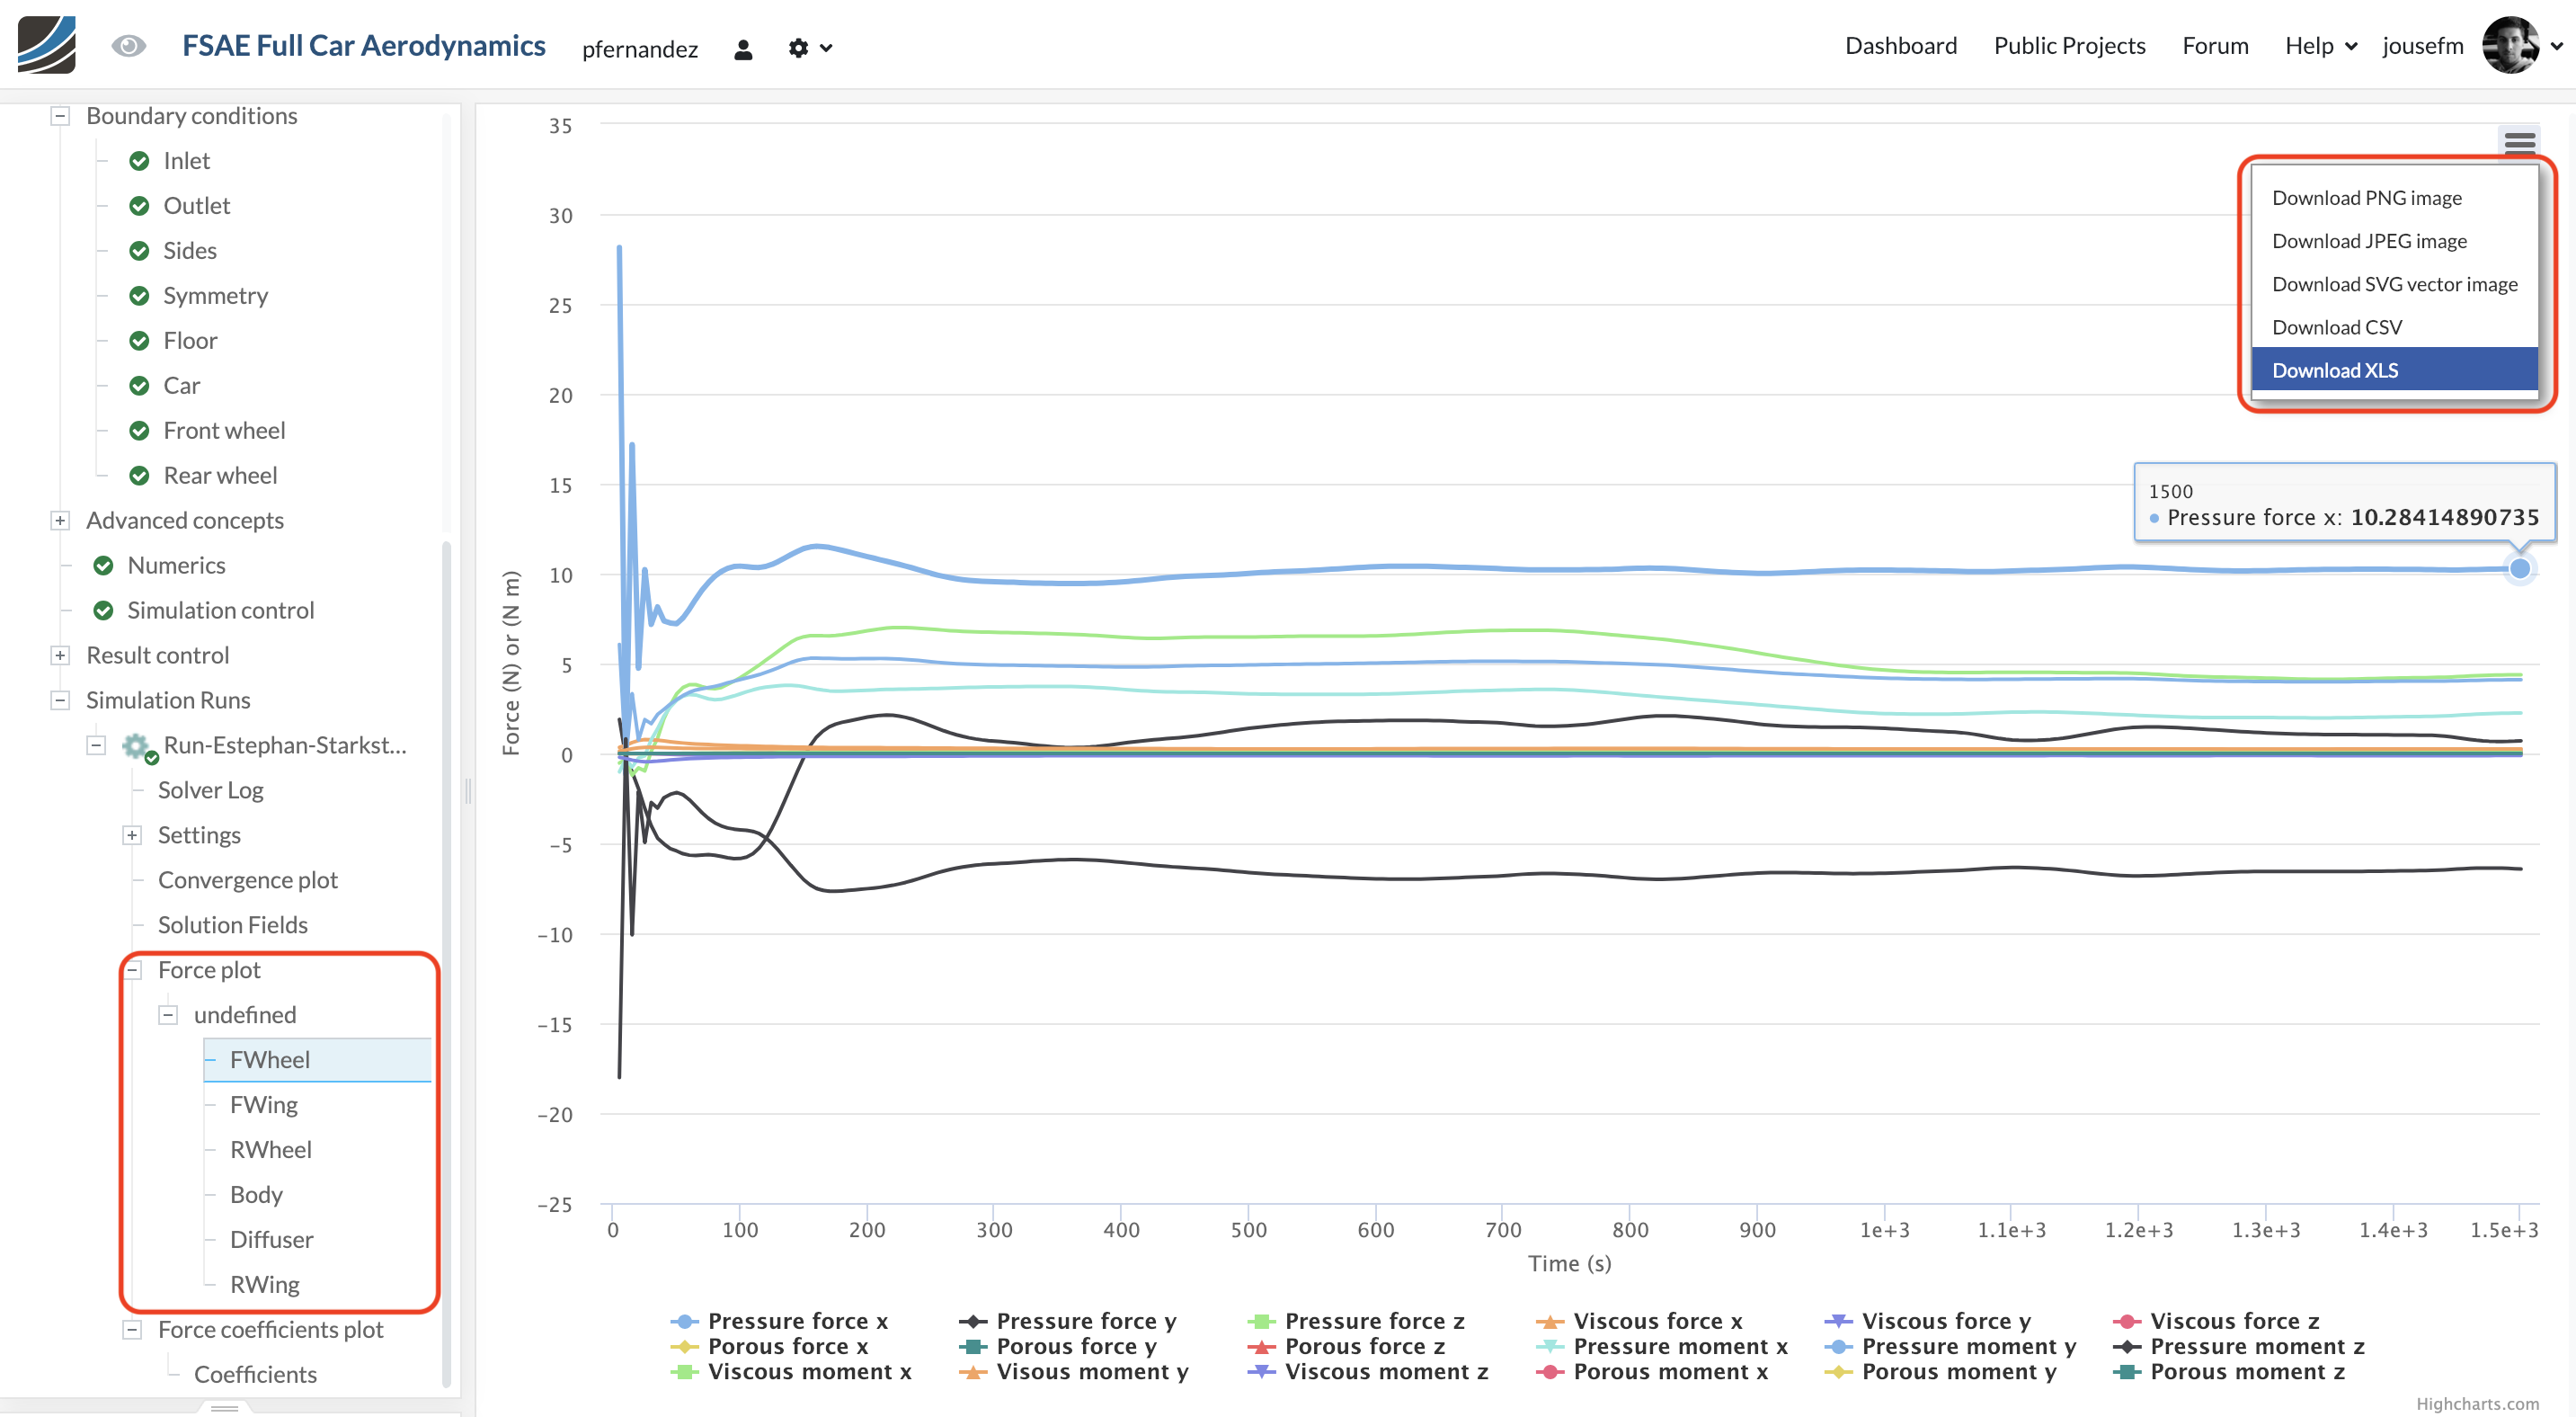
I was wondering would it be possible to see the simscale data in the form of the data table that can be viewed in excel or a data set? Instead of just pressure profile?
Thank you,
Maria Chek
Now, I am trying to figure out how the probe points work. I am attempting to do it in a simple model of 20 inch pipe first before I attempt to replicate it in the actual model. I am slightly confused about how does probing points work because the results i am getting does not make any sense.
This is the simulation of the pipe that I am working on right now:
I chose to put the probe point in the middle of the pipe. And for the pressure results, I am getting 335.98 psi, which is impossible. It should be somewhere around 10-15 psi.
Could you possibly tell me where am I going wrong?
@jousefm,
Thank you so much for helping me with that!
I have one more question for you. In the model that I am studying, I am finding that in certain areas the velocity and pressure distribution is different. Would it be possible for me to see the average pressure and velocity in those sections in Paraview or Simscale? Also can i see it in the table form ?
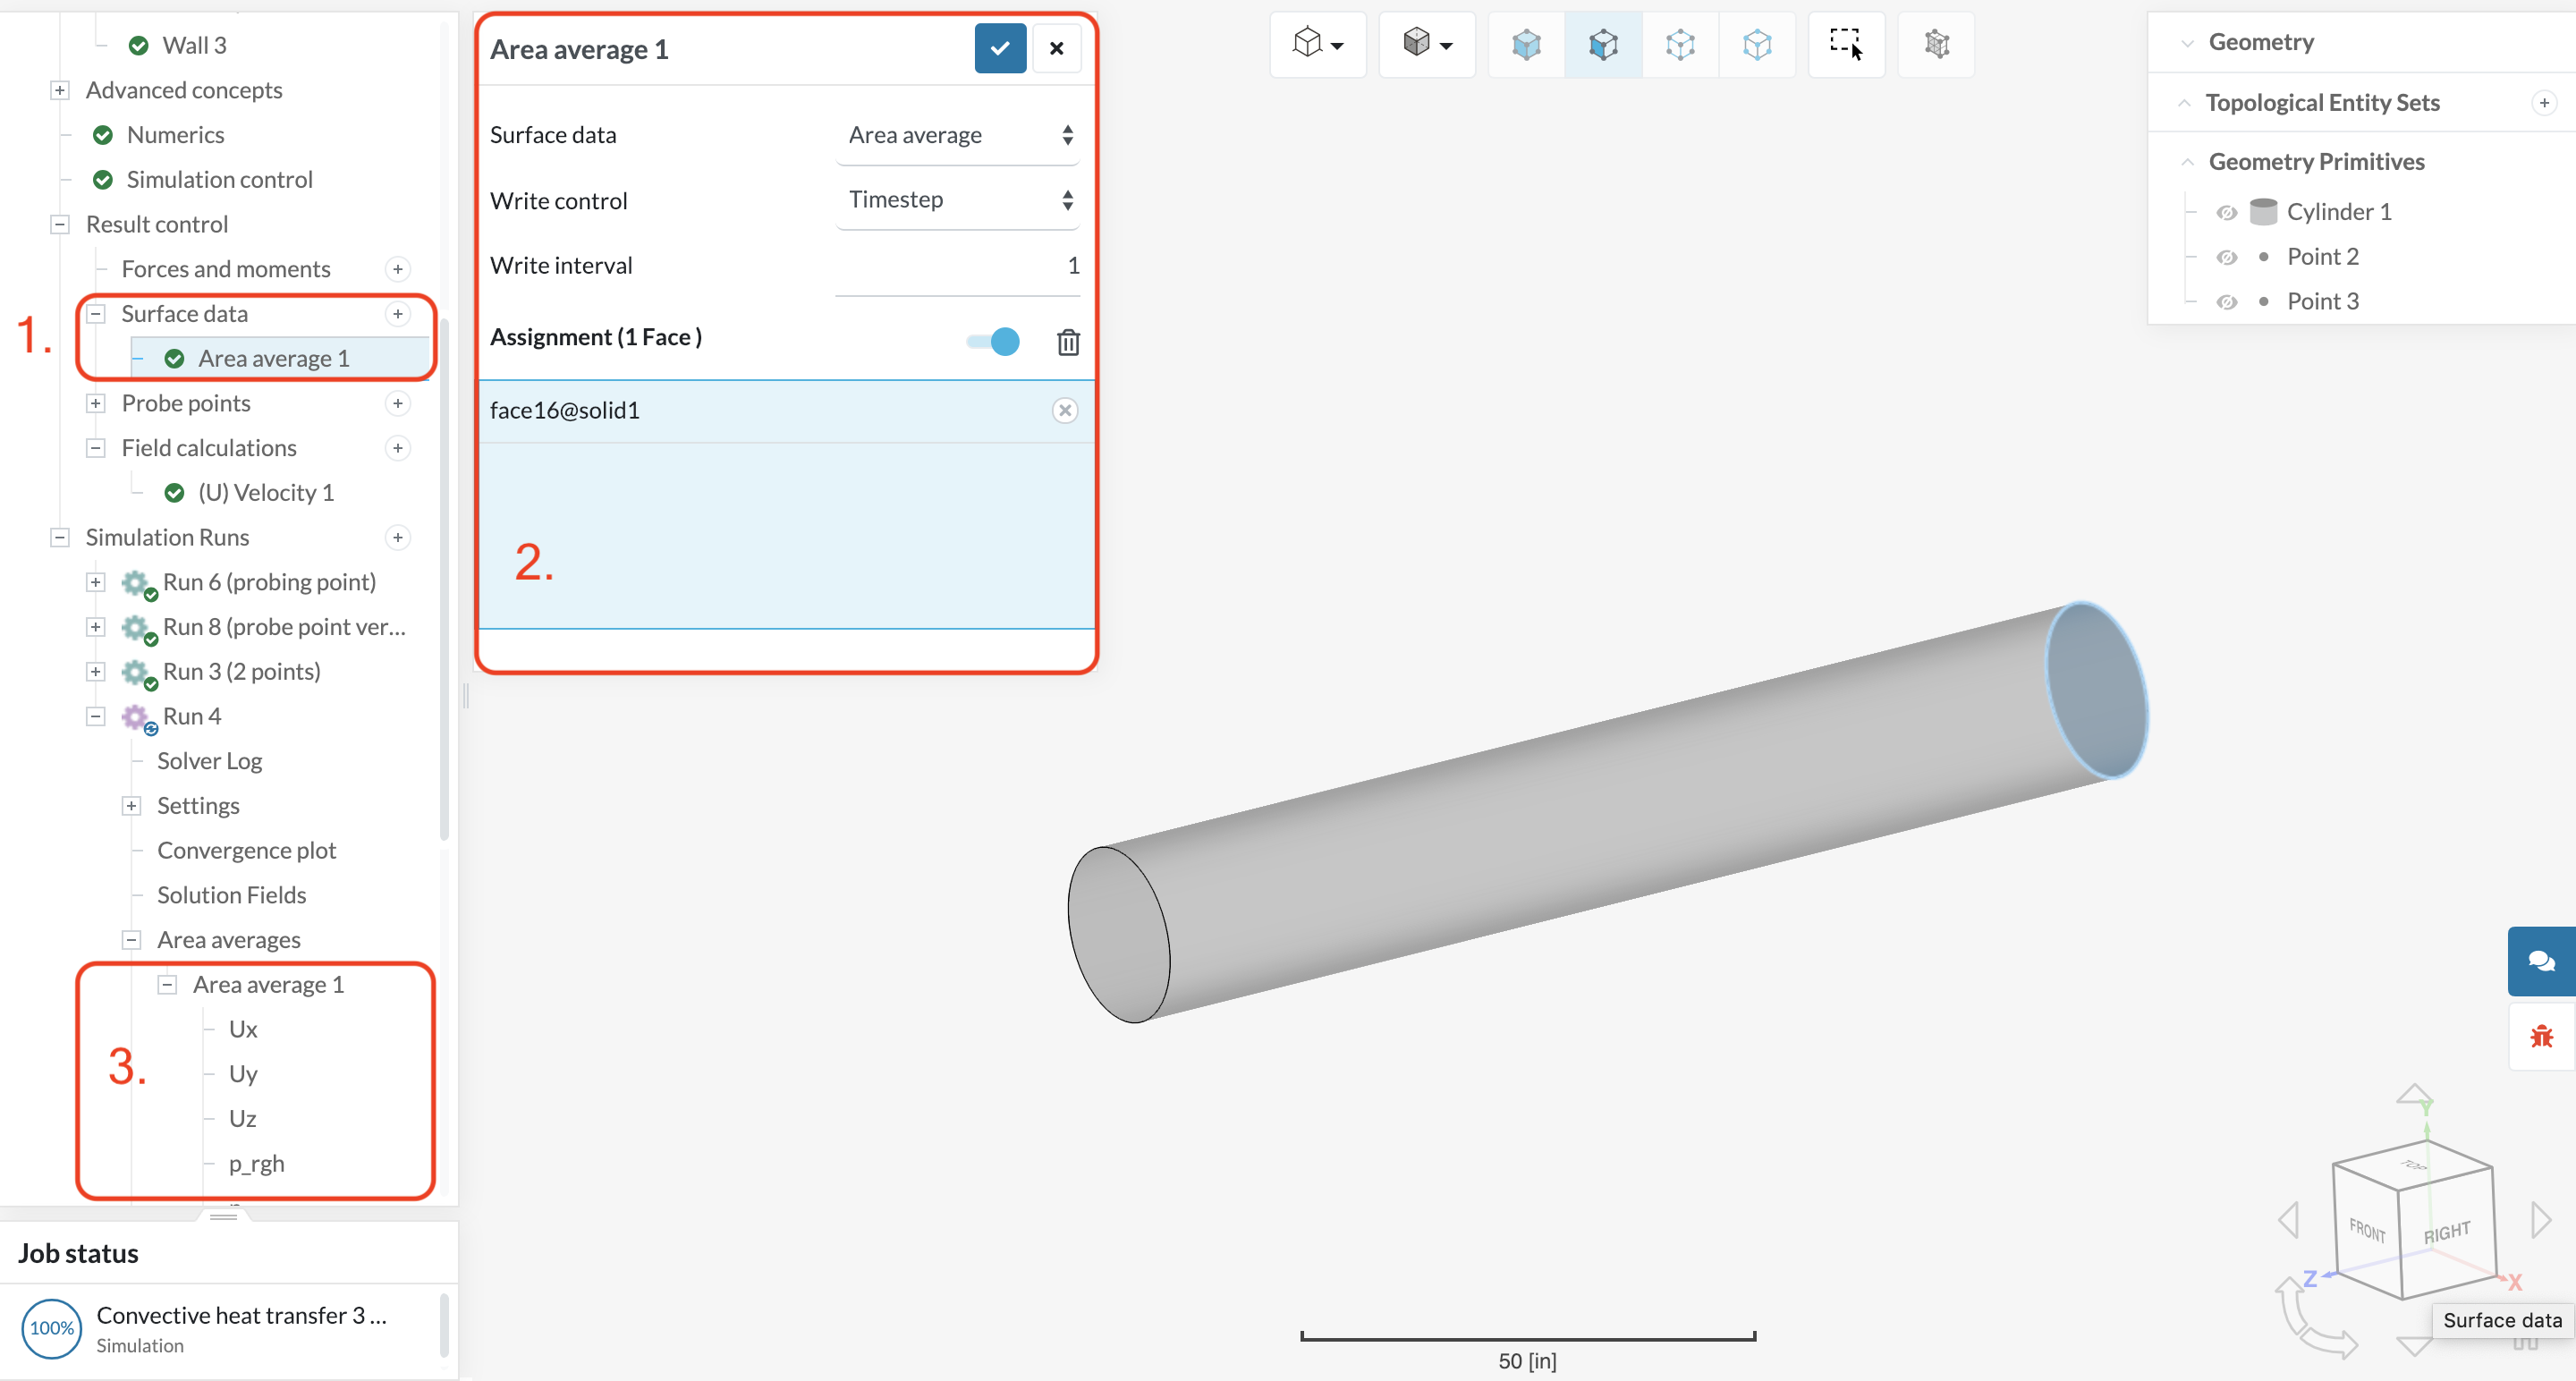
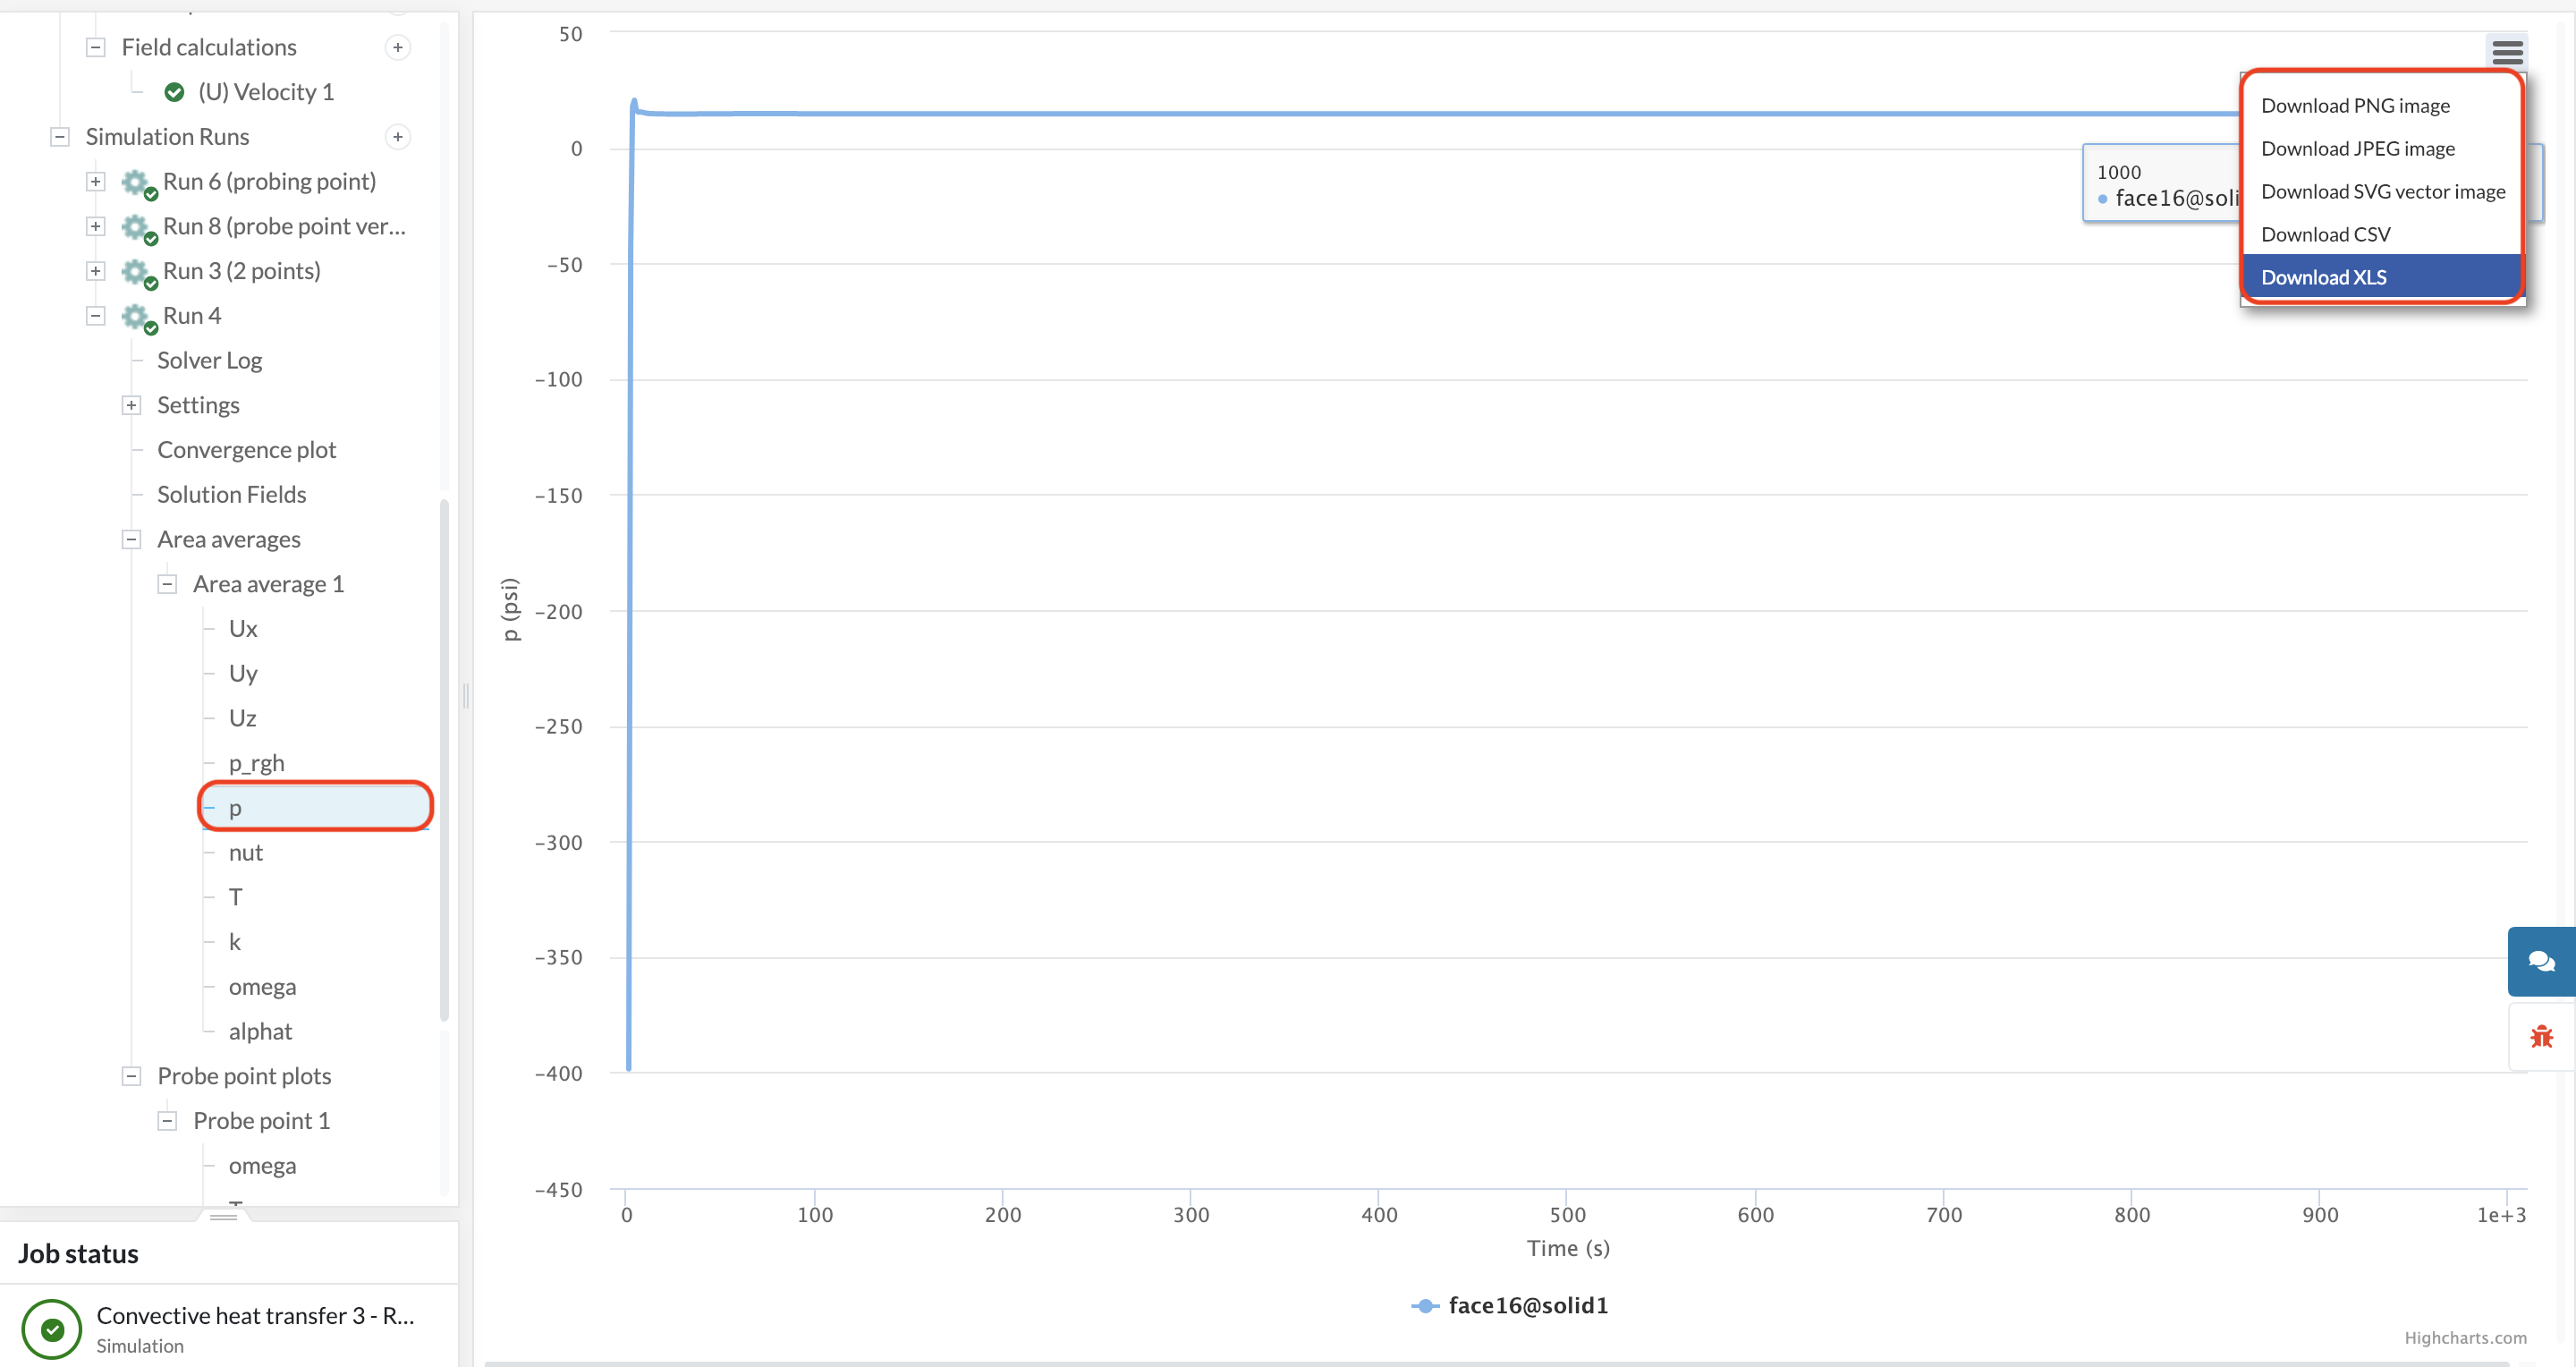
You can create a Result Control item and choose Area Average for that and simply choose the surfaces - in your case inlet/outlet. For the table issue I will create a small step-by-step and let you know.