https://www.simscale.com/workbench/?pid=8667661092967419006&mi=spec%3Ab8ab4646-ab5e-4455-b973-1bb7c5cefbac%2Cservice%3ASIMULATION%2Cstrategy%3A1
I am doing a mesh study for a external aerodynamics wing of a fsae car simulation.
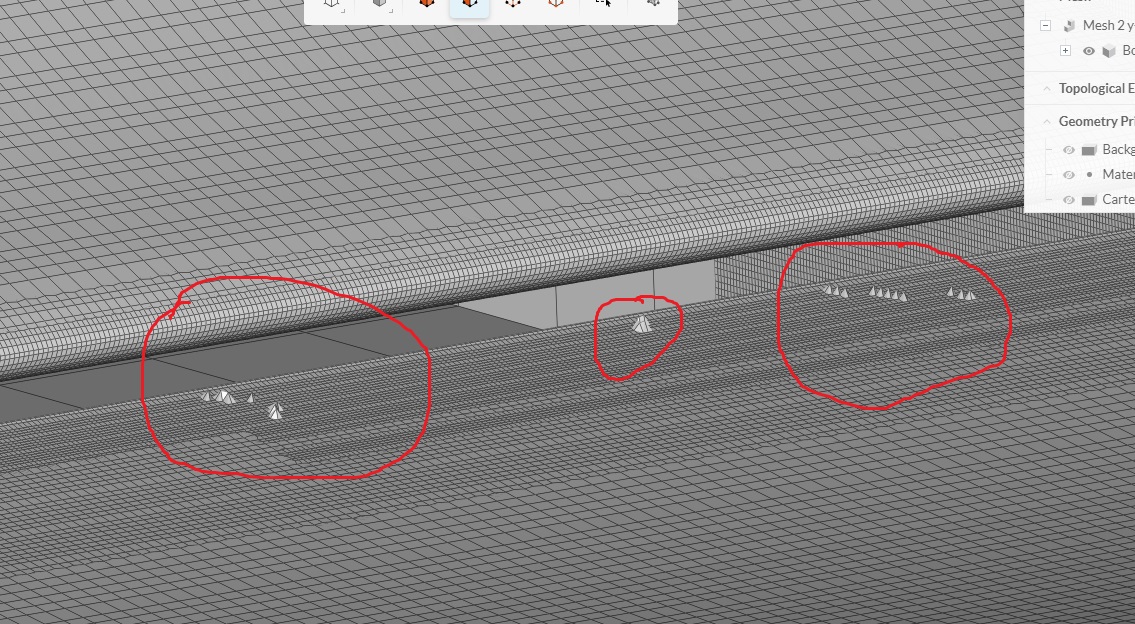
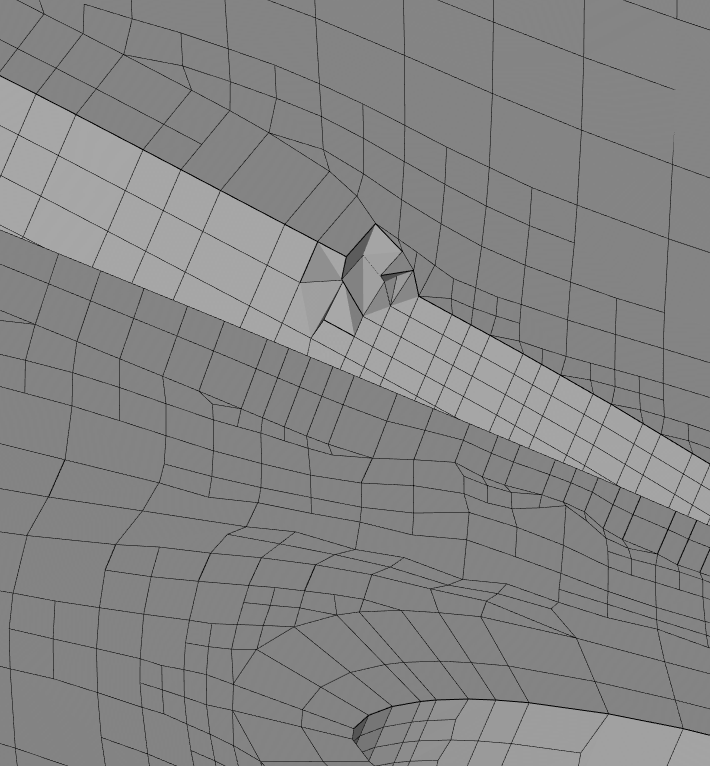
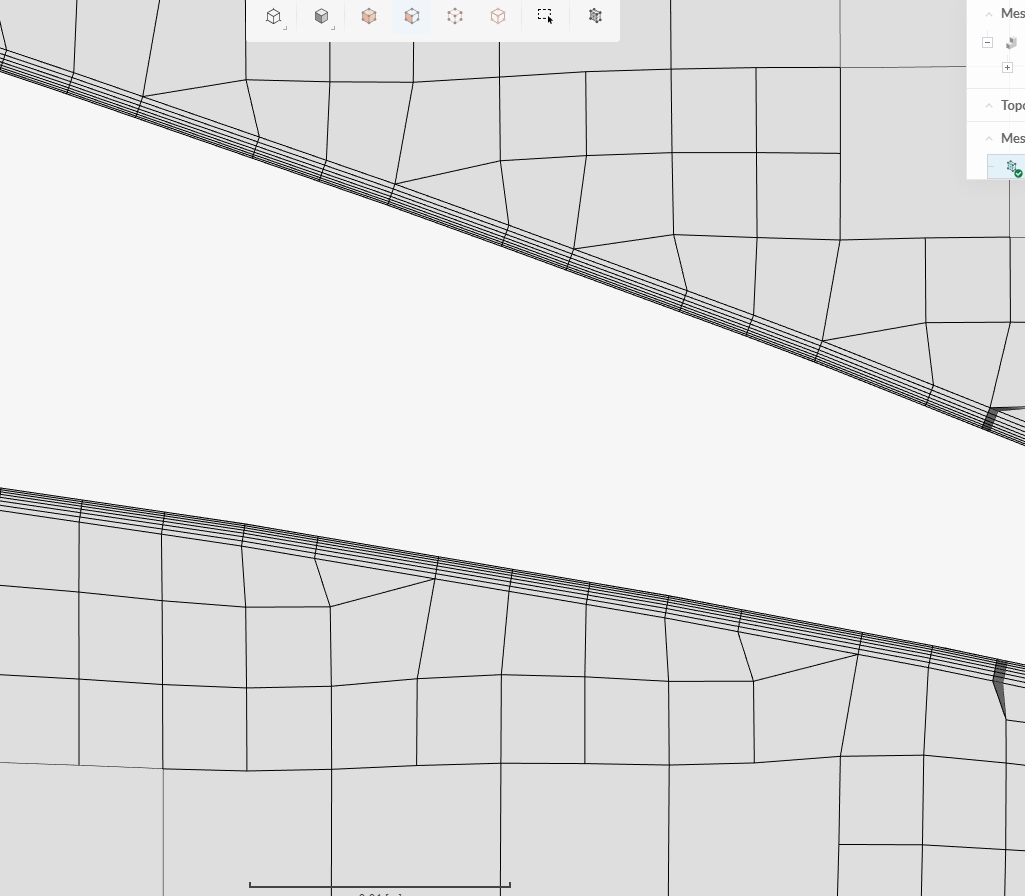
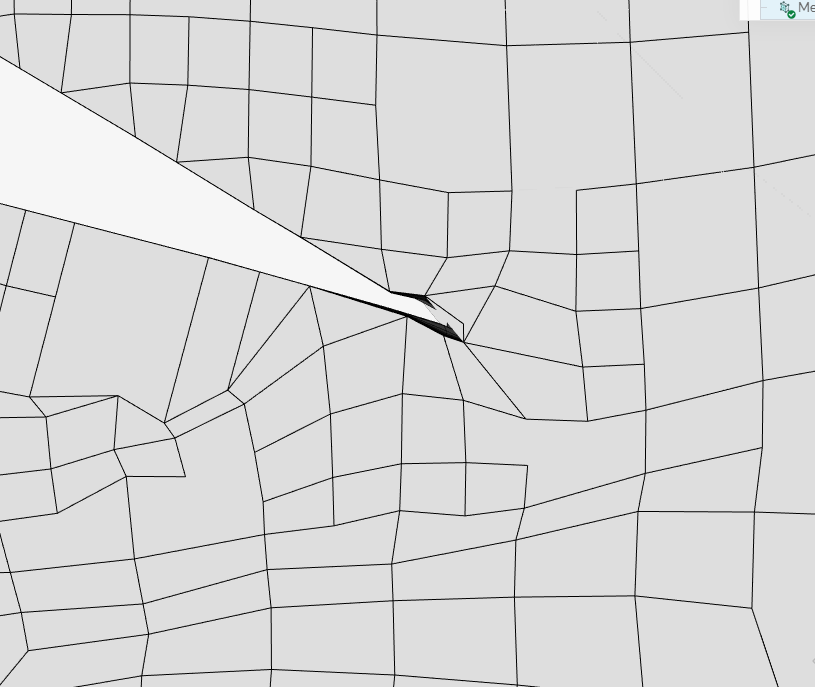
I found a problem in this cells of the mesh surface and don´t know what changes I need to do to fix this cells.
I have already tried to change the values of the surface refinement level, feature refinement and bounding box resolution but it did not resolved the problem.
I uploaded screenshots of the cells.

@jousefm
1 Like
@math_marques96 have you tried turning off various features of the mesh to see where the problem is starting? I might try turning off layer extrusion first or possibly some of the refinement regions.
One other quick note, while that mesh looks really nice, it might be a bit of an overkill; just my opinion. Have you run a mesh refinement study?
3 Likes
Hi @math_marques96
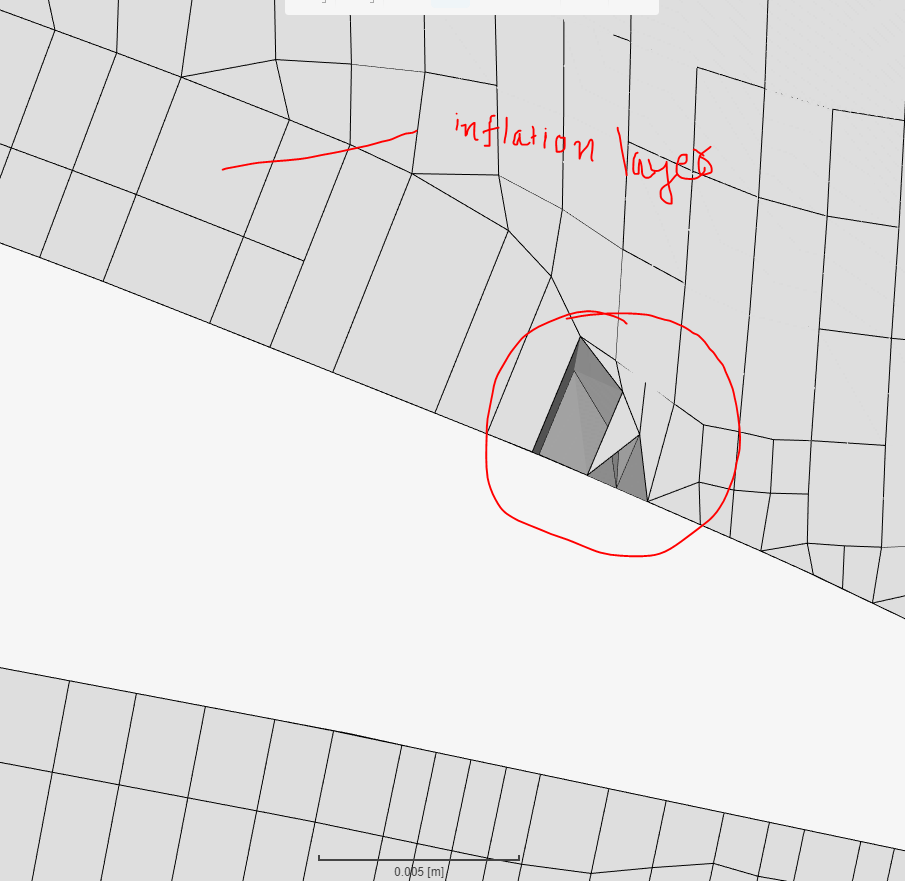
The problem is with the inflation layer. These bad elements are present where the prism layer cells end. I recommend you to improve the inflation layers.
Thanks
Ani
4 Likes
Aha, if it is ‘bad’ Snappy prism cells causing these bumps then this may be a case where you could try INCREASING certain default quality checks that Snappy uses when deciding which of the perfect prism cells to keep, otherwise is there an actual ‘bump’ in the geometry there?
1 Like
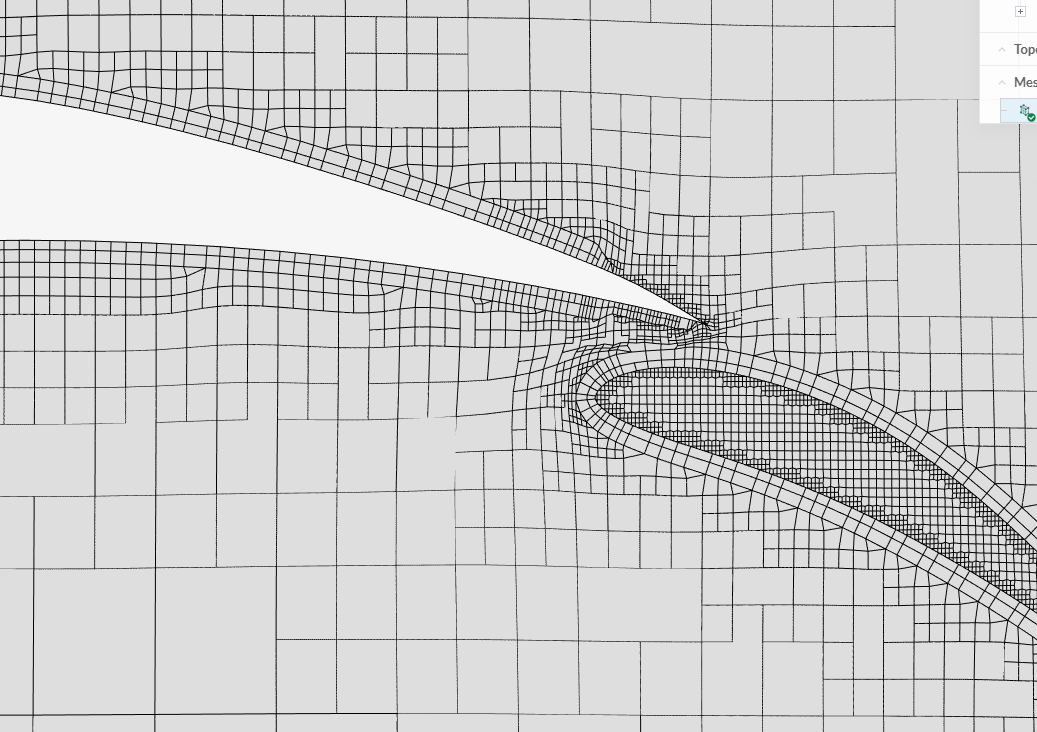
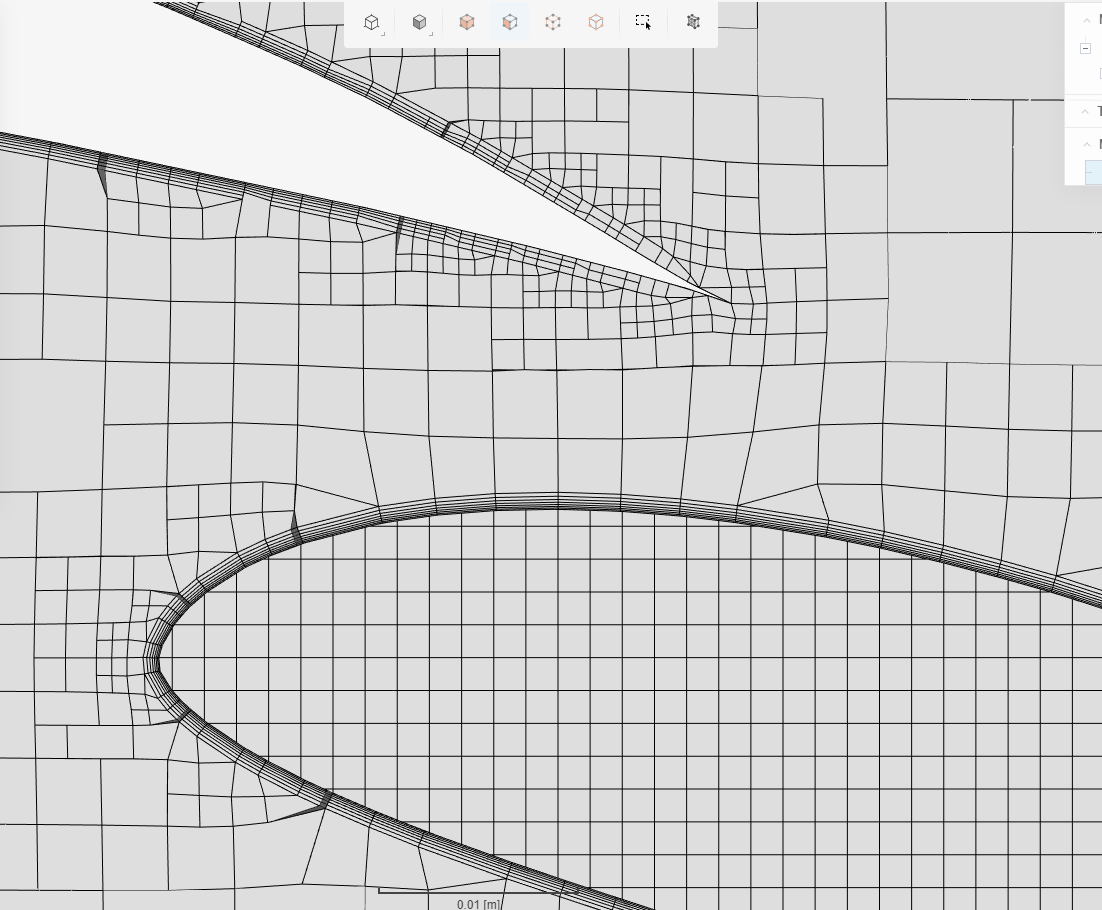
No sir, I verified that there is no imperfection in the geometry. The problem is with the inflation layer. I made a new mesh with better inflation layer settings and it solved the problem.
OLD MESH
NEW MESH
OLD MESH TRAILING EDGE
NEW MESH TRAILING EDGE
Thanks
Ani
4 Likes
Great! Looks good but I see still some pretty nasty gradients from prism cells to the volume cells which I have been led to believe causes issues with results accuracy (maybe another reason to use ‘Relative layering’???).
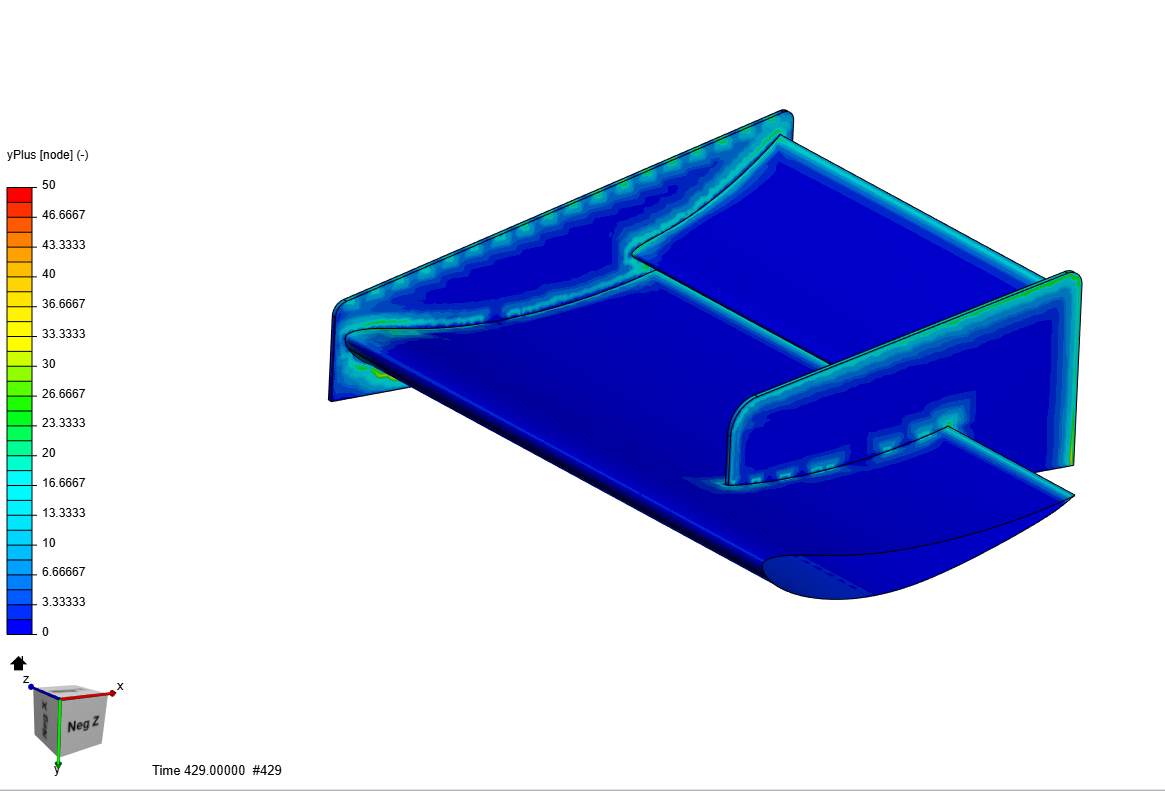
EDIT: Would be interesting to see Y+ at surface and Eddy Viscosity Ratio plots there…
and
I guess I should have deduced that from your last image  of post #6
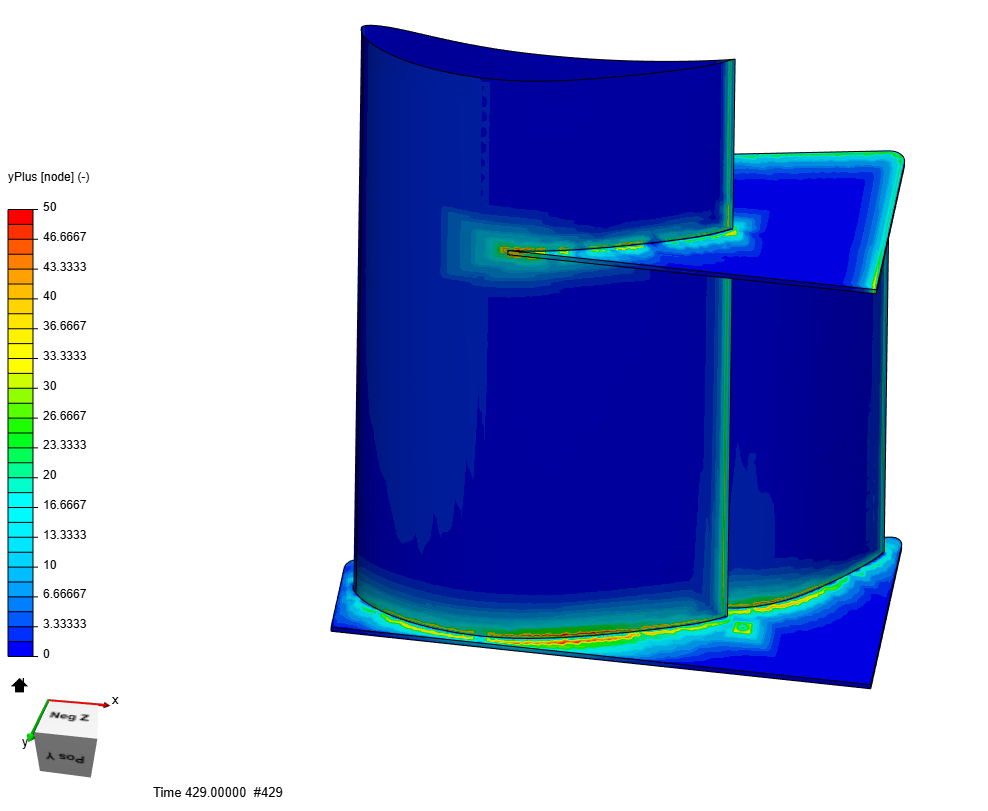
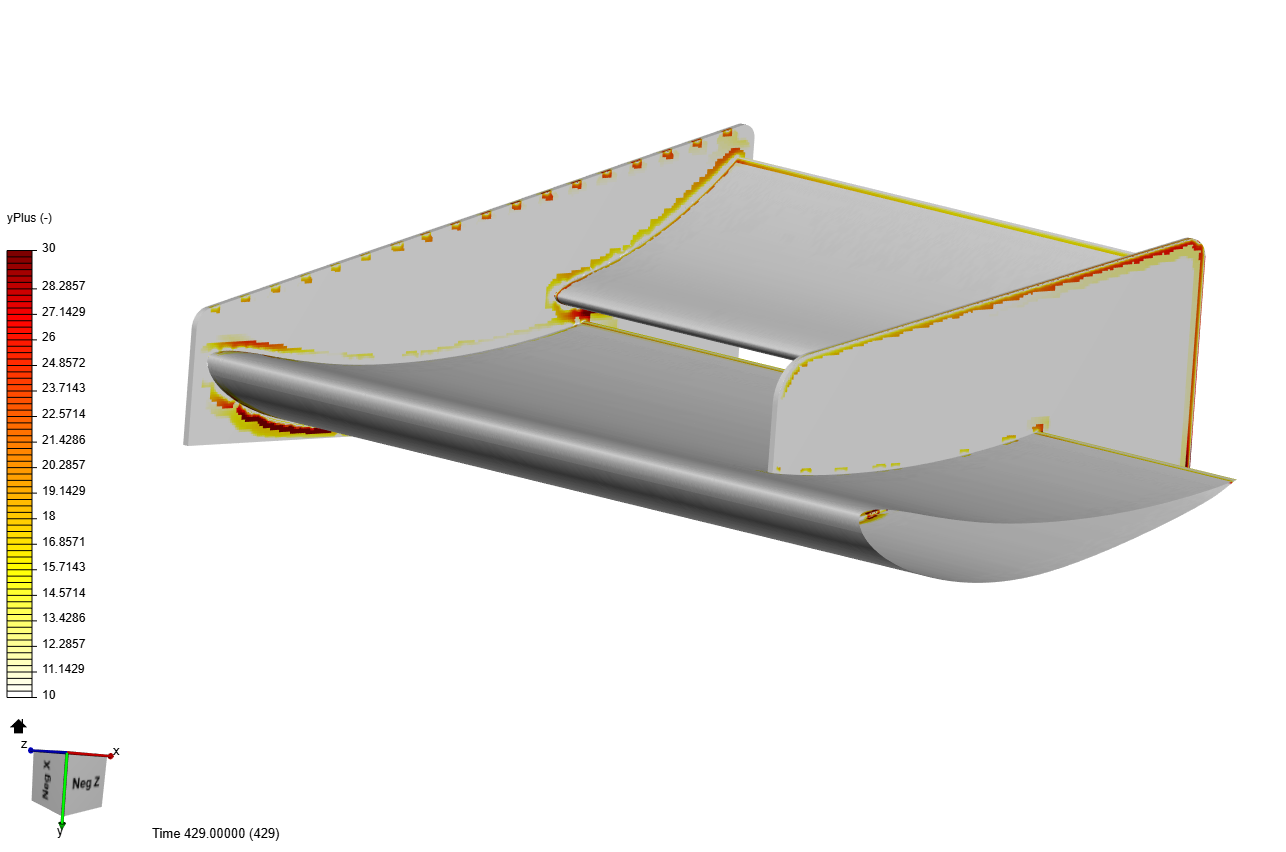
The yplus value on the surface seems to be good  .
.
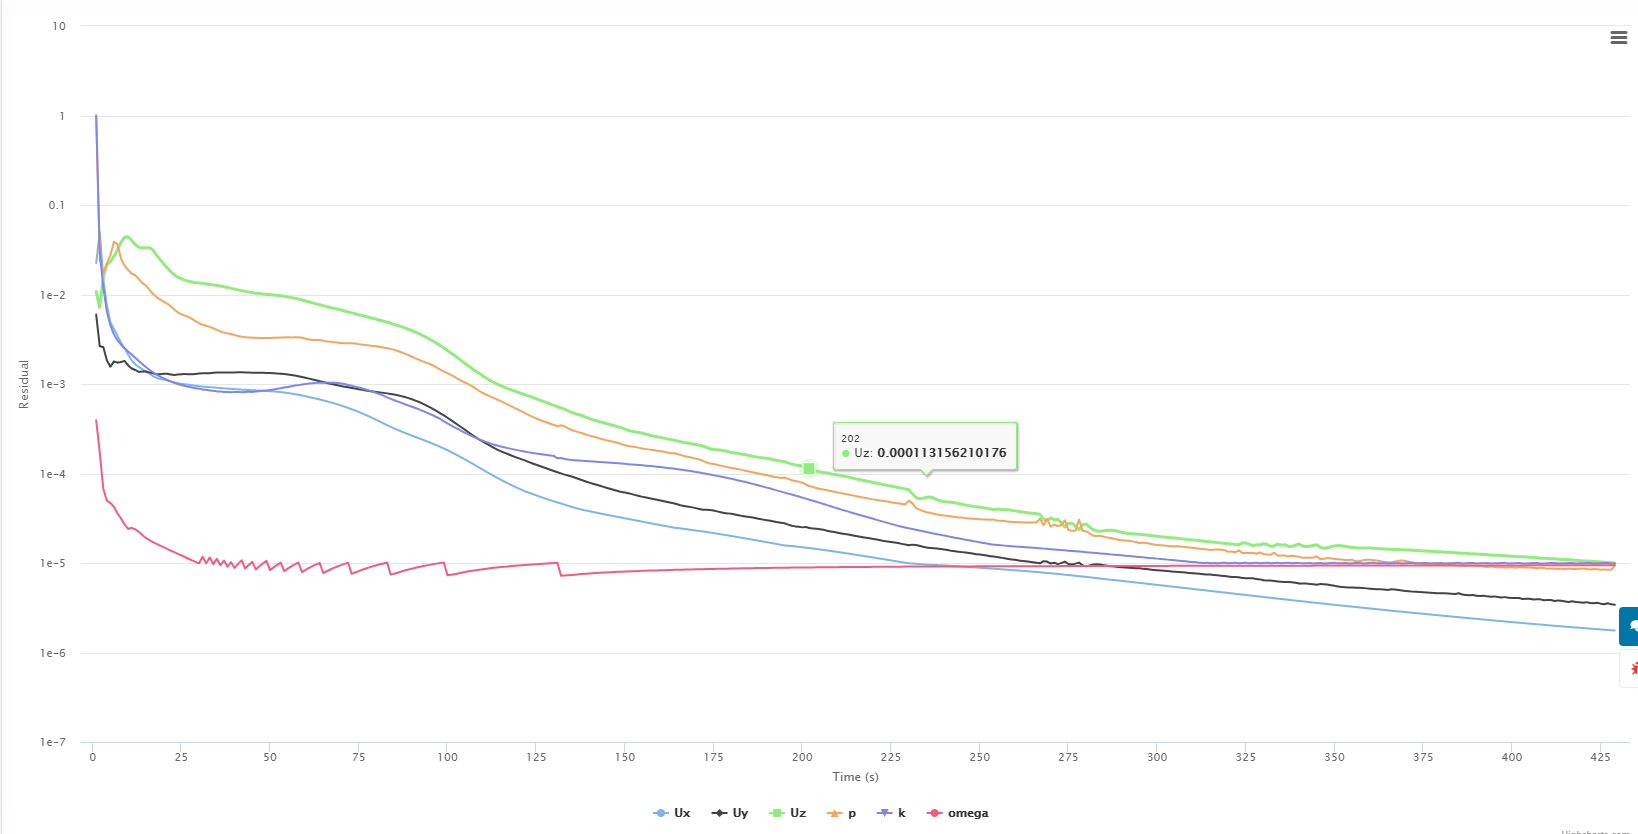
The simulation got converged in 425 iterations
1 Like
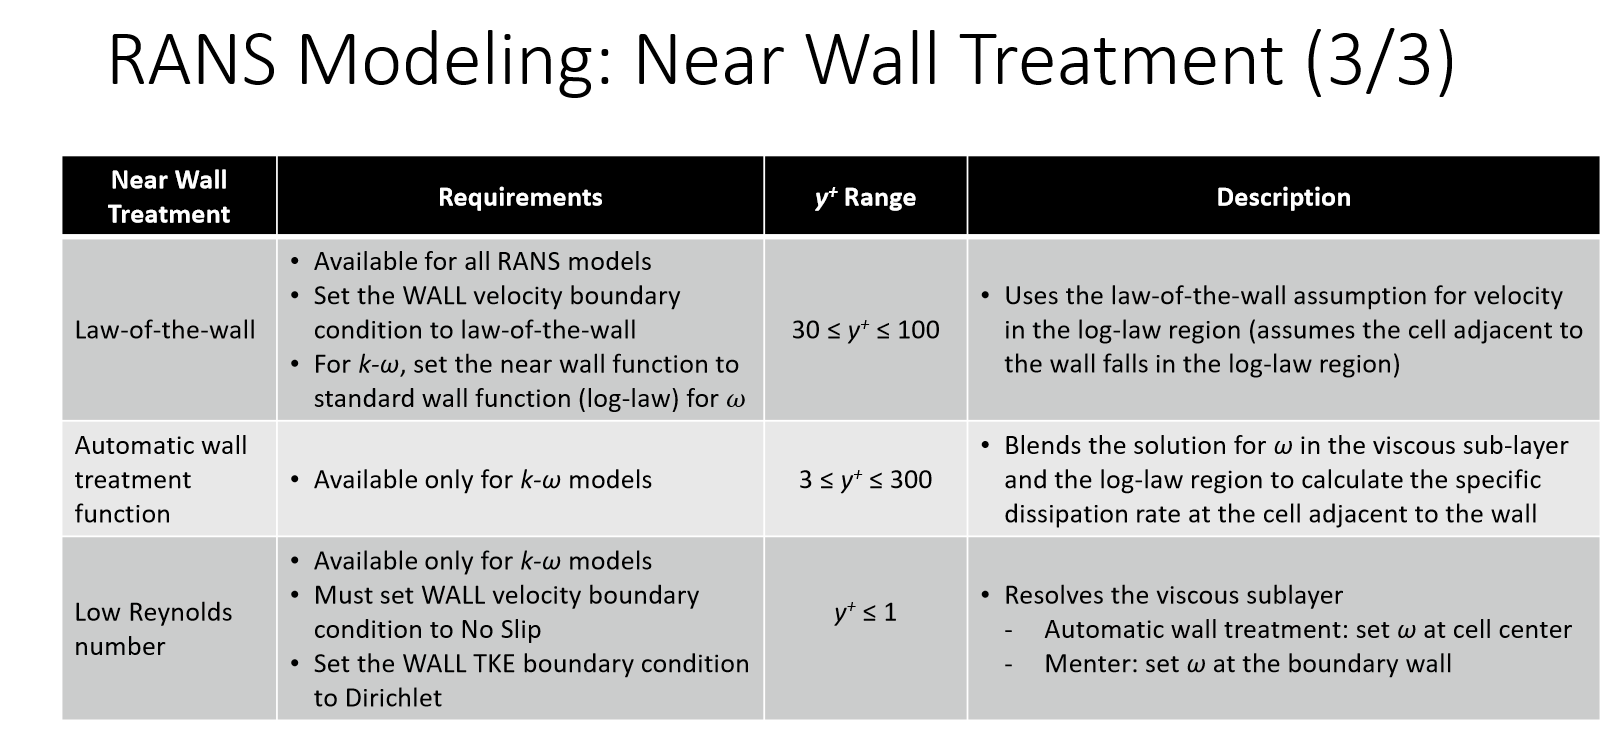
For me I would have to say the jury is still out on that Y+ mapping, is this for Full resolution Y+ values or Wall functions at 30<Y+<300
Looks like a lot of Y+ could be in bad territory between using either Full res or Wall functions…
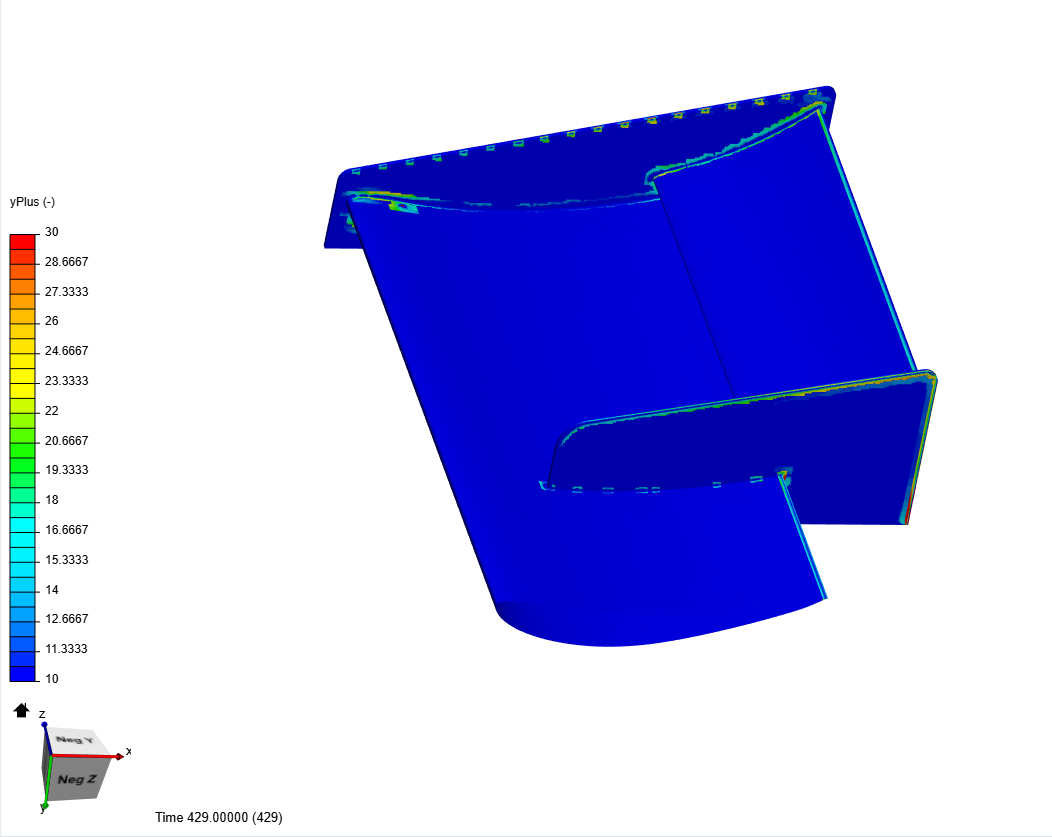
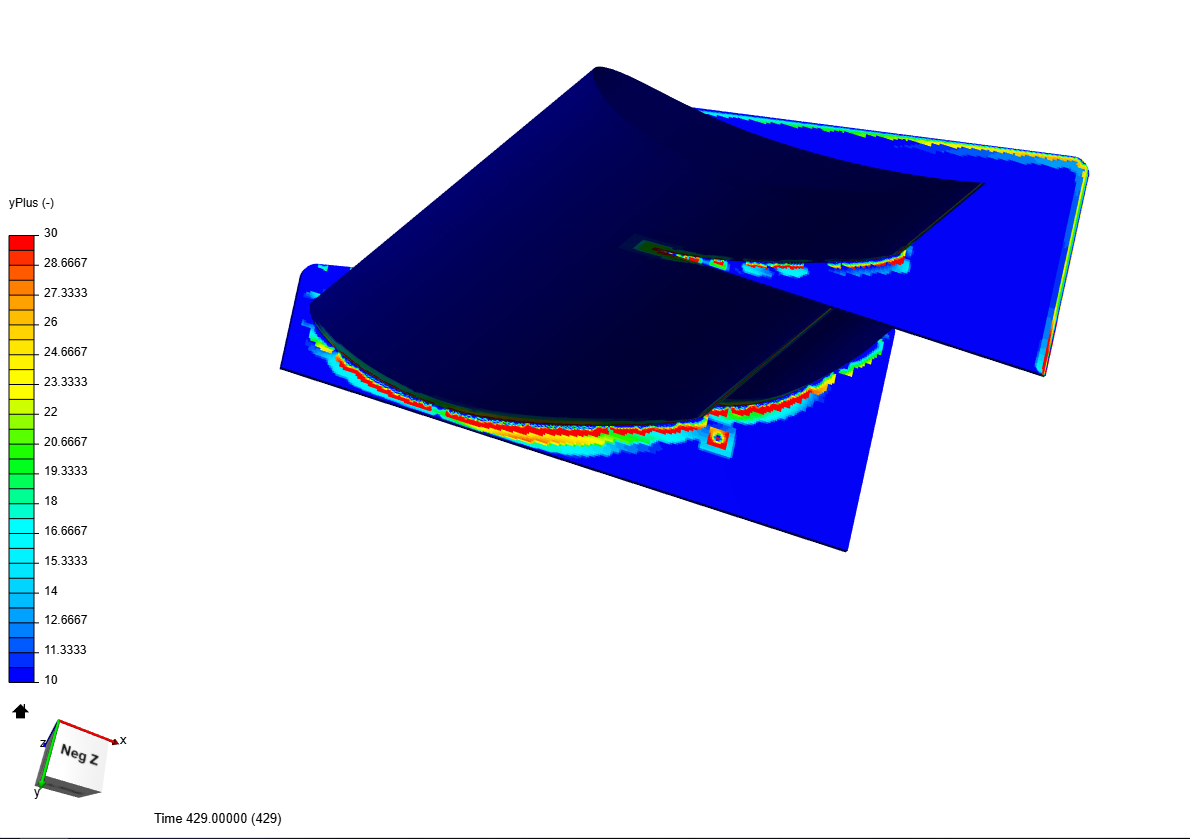
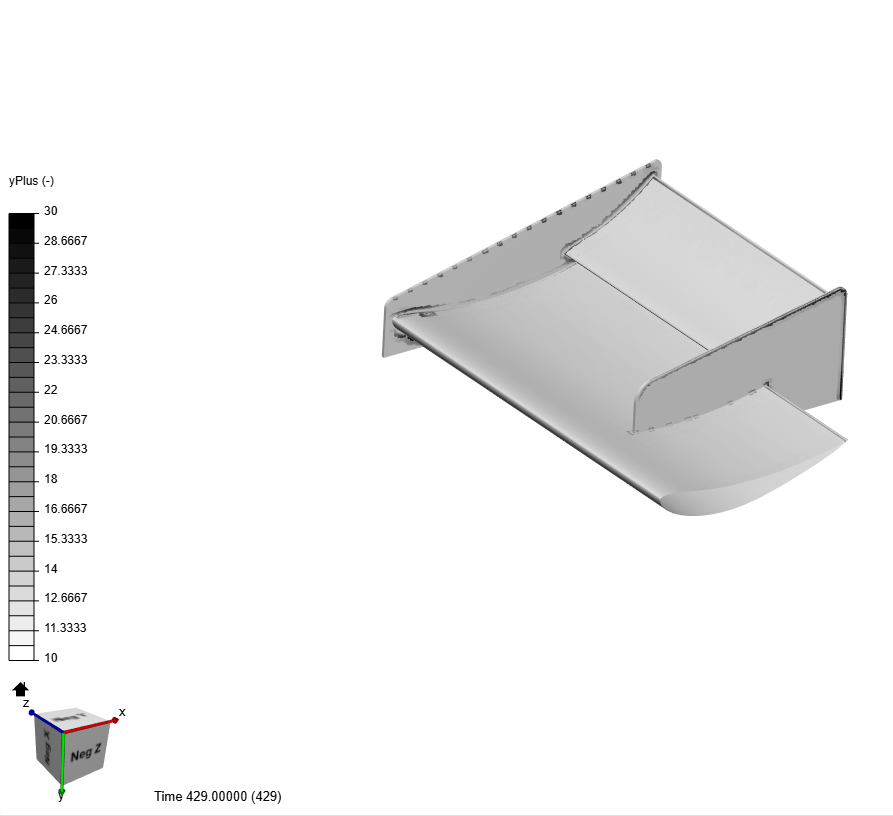
I think that Bad area for us using κ-ω SST is 10<Y+<30 according to this (but I just recently learned this and have not run any validity test on this range)
I hope you or someone else tries to make those Eddy Viscosity Ratio plots, saving me the time to figure them out
Yup @Lwhitson2 is absolutely correct about the yplus value for k-omega SST model. The shear stress transport (SST) k-ω model is a two-equation model that combines the advantages of the k-ε and k-ω models. This model uses a blending function to gradually transition from standard k-ω in the inner boundary layer to standard k-ε in the outer boundary layer. The standard k-ω model performs better in the near-wall region while the standard k-ε performs better in the free-stream region.
Also, there are not much cells with yplus between 10 &30.
These Wall treatment method are used by some other CFD software. Just wanted to share this with you guyzz.
7 Likes
@DaleKramer you’re never going to get a perfect Y+ value everywhere on your model. The key is to get Y+ correct in the most important parts of the flow. Overall I think the Y+ looks really good on this simulation after @anirudh2821998 made his updates to the mesh.
4 Likes
Yes but I do not think I could easily see that from Ani’s first Y+ mapping presentation. The second mapping of 10<Y+<30 does confirm this for me.
Very good Ani !!!
EDIT: And just to confirm, this will be a Full res Y+ simulation, correct?
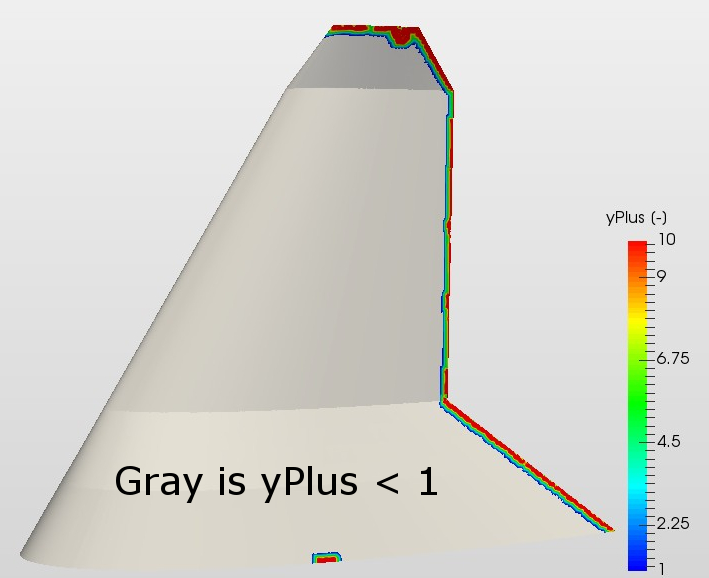
also, I like to show mappings like that with a Grey area for Y+<10 , I know we can do that I just don’t remember off hand how I did it, or Y+<1 like this:
1 Like
Sir, Is this what you are suggesting??
Not really, I added an example while you were posting, it still shows rainbow 1 to 10
Well, there is a white to brown color scheme but I can’t see any raibow type color scheme. Did you use some other post processing tool?
I don’t believe so but it was with old workbench, maybe can’t do this anymore…
I did add the ‘Gray is y+<1’ text in an image processor tho.
Hello Ani,
For this inflation layers parameters you used relative layering?
And this layer calculation is for a full resolution right?
Did you just changed the inflation layers parameters?
Would it be good to alter the surface refinement level, region refinement level or the bounding box resolution in Ani´s mesh to have a smoothier transition from prism cells to region cells?
No
Yes
I just modified the size of the bounding box(made it a bit larger) and changed only the inflation layer parameter.
It is a must to simulate your problem with atleast 2 different quality mesh. This will provide you with an idea of the deviation in results with mesh fineness and will also serve the purpose for mesh independence study.
1 Like
To add to this, I would suggest running a full grid convergence study using at least three grids and verifying the order of convergence for your model. This would satisfy the scientific/research level requirements and is great experience to have in validating your model. Here is a link to a great article by NASA that will help you in the calculations. Near the bottom is an example of the grid refinement study.
Examining Spatial (Grid) Convergence
4 Likes