Hello Simscale world!
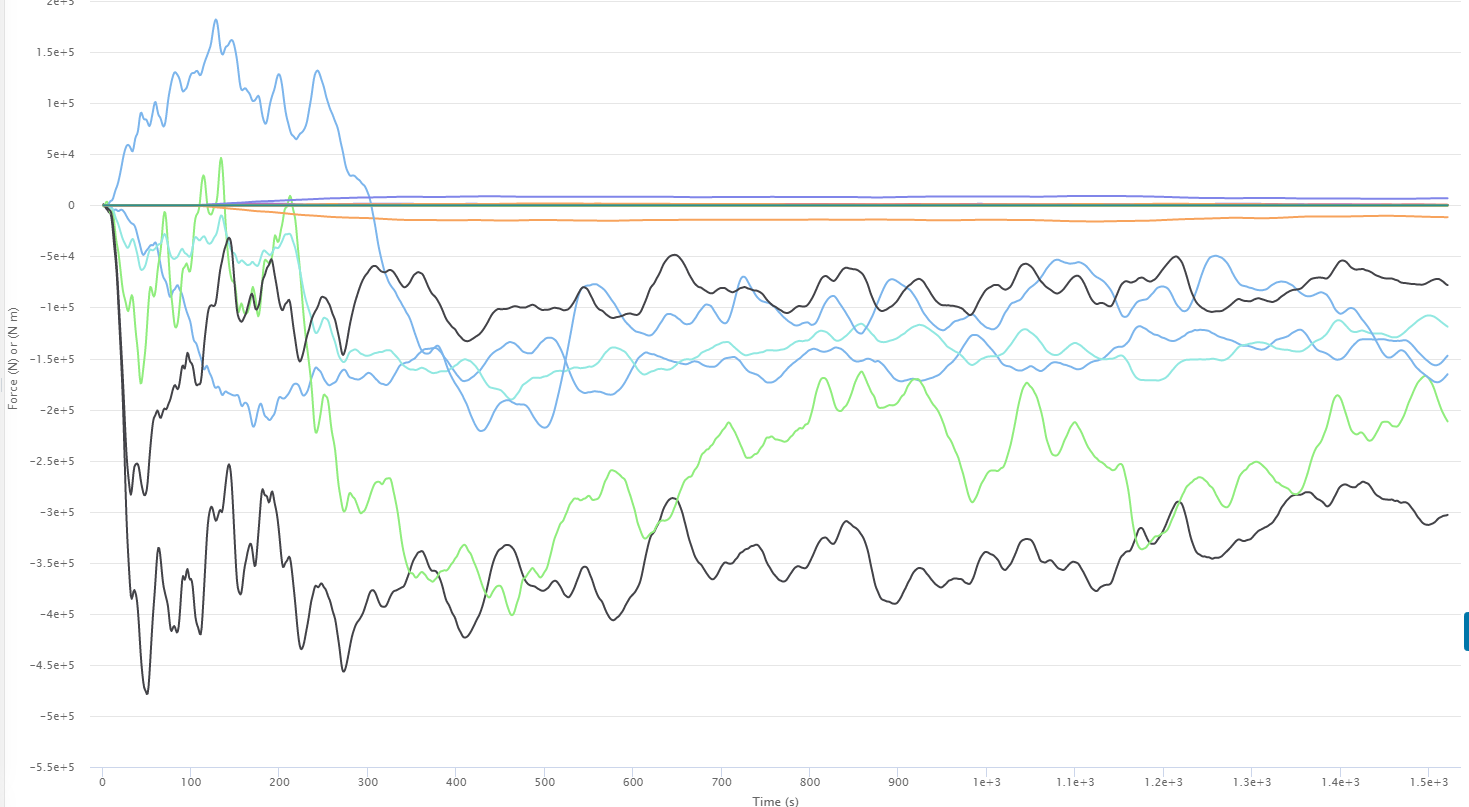
I am facing an issue with my CFD simulation around a wing element. The problem is unclear for me now and it’s with the convergence. The residual plots are looking fine. Since I am carrying out a wing element performance study, force plots are my key outputs. The force plots are looking more like “ready to converge” but it’s not getting perfect. I have posted the link along with and hoping for an expert to reply me the tips to overcome this.
Link to my project: https://www.simscale.com/workbench/?pid=5351910015691072018&mi=run%3A5%2Csimulation%3A2&mt=SIMULATION_RUN
Thank you so much.
Arjun
Hey Arjun!
I do not see any flaws in the setup, maybe I missed something here. @cfd_squad (@yosukegb4) , can you guys see if you find anything here?
Cheers!
Jousef
Hey @a_v_nair,
I’ve taken a look at it and have 2 pointers:
-
There’s no result controls for yplus. By visual inspection your first layer thickness is around 1,7e-4 m thick, which should result in y+ between 5-10 on the airfoil. This is quite bad because this is not consistent with neither wall functions or full resolution treatment.
-
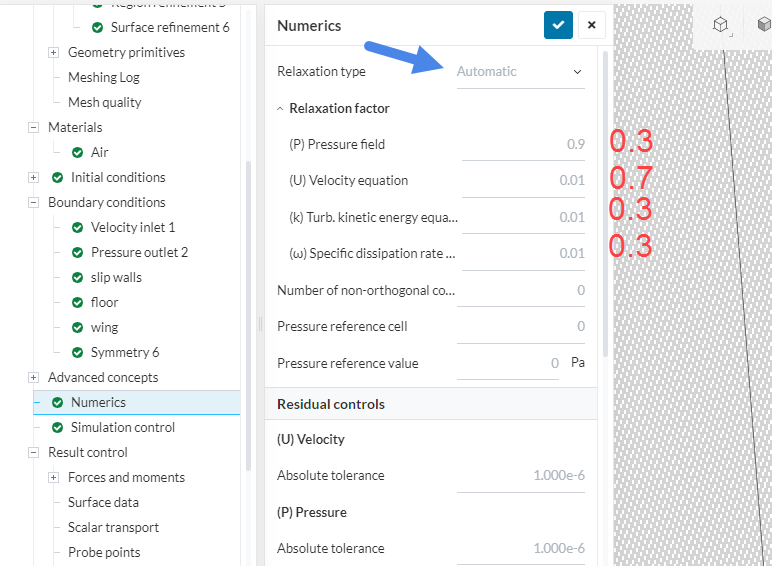
Recently, under numerics, the default relaxation method was changed from manual to automatic. It might be worth giving it a shot with a manual relaxation aswell (default values should work fine!).
Let us know if you’re able to progress!
Thank you so much @jousefm for the rapid response and @Ricardopg for a very clear guidance. Sure, I will check that way and will get back with the results.
cheers!
I am back @Ricardopg and @jousefm
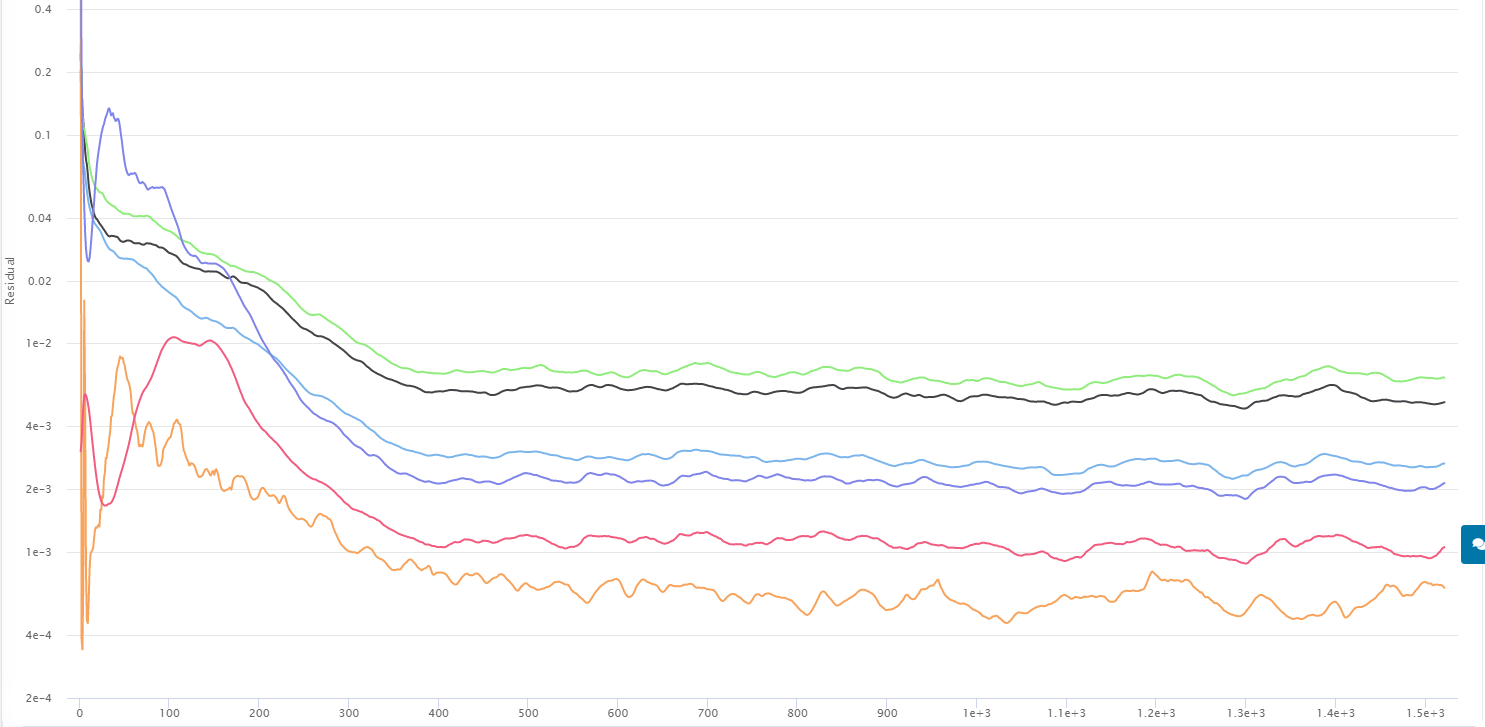
I have made all necessary changes and had run the simulation. The force result look more than acceptable now but I have a doubt with the residual plots. The velocity residuals are settling well and is only having very small changes but the P is not going to smaller values. I was on a research on performance of wings having different cross sections and thus I wanted a precise output. I have gone for y plus of 0.6 (first layer thickness= 9.9281988E-6) and with an expansion ratio of 1.1 until y plus= 4.8 (till viscous sub layer end). Full resolution method was used and I have used 1.2257 as the air density and 1.7965E-5 as the dynamic viscosity.
Can you please check my results and comment on what I have got ? I need your suggestions on the credibility of my results too.
- Does the yplus calculation at the result control happens at the end of simulation? I am not getting proper y plus results from post processor while the simulation was running. (result write is set at 1000 and the simulation has reached at 800 only now)
Attaching link here: https://www.simscale.com/workbench/?pid=5210312451880122257&rru=ead69002-3d49-4f22-8f8f-33be36a1603b&ci=28b571da-c703-43db-afe3-43a9d43c4892&ct=CONVERGENCE_PLOT&mt=SIMULATION_RESULT
Thank you @Ricardopg and @jousefm for helping me improve my results. Waiting to click of the “problem solved button” 
Hey Arjun,
Sorry if im hijacking your thread a bit here, but i have a suggestion for your Y+ analysis at the end of this post.
If i could step in quick to say im also having problems with my convergence results. I was also unaware of the change to the numeric settings and ran my simulation with automatic relaxation type.
Here is my project link
- What values are used with automatic? does this override the manual input of relaxation factors that @Ricardopg pointed out in his picture? As in changing the factor over time to increase stability?
- would you recommend to always use manual with the default settings?
I normally use 0.5 for both (k) and (w) as this was the recommendation from the FSAE tutorial. I have not done extensive research on the effects of relaxation factors on the simulation results but my general understanding is that relaxation helps the solver to slow down the changes to variables in the equations throughout iterations.
This means with my 0.5 setting, im allowing more changes to occur in solving then 0.3 which would either :
- increase the number of iterations it takes to get a good convergence value (for me i think 10^-4 is ok) and will require longer simulations. Which is not the best case.
- Allow for a higher fluctuation of results, meaning slightly lower accuracy and the need for more iterations to get an average value that the solution oscillates around. Which also increase the needed simulation time.
Please correct me if i am wrong here!
Here are some pictures to show what is happening:
Convergence plot
Forces & Moments plot - sprung mass - about CoG
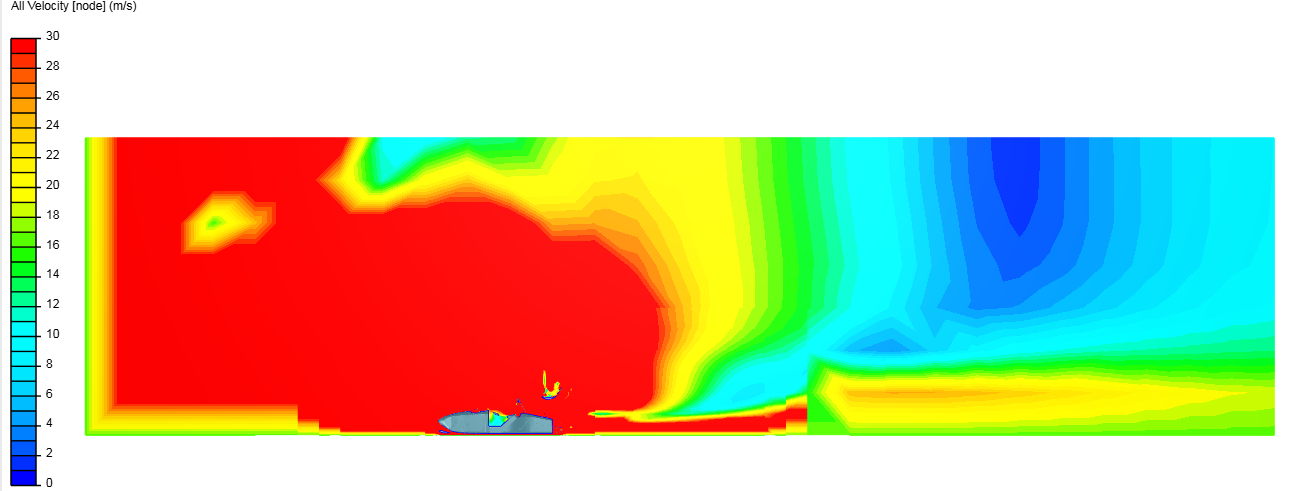
Cutting plane … clearly this is no good!
My inaccurate results could also be due to the following mistakes done in this past simulation
- i forgot to add a surface refinement to the rear motor, which somehow meshed anyways but is very coarse.
- My mesh fineness is too low (however this is a requirement in order to not have memory problems with the full car sims)
- other numerical or simulations settings that are negatively effecting the results
Also a known problem was that my Forces and moments coefficients are messed up because i accidentally forgot to cut the reference area value (frontal cross section area) in half for the half car simulation.
Rant is now over!
@a_v_nair from my investigations into appropriate Y+ levels, i have found that a target of Y+ LESS THEN 1 is best practice. If you extend your Boundary layer towards the upper limits of the viscous sub layer, you will most likely have cells in the buffer region, affecting your results. In order to verify your Y+ levels, the following can be done:
- add the Y+ result control
- Download the Y+ Histogram .exe created by Dale here
- Download Paraview
- Follow instructions from my instructions document here
using these programs, you can find your exact Y+ values, and verify the stability in your results.
Good Luck!
For automatic you can specify the initial values. The values will change throughout the simulation (it’s dynamic).
The mesh in your project has a decent number of cells in error (30) and volume ratio is also kind of high (127 max). You can use the newly added mesh quality visualization feature to try and spot these bad cells & locally improve mesh quality.
And you can also switch back to manual relaxation any time, in the Numerics tab.
Thanks for letting me know about the quality checker. I was literally just looking into how to use the OPENfoam checkmesh within Simscale. I really would like if there was a news on updates from Simscale with a quick overview of what has been changed/updated. If i had know about this feature i wouldnt have run my simulation, saving a lot of core hours.
Anyways, is there any documentation on how to use this Mesh quality feature? it just brings me to the solutions field interface, but i dont know how to check for the quality visually?
EDIT i think i found it with the iso surfaces feature
It works just like solution fields. You can find quality parameters under “results”. A nice filter to use is isovolumes (to highlight cells in a given range of a chosen parameter).
Hey @dschroeder, you owe this post mate 
Thank you for hitting a big reply button here. Don’t worry, I enjoys reading on aerodynamics and CFD. Hoping that your projects are hitting success.
Happy to see @Ricardopg back. I have a question please:
If I go for full resolution wall turbulence approach, at which Y plus I should stop the boundary layer meshing? Is it necessary that the last grid cell should not cross y plus of 5 or laminar sub layer? If so, whether the log law region will be kept out of calculation? Actually everybody says the first grid cell must be within y plus of 1 but it really confuses me on the y plus value at which I should stop growth of boundary mesh layers. @dschroeder already gave an answer to me but I just need a confirmation from you both.
Thank you all for being here!
I am by no means close to an expert on these topics. Whatever Ricardopg says is definitely correct haha.
However from my limited knowledge, the Y+ histogram program from Dale was a lifesaver. This is because its very hard to give an exact number of Y+ or amount of layers that will result in your desired range, and all of these settings are completely dependent on your specific geometry, refinement levels, bounding box sizes etc…
Therefore, when using the Y+ histogram with your current simulation, you will get an output of EXACLTY how many cells are under the Y+=1 range, above the Y+ =1 value, or between 1 and 5. In his program the range can be custom. You will also know the average of all cells under your desire range. With this knowledge you can verify that your Y+ is good, and if not, know by what percentage it is not in the favorable range.
Simply do another simulation with either less BL cells or reduce the total thickness of the BL, then check the histogram again to see if your results are improving.
Thank you so much @dschroeder!
I will definitely make use of the tips given by you. Cheers mate