Whether you are running a CFD or a FEM simulation, there are various use cases that would require you to identify the location of the maximum and minimum associated with a particular solution field (Displacement, Pressure, etc).
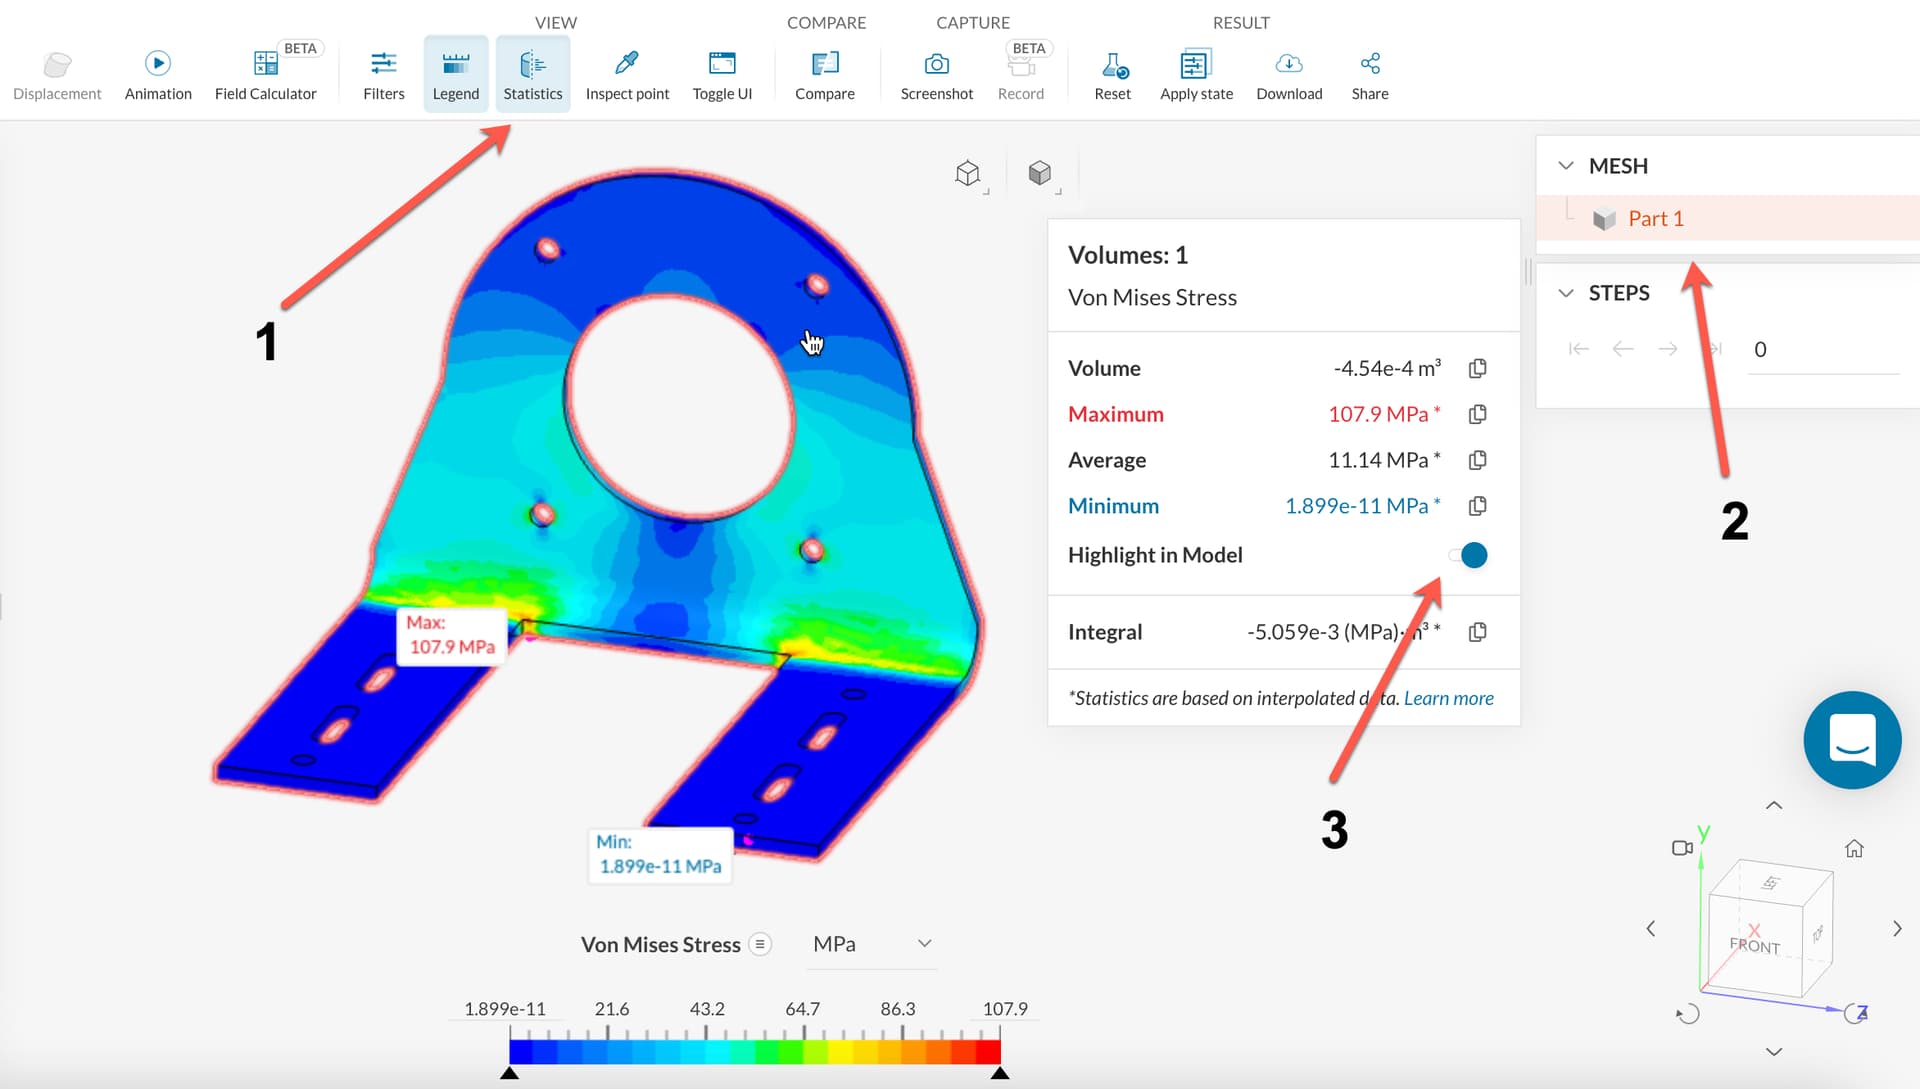
The statistics tool inside the post-processor allows doing so very easily as highlighted in the image below.
- Enable the statistics tool
- Simply select any face(s)/volume(s) that you would like to obtain statistics on
- Toggle on the “Highlight on Model”
It is useful to know that the statistics tool is dynamic, which means once enabled you can go about selecting more faces/volumes and the results would be updated automatically in the statistics result window.
If you would like to know more about the SimScale post-processor, kindly refer to the following documentation page.