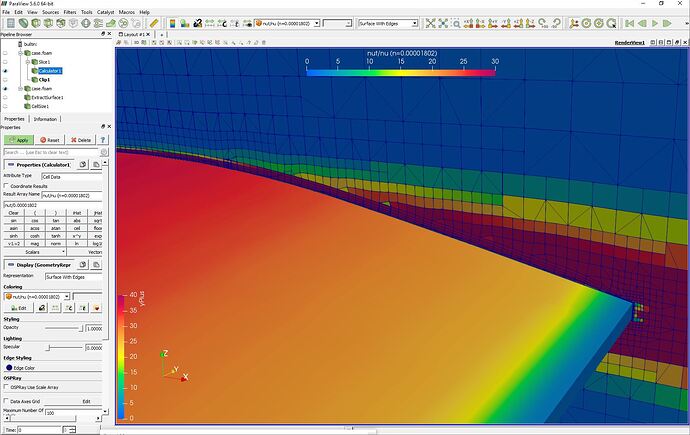
I am finally able to use ParaView well enough to get some images that match what my brain wants to see 
I have used the link @LWhitson2 provided a while back which expalains EVR plots. This is the link.
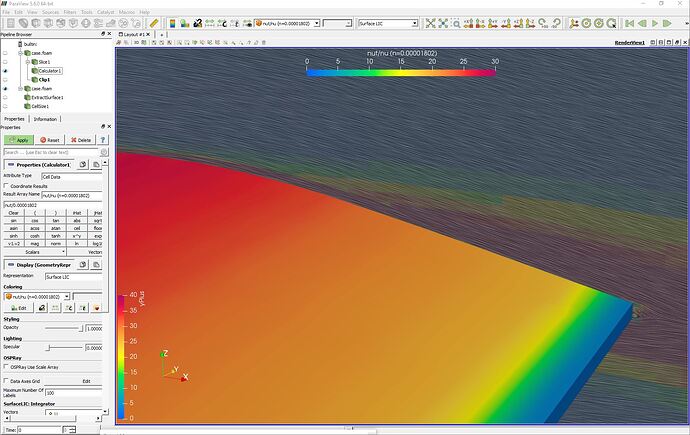
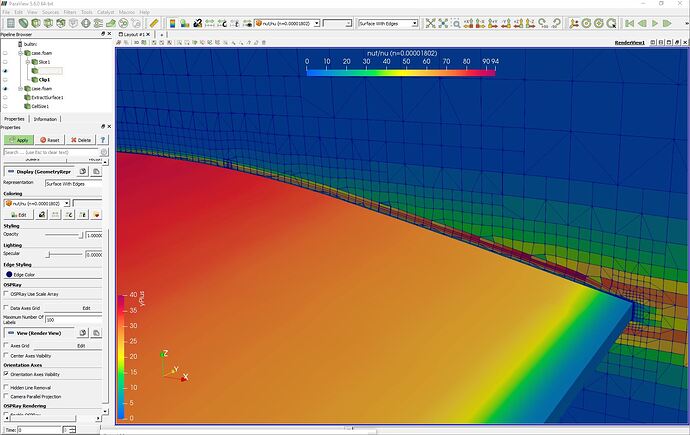
First I would like someone to interpret these 3 EVR plots (the 2nd just adds LIC to see how well attached flow is) that I have made, as they stand, on their own.
I will supply more information about the mesh and sim parameters as needed.
I have my own interpretation, but that is from a very newbie perspective, so I don’t want to say much yet 
I am concerned about how I would change the mesh to better allow my boundary layer to be precisely analyzed as the connected flow approaches the trailing edge…
Any EVR experts out there (@LWhitson2  …)
…)
.
.
.
.
.
.
EDIT: Funny, at the autoscale color range, it looks like the BL is resolved much better???
I was just assumed that the correct range to view was what the link used, another ass u me issue ???
Hi Dale!
If you have your values of the EVR it just indicates the laminar or turbulent regimes. That’s actually just an “easier” way to think about the physical part than directly prescribing Reynolds stresses or k or epsilon at the inlet (for the inlet we usually prescribe the turbulent intensity). What was your interpretation of the EVR?
Cheers,
Jousef
Yes, that is my impression so far but I was trying to follow the logic at that link…
They use a 30 EVR max on all the sample plots they show, I now think that is not a hard and fast rule, as you say, the actual magnitude of EVR will be based on the turbulence values use for the simulation.
I guess I would like to know, is the 30 EVR max a hard value for interpretation 
My turbulence initial values were: k-omega SST with k=0.00325 m^2/s^2 and omega=142.5 1/s …
Hey Dale!
For most turbulent cases the range is around 1e3 to 1e4 (shear layers, fully-developed duct flows etc.) but from what I have read is that usually at free-stream boundaries of most external flow the EVR is between 1 and 10. However you are correct here Dale that this ratio can be used to see where the mesh has to be resolved better. I would have to read this up again and do a small research - forgot the exact procedure on such cases to be honest 
By the way, for k and epsilon, have you considered this post from @1318980 (Darren): Defining Turbulent Boundary Conditions ?
Best,
Jousef
I am pretty sure if I looked at that last fall, when I decided to use dylans method for k and omega calcs…
I will have a look again when my SimScaling gets less hectic 
![]()
![]()
![]() …)
…)


