hello,
I try to double clicking on legend bar as described here:
but it has no effect. What can be the reason?
What I want to obtain: I want to adapt the range limits to the values of one of the (several) solids which make up my model. So in my case I don’t know the limit values to which adapt, but they should be found and set by the postprocessor in a kind of automatic way
thank you Sebastian
this was a step ahead but not completely resolved.
In
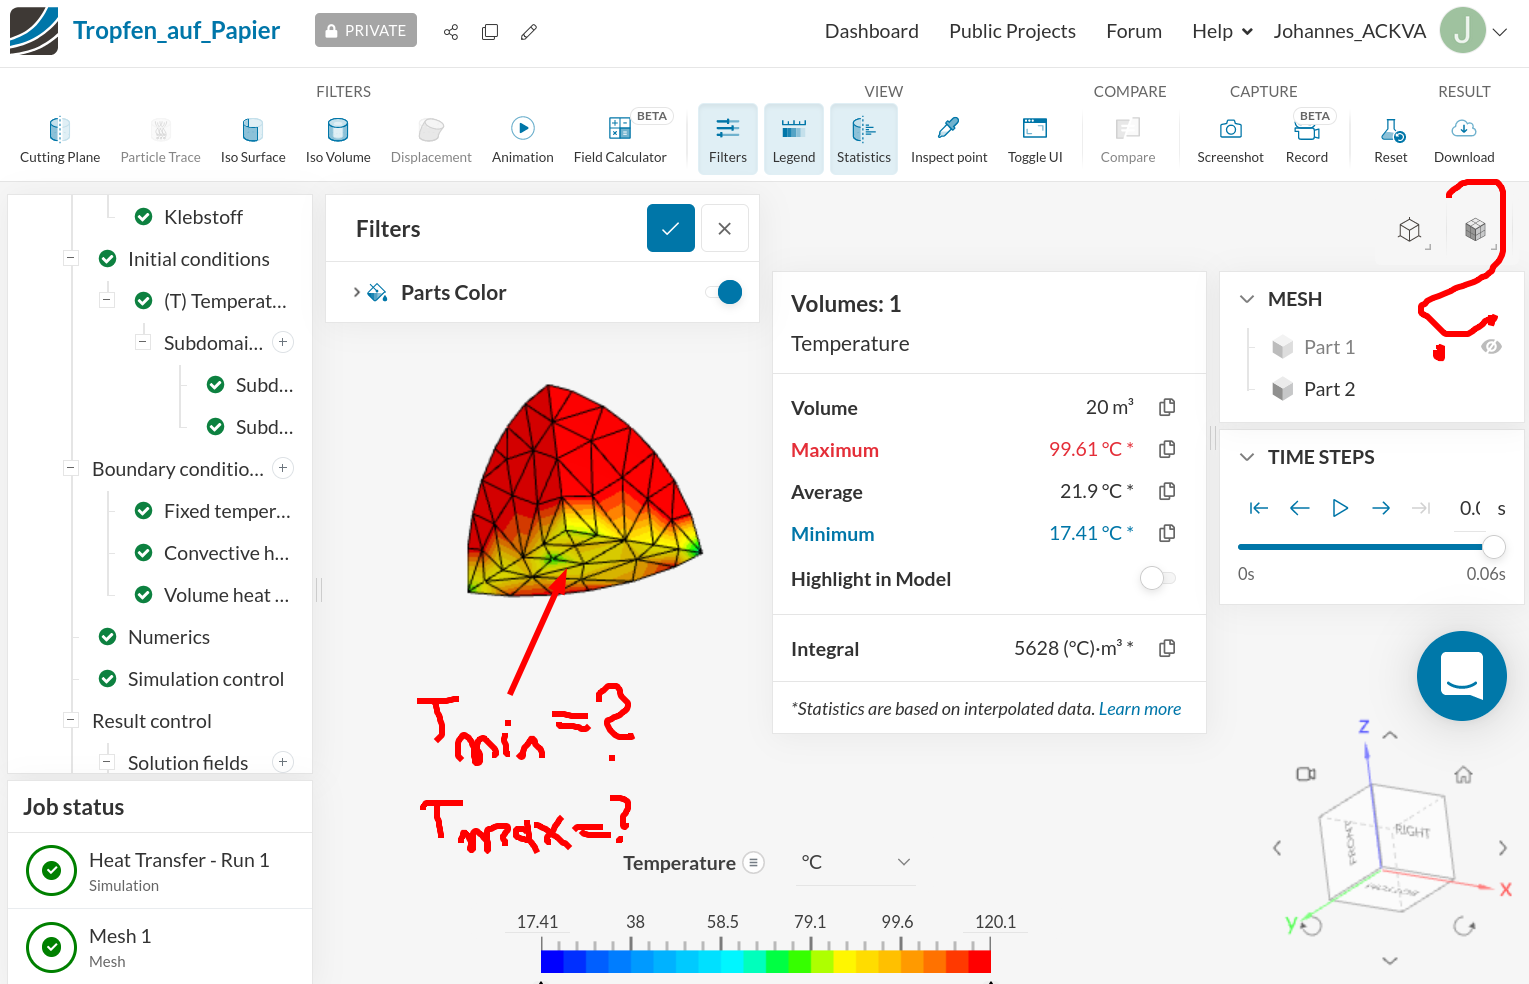
Figure 7: The Statistics feature in the post-processor gives you the statistical data like min-max and average of the physical quantity.
“2” shows how faces can be selected clicking on one of 4 icons. But I have only 2 icons of them (“Change view mode” and “Change render mode”).
How can I resolve this?
there is more which I don not understand: how the filter Statistics when selecting a volume should work.
In the model (of my link above) I have 2 solids (“Mesh Part 1” and “Mesh Part 2” in the most-right window). The statistics filter changes it’s results when clicking on Mesh Part 1 or Mesh Part 2 or when clicking on one of the volumes in the Viewer.
When clicking repeatedly (on a solid in the viewer or on Mesh Part*) the values in the Statistics window switch. They show alternately min/max of the whole model and min/max of one of the volumes.
And the solids are named in the Statistics window “Volume: 1” and “Volume: 2”
(which makes confusion since there is already “Mesh Part 1” and “Mesh Part 2”).
Should the documentation explain this behaviour better?
And about the adaption of the range in the legend: the doc cited by you above says: “By clicking on the minimum value of the scale range, you can set your custom values.” But is there a way to adapt min/max to only 1 solid?
Hi Johannes,
thanks for having such a close look at our product. Your feedback is much appreciated.
In regards to your point:
And the solids are named in the Statistics window “Volume: 1” and “Volume: 2”
(which makes confusion since there is already “Mesh Part 1” and “Mesh Part 2”).
Here “Volumes: 1” and “Volumes: 2” represent the count of the Volumes selected.
In regards to the legend for individual parts, is unfortunately not possible.
However, there is the option to use ParaView for more extensive post-processing.
in regard to the statistics filter selection, i have reached out to our development team for clarification.
I needed a long time to understand that! Proposal: could the title be modified to “Number of Volumes: 1”
(2)
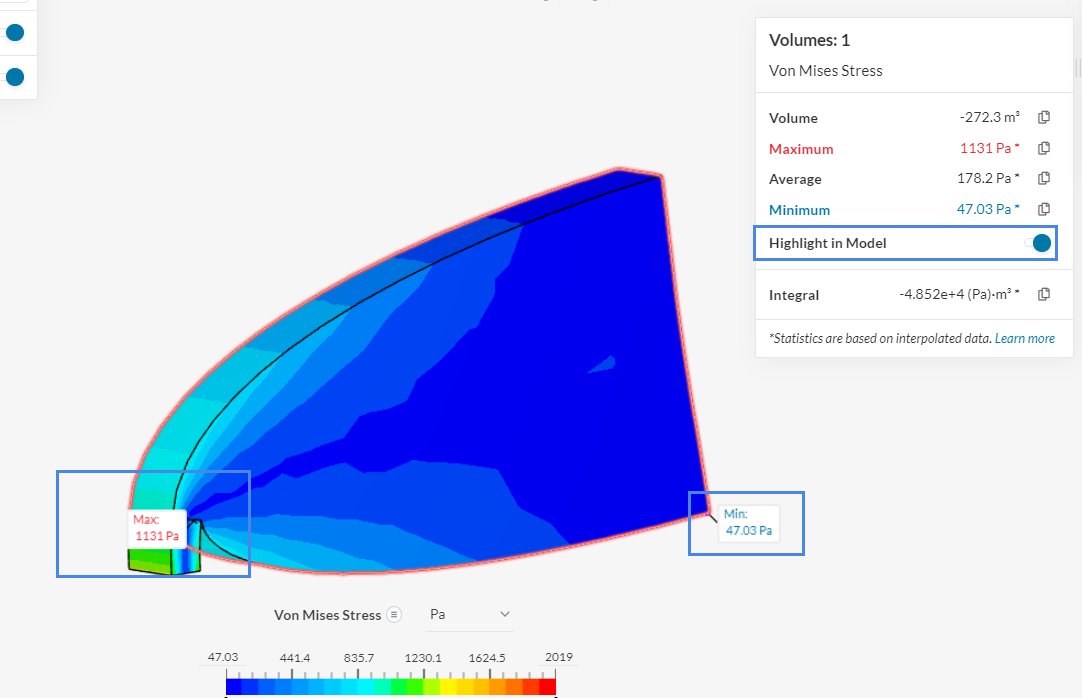
Ok I understand, no automatic adaption of the legend bar to a single Volume. But I see, the min/max values can clearly be shown with the statistics filter and the min/max locations with the Highlight in Model toggle.
(3)
I think with the selection a user can easily be confused. The color changes from red to not-red even when only hoovering with the mouse over the solid without clicking on it.
I have an idea how I would modify/complete section 3 of the postpro documentation, perhaps it is interesting for you:
“”"
Click on the outlet face to select it.
An information box will appear in the viewer, containing minimum and maximum values, averages, integrals, and additional information related to the selected parameter.
The clicked face will appear in the viewer with a red colored frame.
You may also click on multiple faces. The information box will then show the results of the union of the selected faces. The title in the information box shows the number of selected geometric entities (faces, volumes,…). Be aware: a face will already appear red coloured when hoving with the mouse over it without having clicked on it,
but it is not yet selected
(4)
can you please answer to my question described above: why can’t I click in my model (the one shared with you) on face?
h another model, I attach a screen shot. I want to know min and max on the bottom face of the 1/8 sphere. But for the statistics window I can select only volumetric parts. And at top right I miss a switch to select faces instead of solids
Regards
Johannes_ACKVA www.code-aster.de