I have completed 8 simulation runs on 4 meshes of my 0aoa geometry of a VTOL canard of my own design.
Each of the 4 meshes was run using both Wall Function and Full Resolution wall treatments, hence the 8 sim runs.
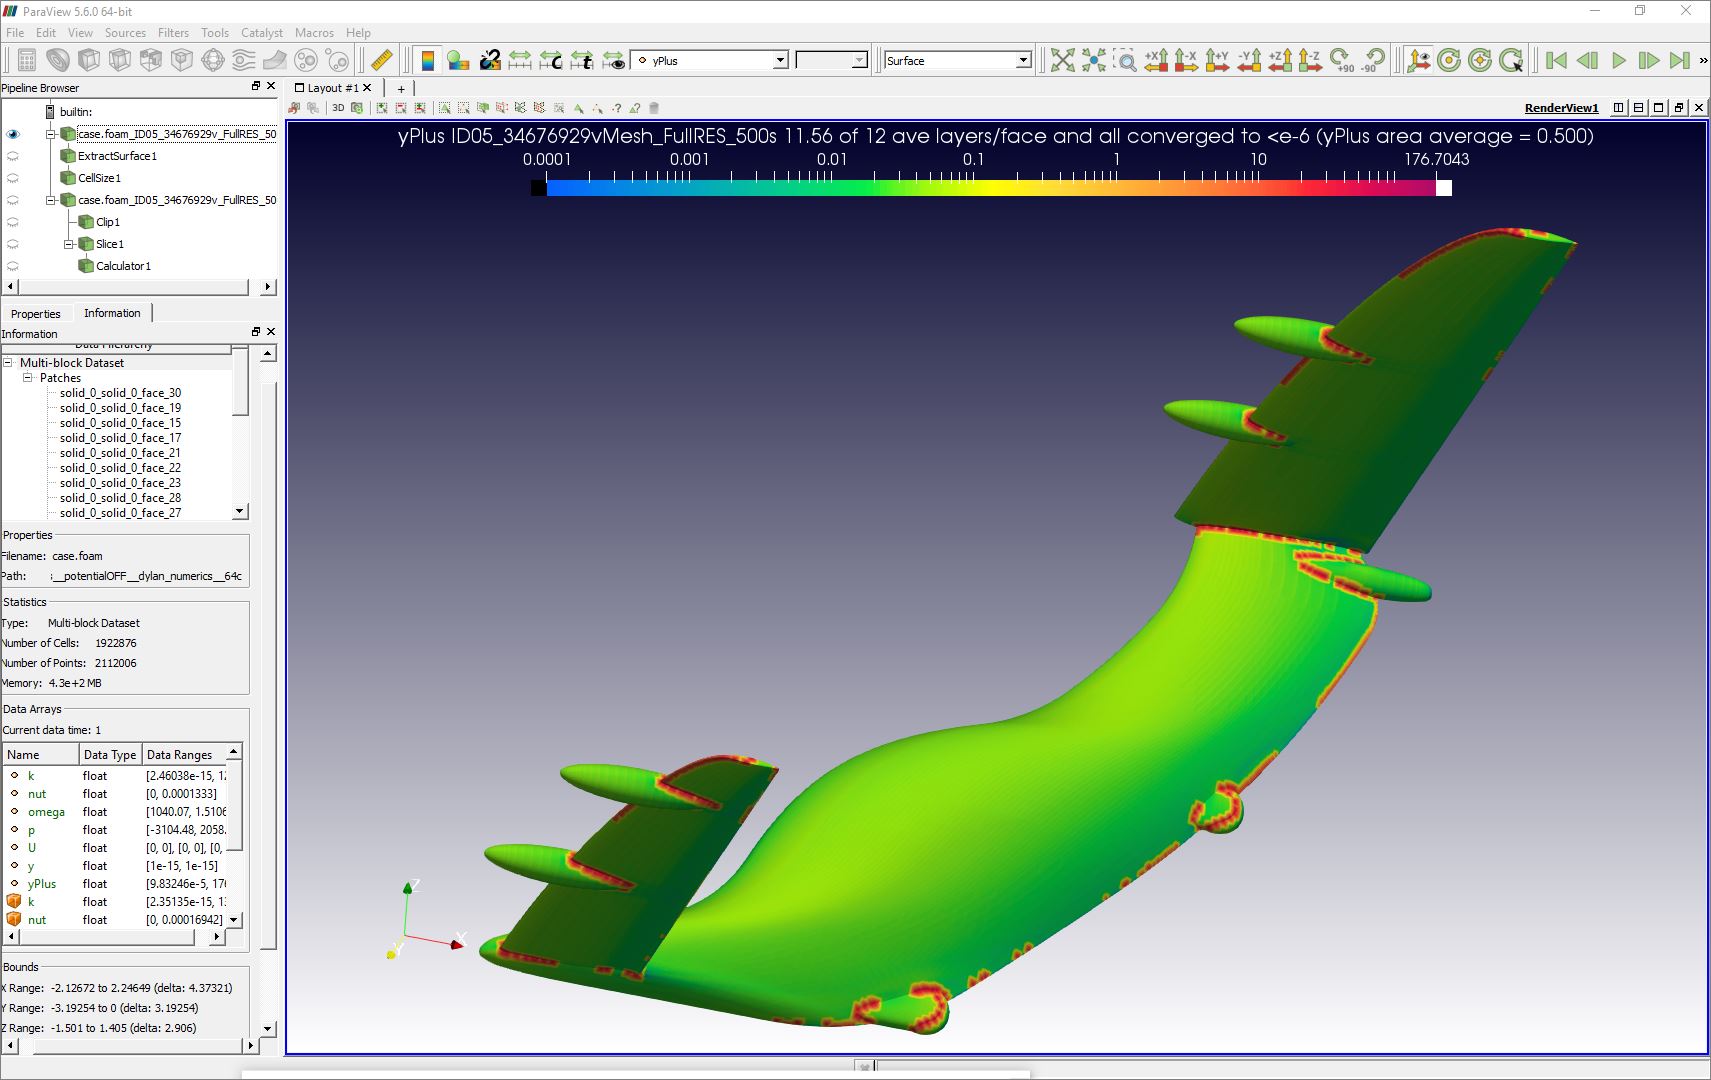
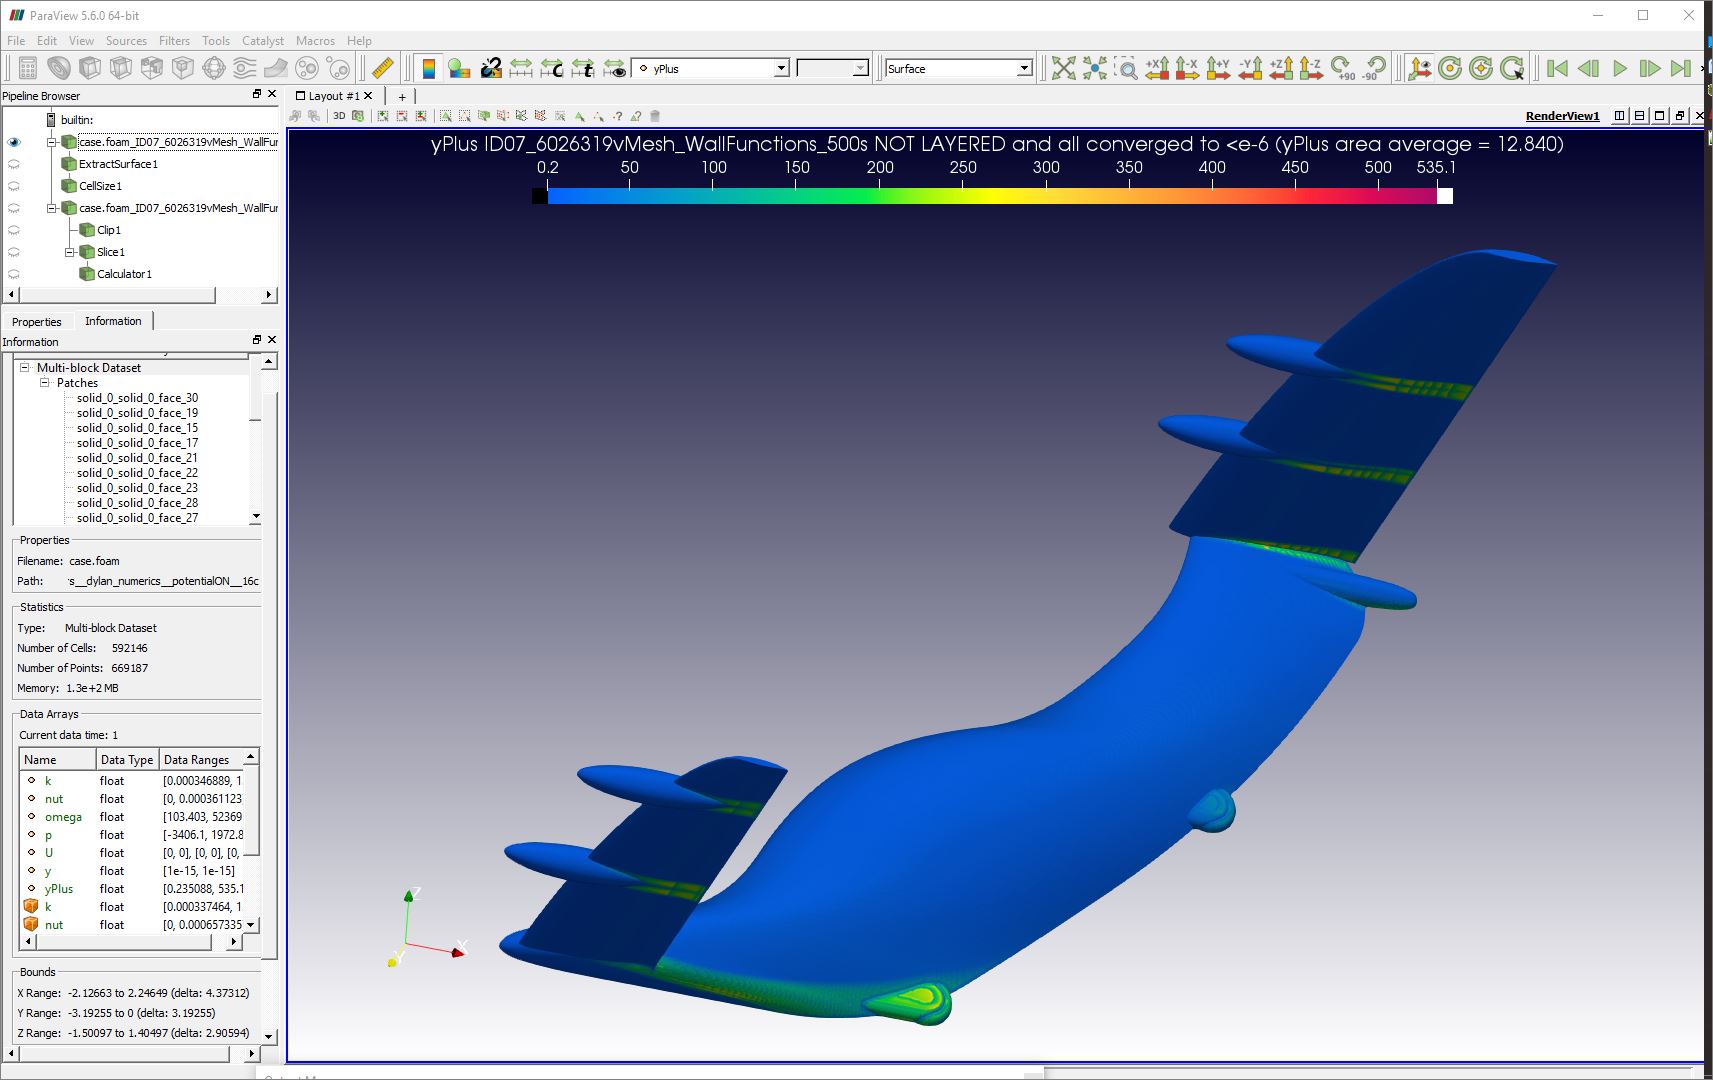
Each of the 4 meshes was setup for different yPlus targets and after the 8 sims were completed, a yPlus surface plot was created for each that tries to highlight the range of yPlus that was actually achieved on the geometry surface.
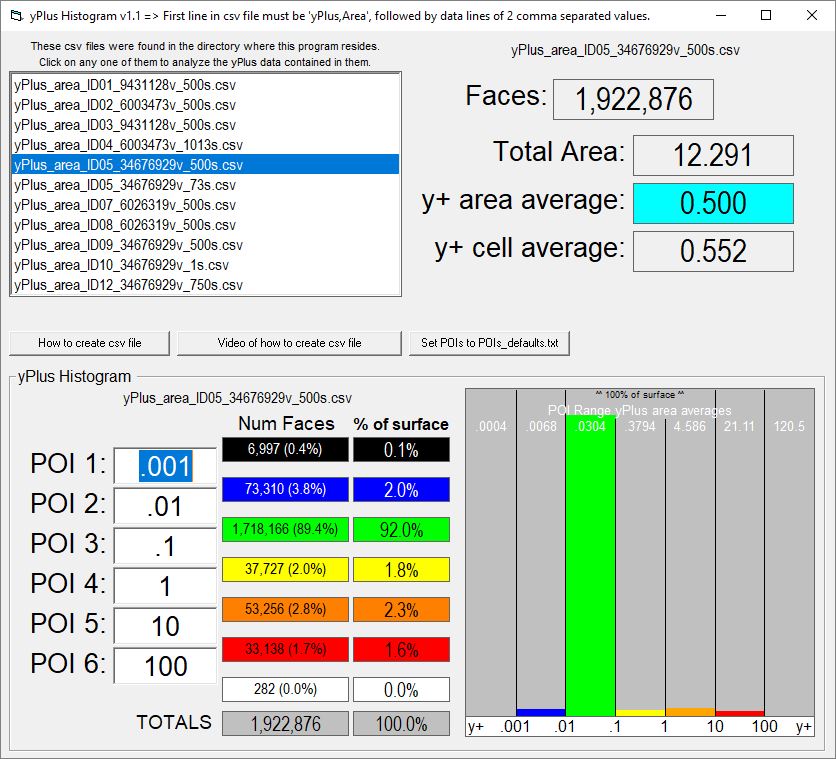
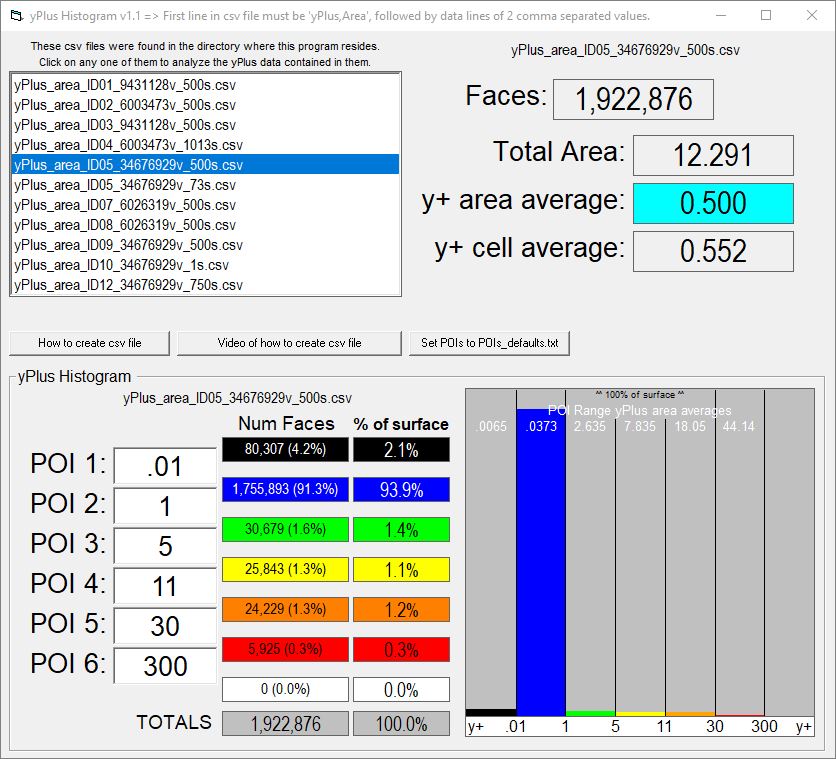
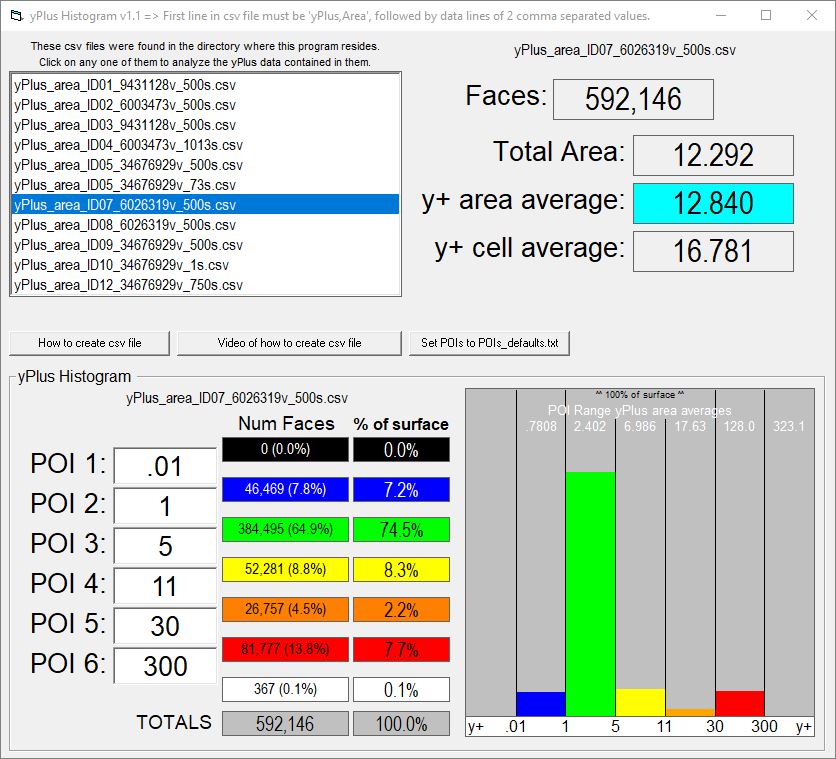
Also, using a combination of ParaViews’ calculation of the area of all geometry surface faces, ParaView csv data export of each cells ‘yPlus,area’ and a quick and dirty Visual Basic analysis of that csv data, I was able to calculate an area weighted average for the yPlus of each mesh.
I then expanded my VB program to draw a y+ histogram bar graphs for each mesh and the histograms for the 4 meshes follow below each y+ surface plot, at the end of this post.
I have charted the aerodynamic results of the 8 sim runs in the below chart:
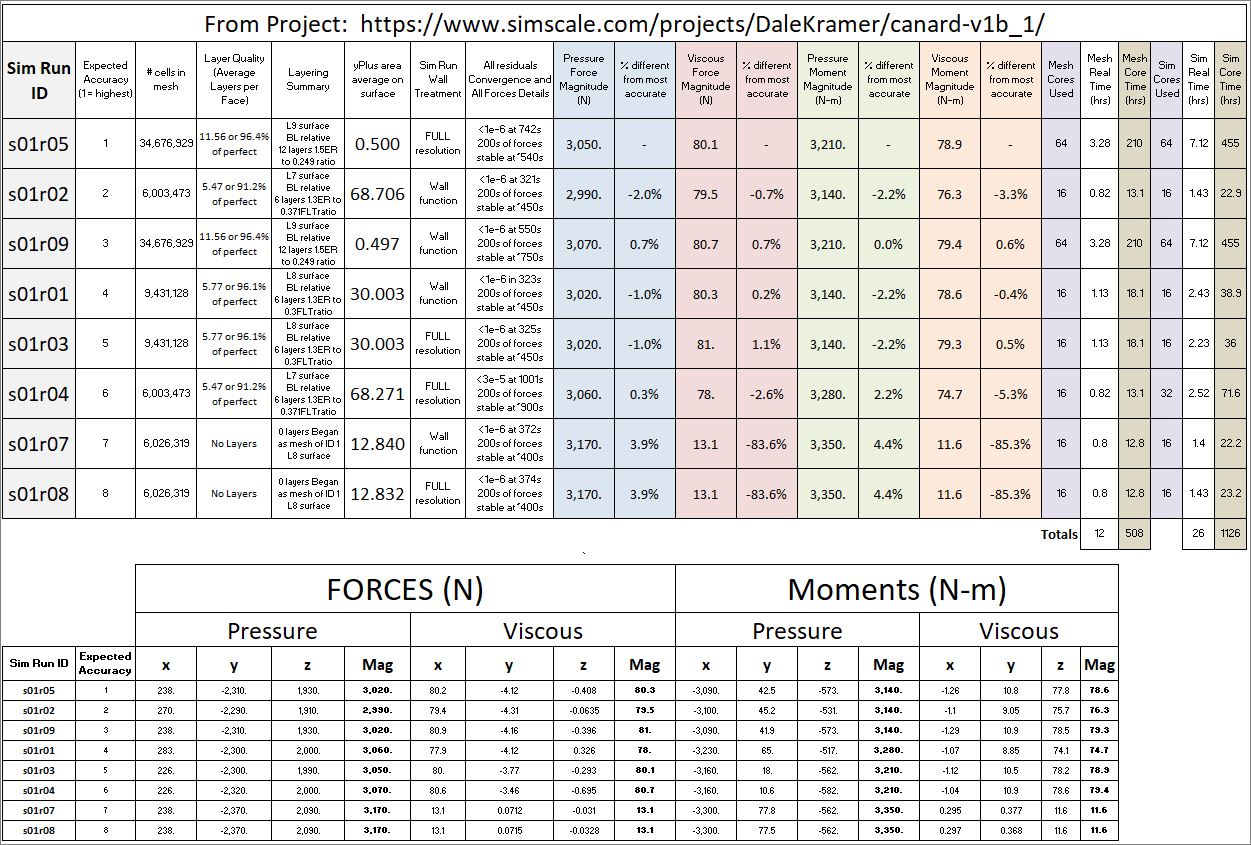
I have assigned an ‘Expected Accuracy’ to each row. This is a subjective number that, when you consider the data in each rows’ left columns with white background with respect to ALL the other rows’ similar data. I have assigned the ‘Expected Accuracy’ using my ‘best guess’ for its value.
I have chosen to use a metric, for row evaluation of the chart, of the magnitudes of the 4 results of ‘Pressure Forces’, ‘Viscous Forces’, ‘Pressure Moments’ and ‘Viscous Moments’.
In the chart I have shown the variance of these 4 results compared to the row with the best ‘Expected Accuracy’.
I think this is a more valid and simpler metric for comparison of row results than simply looking at all 12 of the xyz components of the results (as seen in lower chart).
You still have to look at 4 variances for each row to determine how far the rows’ results from expected values but I do not see how reduce those 4 variances down to fewer or to just 1 variance.
.
.
_CONCLUSIONS _
There is a lot of data there and I think the conclusions that can be made from this chart will be far reaching, at least for my CFD layering choices in the future…
Below are the y+ surface plots for the 4 meshes and a yPlus Histogram for the mesh, follows each mesh. (with average yPlus noted in scale title) :
The 34676929v mesh in s01r05 with auto-ranged LOG scales for yPlus Surface Plot and Histogram:
.
The 34676929v mesh in s01r05 with auto-ranged LINEAR scales for yPlus Surface Plot and Histogram:

.
.
.
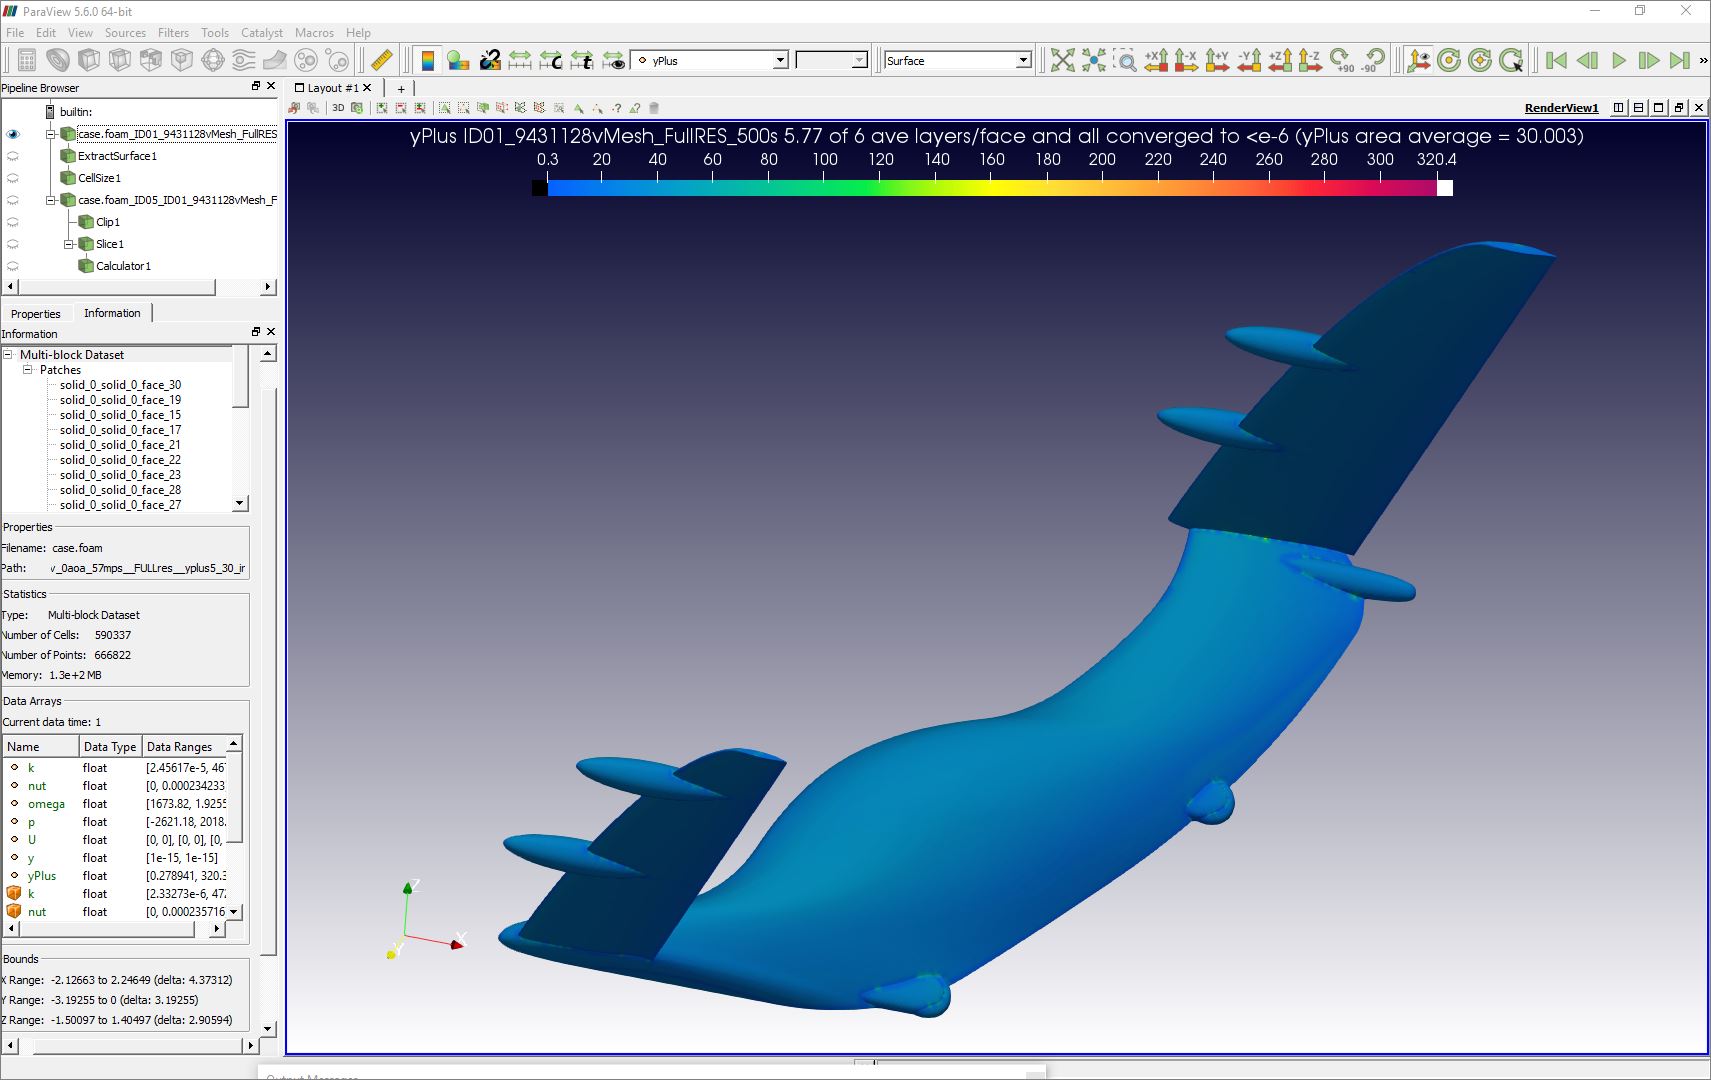
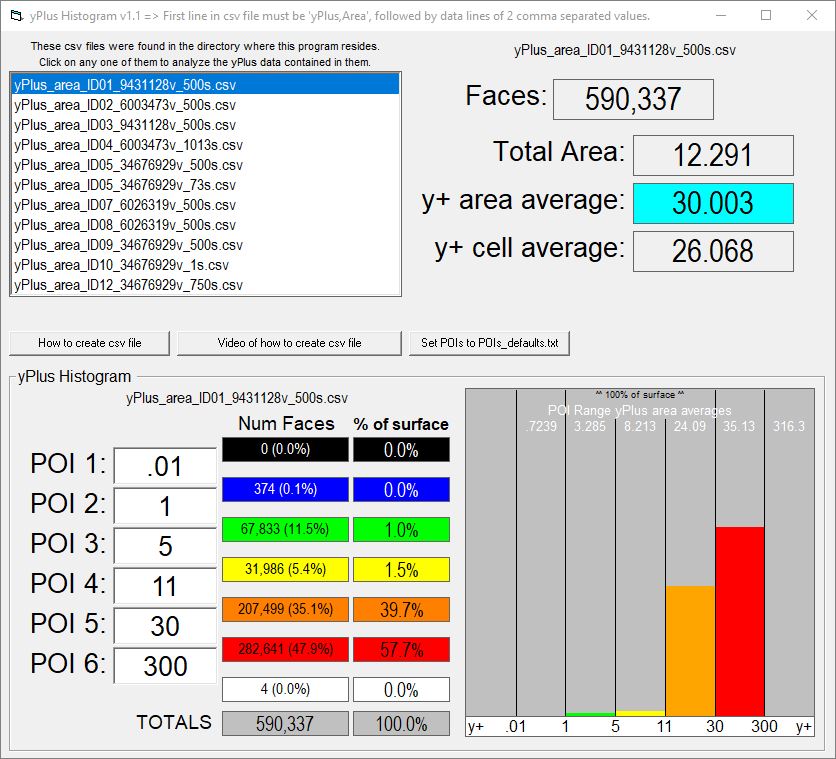
The 9431128v mesh in s01r01 with auto-ranged LINEAR scales for yPlus Surface Plot and Histogram:
.
.
.
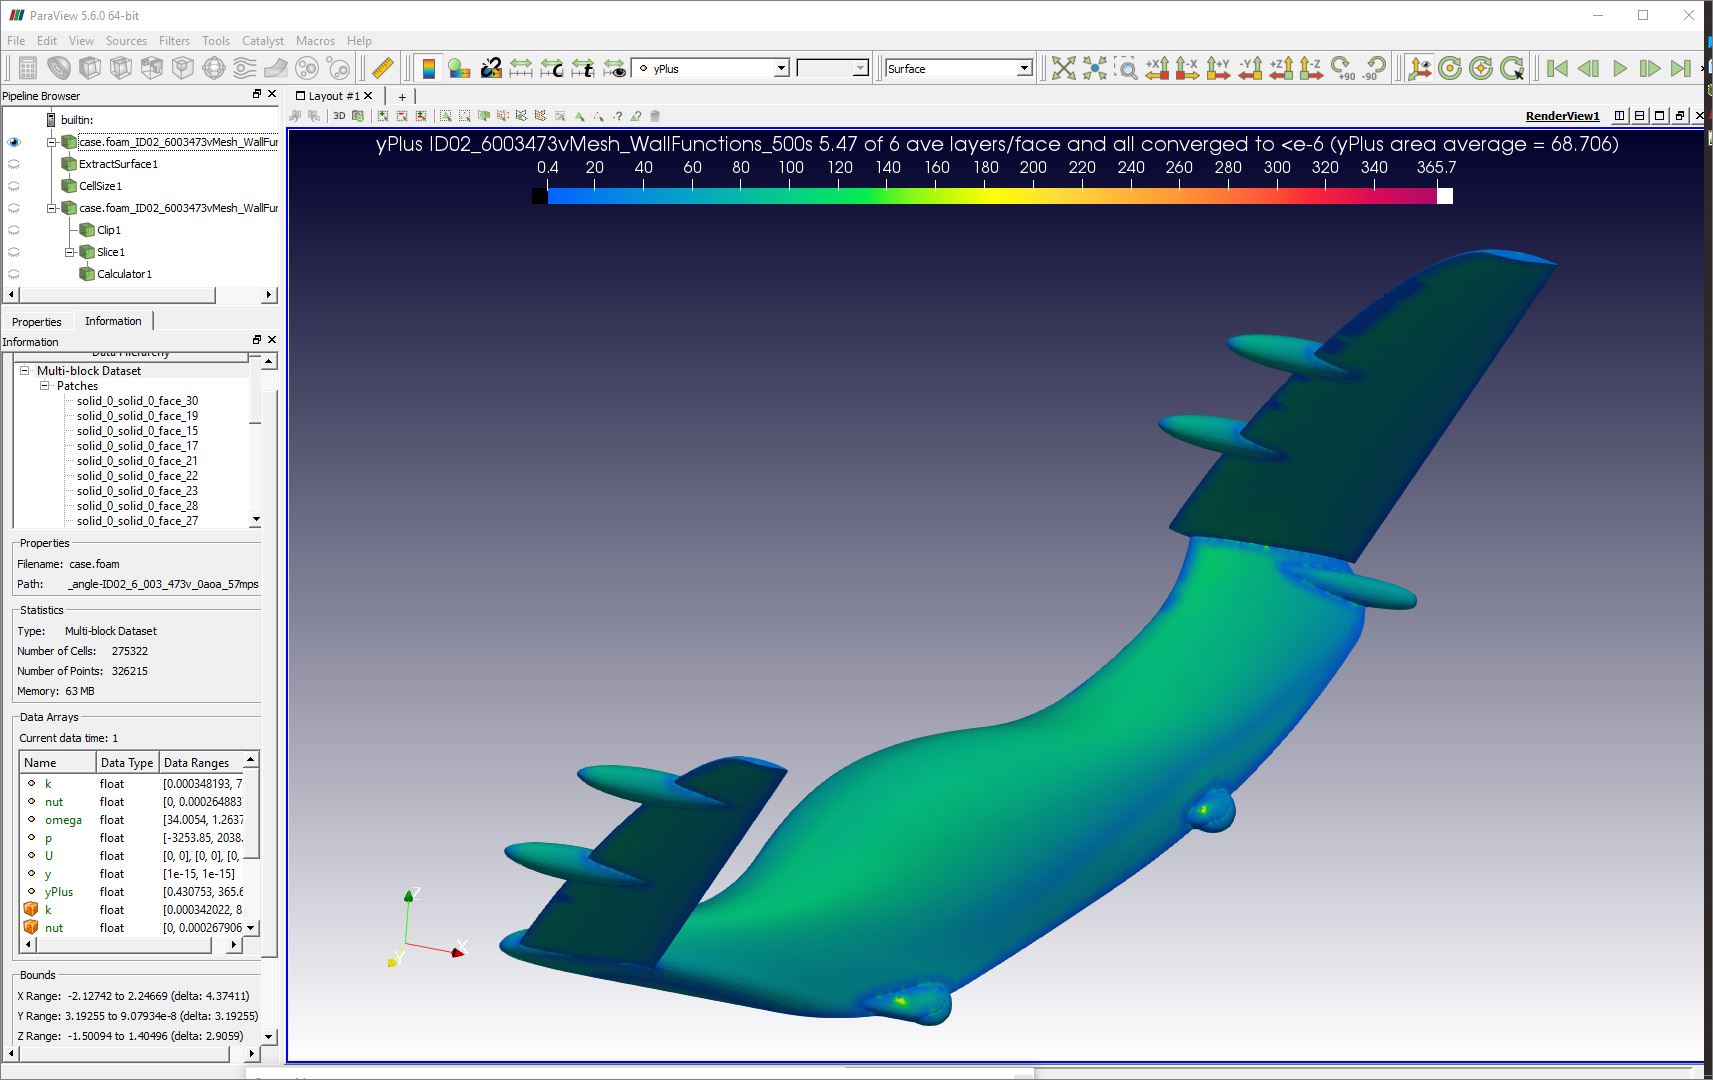
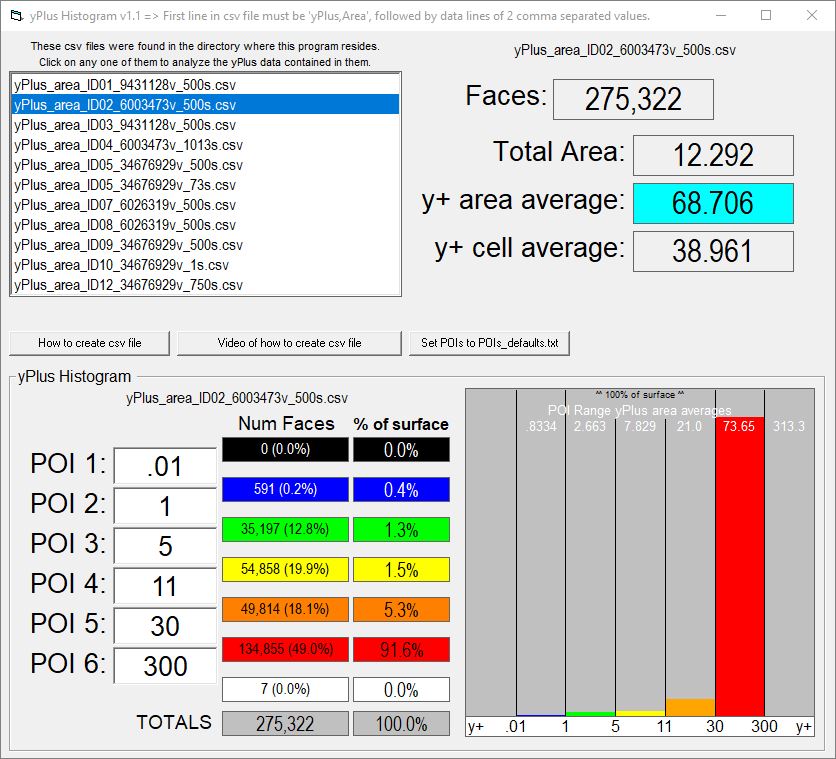
The 6003473v mesh in s01r02 with auto-ranged LINEAR scales for yPlus Surface Plot and Histogram:
.
.
.
The 6026319v mesh in s01r07 with auto-ranged LINEAR scales for yPlus Surface Plot and Histogram:
.
.
.
.
If you are interested in using my yPlusHistogram program, here is a link to its forum topic…