EDIT Nov, 7 2023: Returning to this topic after over 3 years from my last visit, I noticed that this SimScale Forum User Interface no longer allowed links that download external zip files to be followed. All of the zip files shown in this topic can now be downloaded from this yPlusHistogram Google Drive Directory
I did this work a couple months ago and I have decided to do a forum post to make this new metric more available for people that are searching for a better way to evaluate their yPlus mappings.
Here is a project of mine that explains why my new yPlusHistogram program exists : 'yPlus - Metrics to evaluate yPlus achieved in CFD Boundary Layer Analysis' simulation project by DaleKramer
To use ANY yPlusHistogram version, you must run the SETUP.exe program inside yPlusHistogram_SETUP.zip. (extract all files in zip to a temporary folder, then run the setup.exe file in that folder)
yPlusHistogram_SETUP.zip is found at my Google Drive link above.
.
Please see the README.txt file (inside the yPlusHistogram_SETUP.zip file) for further instructions if needed . I promise, no bad things in my .exe files ![]()
Once you have run the SETUP.exe, you must then download the latest version of the program:
Here is the latest version of the program as of Jan 16, 2024:
yPlusHistogramv205d.zip (find it at my Google Drive link above)
This version fixes issues caused by ParaView having switched the export order of the yPlus and Area spreadsheet columns. yPlusHistogram can now import the csv file no matter which parameter is first in each csv line. It also fixes some issues caused when the directory that the program file resides in has non-SimScale or ParaView .csv files in it.
To run this zipped .exe file, with it placed in any directory on your computer, you must have already run the above setup file (SETUP.exe).
Extract the latest versions’ .exe file from its .zip file and then place the .exe file in any location on your computer where you have downloaded any of your Paraview csv files AND also in your downloads directory to use the ORSI feature.
.
Here is a video that shows how to use it:
.
.
.
NOTE-THIS IS NOT SHOWN IN THE VIDEO; As of Jan-2020, for some unknown reason, before you export the csv file from ParaView, you may have to drag the yPlus data column to the left of the Area column so that the yPlus data precedes the Area data in each line of the csv file…
.
EDIT Nov, 5 2023: When downloading the yPlus Area data from the Paraview you should select the last iteration in Paraview as shown here:
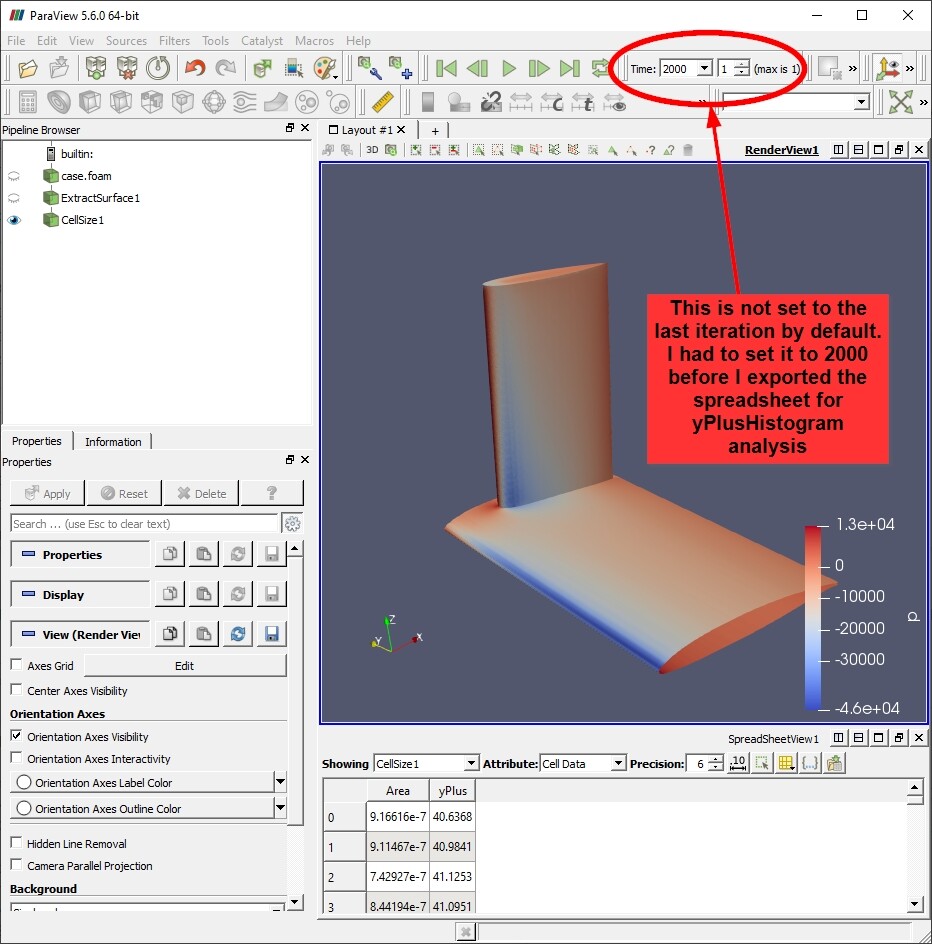
.
Here is a video of using the yPlusHistogram program to analyze the quality of the layering in your meshing log:
Have fun ![]()
Dale
 Glad to see you back