Hello, my fsae team asked me to simulate some ideas for a future nose cone. I’ve simulated about 10 models so far, and pretty much all of them (besides some points out of the curve) fell on the -0.3 Cl range. However, one of the models got a Cl of -0.515 and a Cd of 0.302, which is giving me a Cl/Cd of 1,705, which is way higher than all of the other models. Here is the link for the project I’m talking:
Here are some of the other models I tried:
What could explain the large difference in lift? Thanks in advance.
Hello sounds interesting,
but this is a lot of projects, can you please just give us a link to your best solution and one reference simulation.
An idea I have: did you check the ground clearance in the simulation? A few mm can make a huge difference in CL.
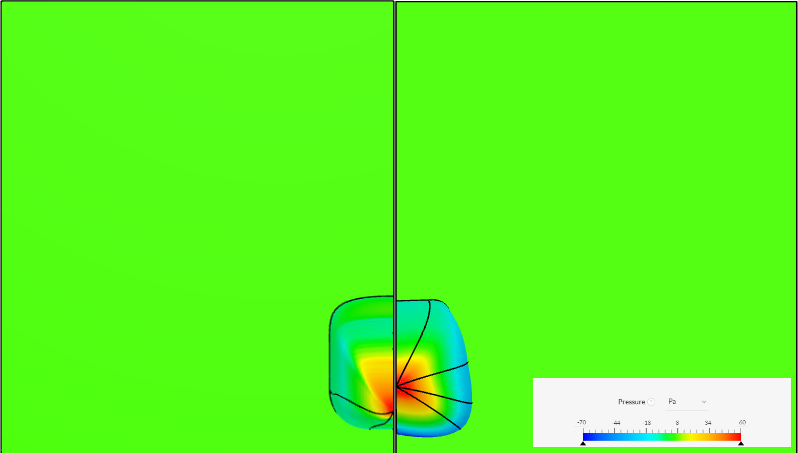
I think this explains the differences pretty well. You can see that even with a smaller frontal area the more blunt-body does create more resistance and therefore a bigger area of high pressure, while the pressure of the backside is nearly the same.
Also you can see that the high-pressure region for nosecone #4 is more at the top of the nose cone and therefore creating the high CL. in comparison to the more symmetric body.
I hope that gives you the insights you need. Also, I would suggest you to always use 1m² (0.5 for half-car) as a reference area so that only the aerodynamic changes are represented in the force coefficients.