I have in a simulation a view of y+ (in Solution Fields). e.g. in this project: SimScale Login
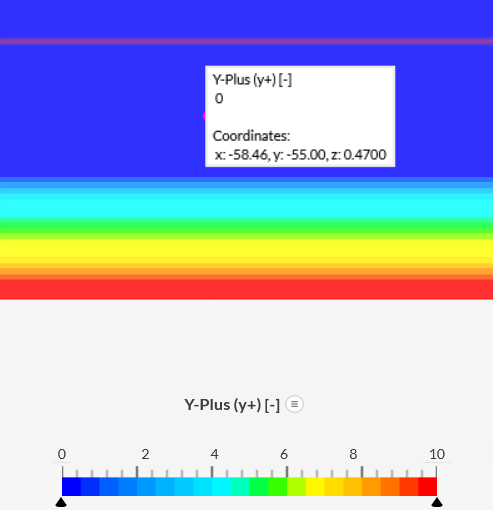
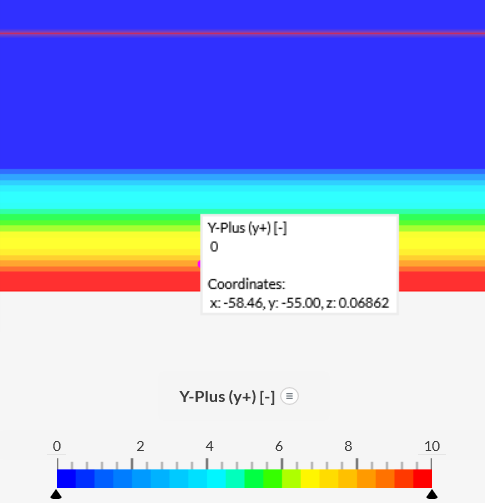
The colouring I don’t understand. It looks y+ is always zero (using Inspect Point), but the colouring is changing. See these two grabs:
Can someone help me with this? How do I read the y+. Is the generation of graphics perhaps doing some interpolation and that gives these strange coloring?
Open Project → Simulations → Basis-CFD-P(10),mesh=newmeer,askop=13,roede=24
Simulation runs → Run1 → Solution Fields → Y-Plus(Y+) → camera View: Y-Plus
So the coloring does not really match when looking at the ‘Inspect point’ values.
What is happening? I seem to have problem with my simulation and people direct me to checking the y+ value, but I am (I think) not really able to determine the values of y+, or is Inspect Point the only way to check and not the graphing?
And additionally. ‘Inspect Point’ can not be used in the ‘free/community’ account. So in most cases I can only use the coloring (accept when the simulation is still running).
Any help? When using Solution Fields → Cutting Plane → Y-Plus (y+) looks not to render the coloring correct.
I think (but hopefully someone can agree with that) that Iso Surface/Volume renders the surface/volume boundaries correct? (One though can’t change the Iso value range in Iso Volume when in Community account…).
I really hope someone can help me with understanding this behavoir. Thanks!
y+, although unitless, is a field that gives you an indication of distance of the cell to the wall. The main use for it is to understand the y+ value of the first cell off the wall, so typically users only observe y+ via “Parts color”.
Inspecting y+ via cutting plane and other filters usually does not make sense.
Side comment: inspect point is available for community accounts, however you have extrapolated your 10 simulations quota, so your results do not contain quantitative information, thus inspect point is disabled.
I expected that only the first layer was important (and I assume the importants is at mid height of that layer; as that is where calculation happens). So reading Ihttps://www.simscale.com/docs/tutorials/post-processing-solid-mechanics-simulations/; I see that I need to set ‘Rendering mode’ at ‘Surfaces’.