Tutorial: Post-processing Thermal Comfort Parameters for HVAC Simulations
This tutorial details how to post-process the HVAC simulation results for calculation of the ‘Effective Draft Temperature (EDT)’ and the ‘Air diffusion performance index (ADPI)’ in Paraview using a sample case of Air-Conditioning of a Hall building.
Description of Parameters:
Effective Draft Temperature (EDT)
The Effective Draft Temperature provides a quantifiable indication of comfort at a discrete point in a space by combining the physiological effects of air temperature and air motion on a human body.
A point is considered comfortable if the results of Equation below are between –3°F and +2°F, and the measured velocity at the point is less than 70 fpm (0.36 m/s).
EDT = (Tx – Tc) – 0.07(Vx – 30)
where
EDT = Effective Draft Temperature, °F
Tx = local airstream dry-bulb temperature, °F
Tc = average room dry temperature, (control) °F
Vx = local airstream centerline velocity, fpm
If the inputs are in SI units (Temp in Kelvin, Velocity in m/s), the formulation becomes:
EDT =[1.8(T - Tc) -0.07( 196.85*Vx - 30)]
.
Air diffusion performance index (ADPI)
ADPI is a single number that quantifies the overall comfort of a space when in cooling.
_ADPI is the percentage of points in a space* where the EDT is between –3°F and +2°F _
A high percentage of people have been found to be comfortable in cooling applications for office-type occupations where these conditions are met. High ADPI values generally correlate to high space thermal comfort levels with the maximum obtainable value of 1 or 100%.
-
ADPI is defined in a zone between 0.1 m and ~2 m from the floor and 0.3 m from interior walls (ASHRAE Standard 55, 2010).
ADPI (ratio or %) = Number of test points or cells that meet EDT criteria (–3°F and +2°F) / Total number of test points or cells
.
Step-by-Step:
You can import this sample project by right-clicking and opening in new tab:
Import Project Link: SimScale Login
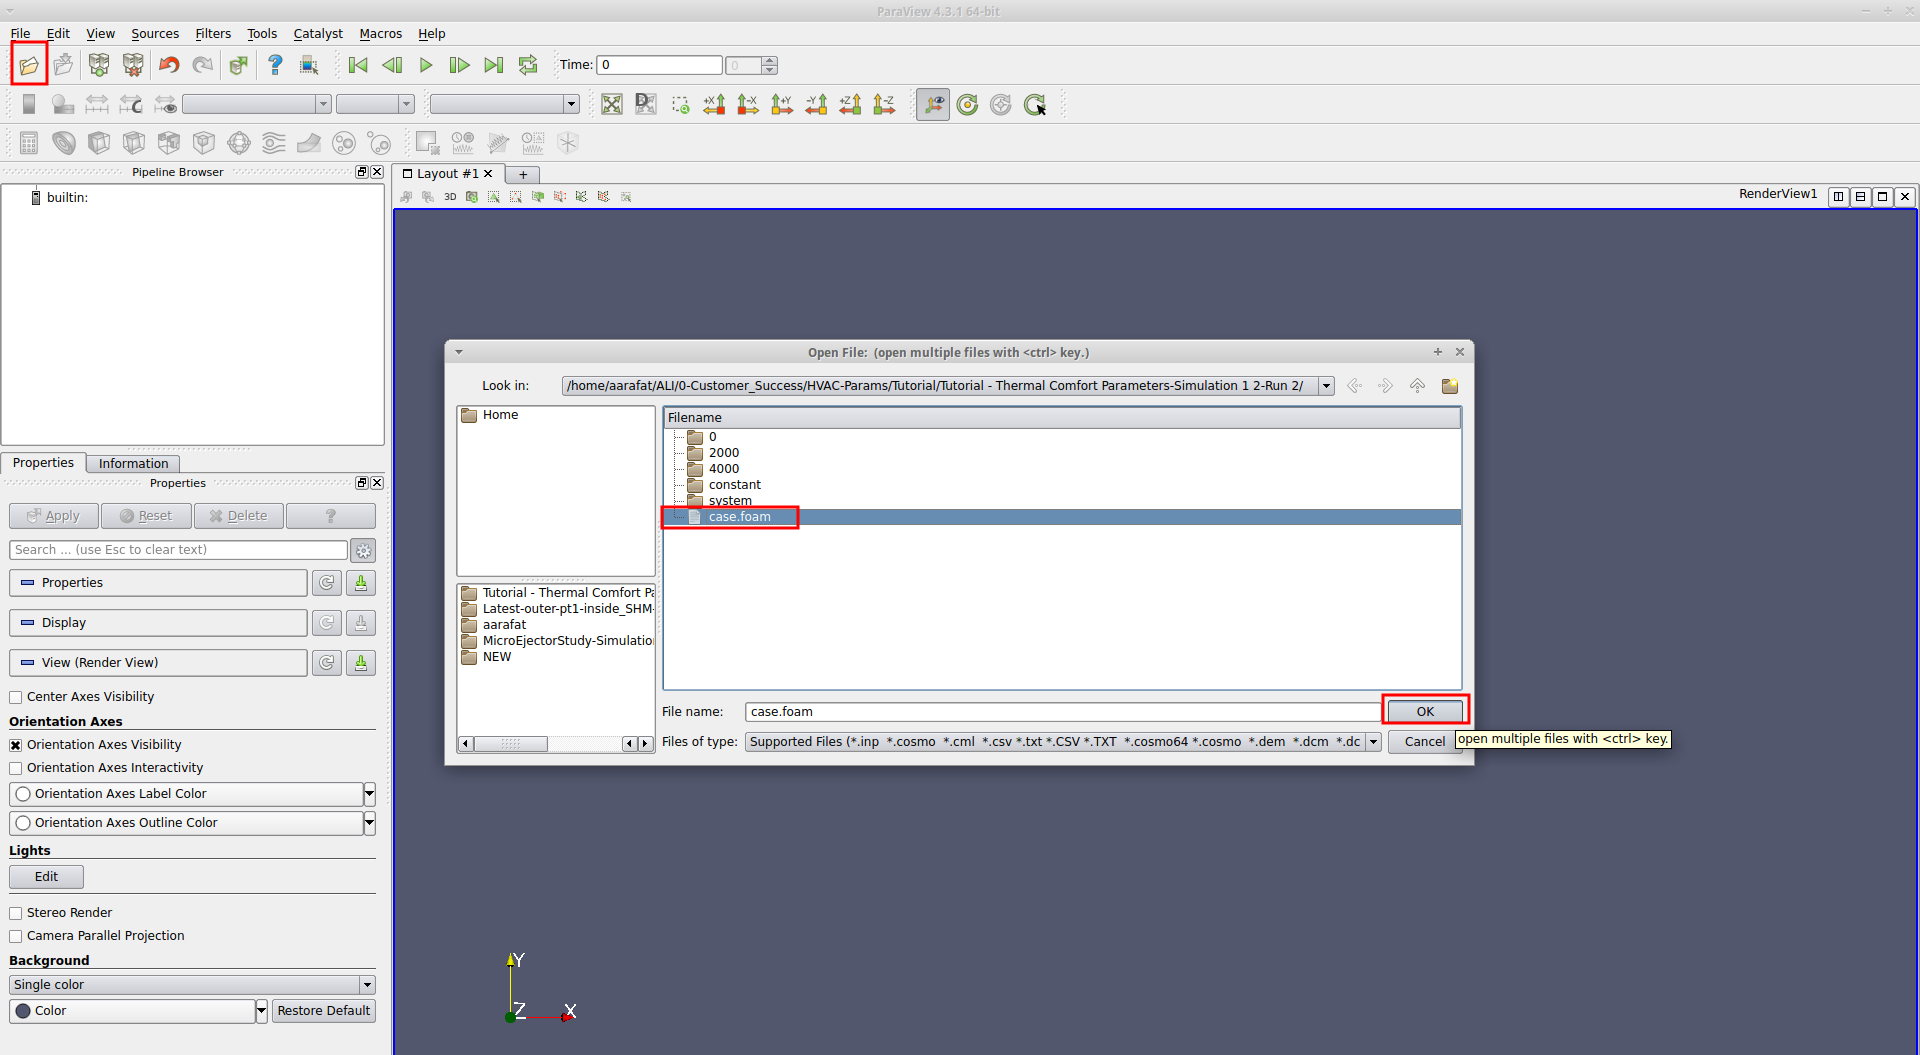
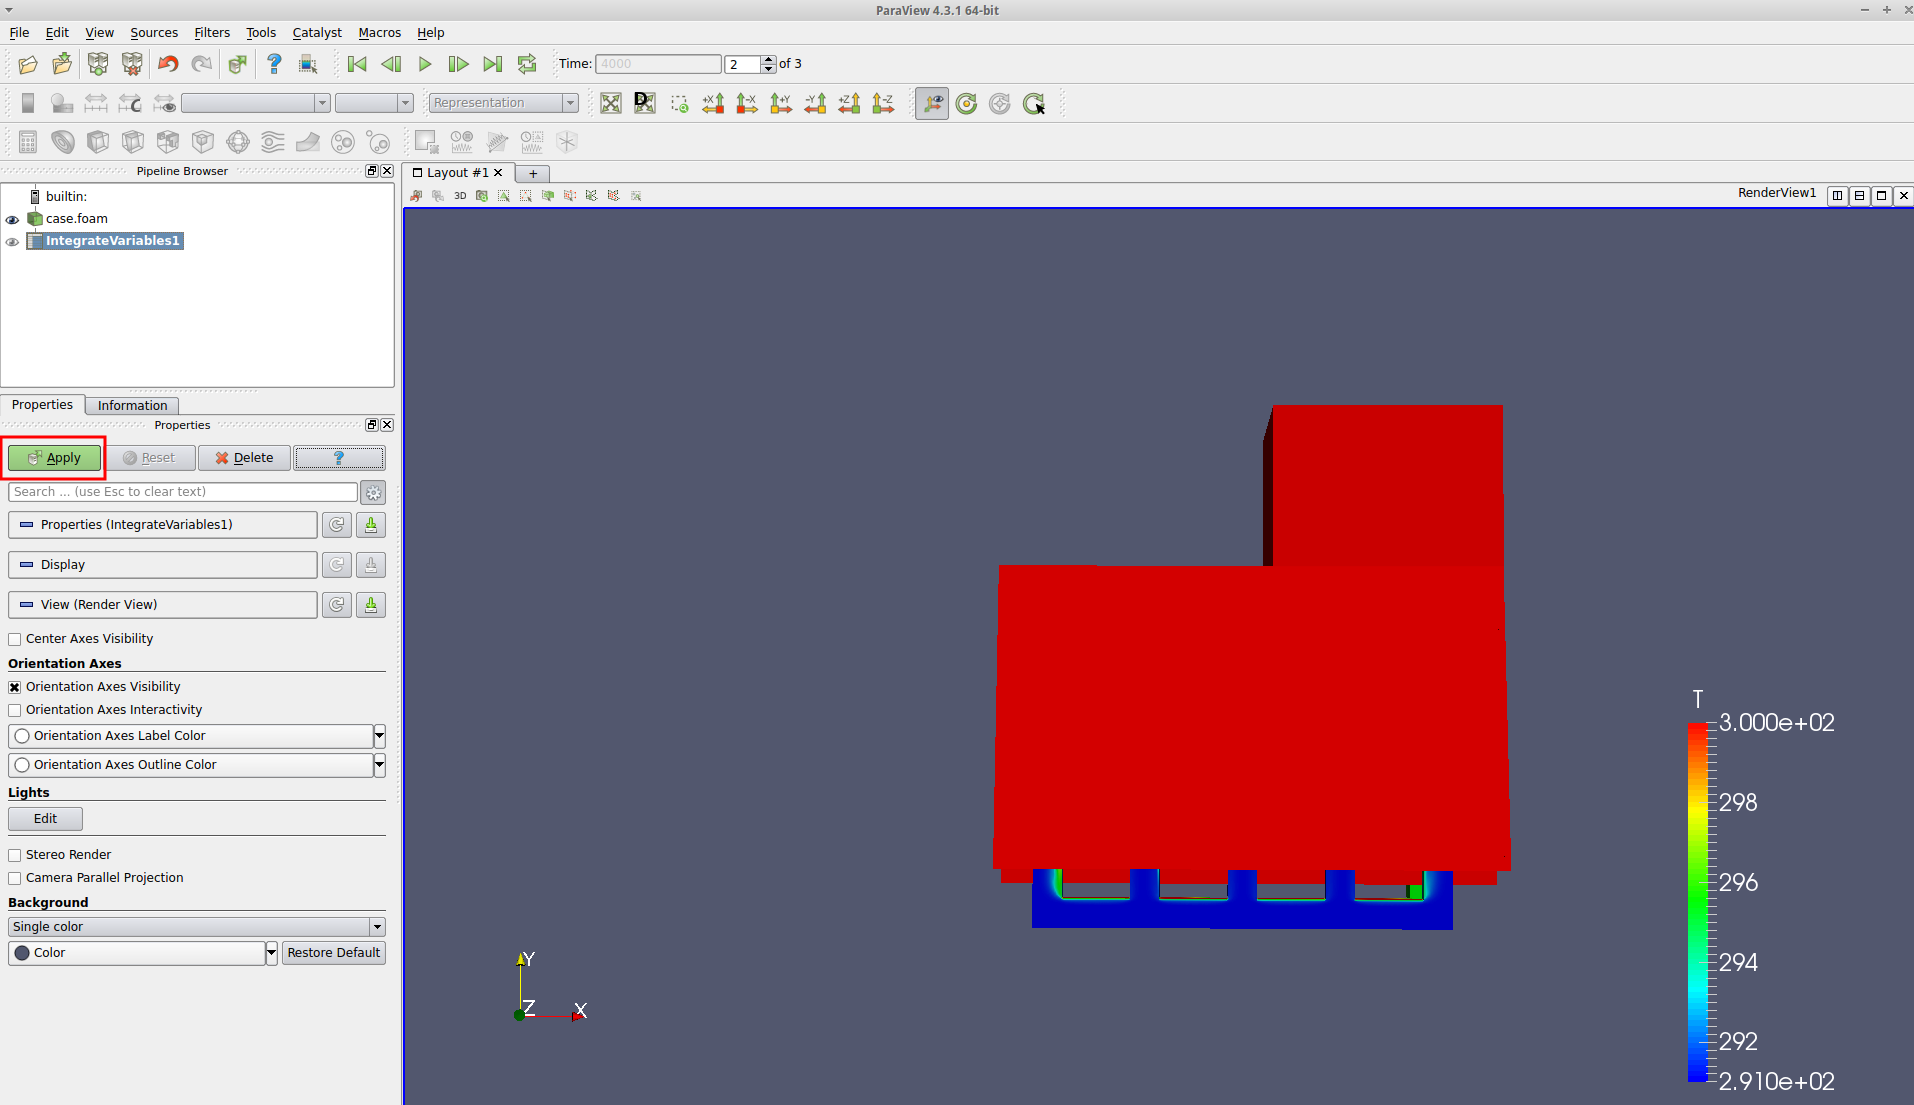
- Start the ParaView software and click on the ‘Open file’ icon as shown.
- Select the ‘case.foam’ and click OK.
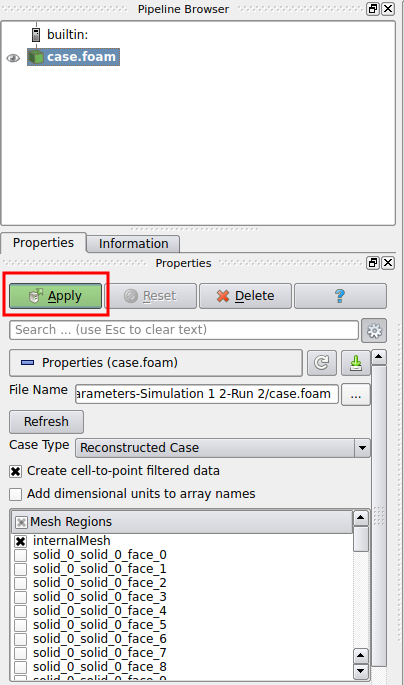
- Now in the left panel, click on the green ‘Apply’ button under properties section.
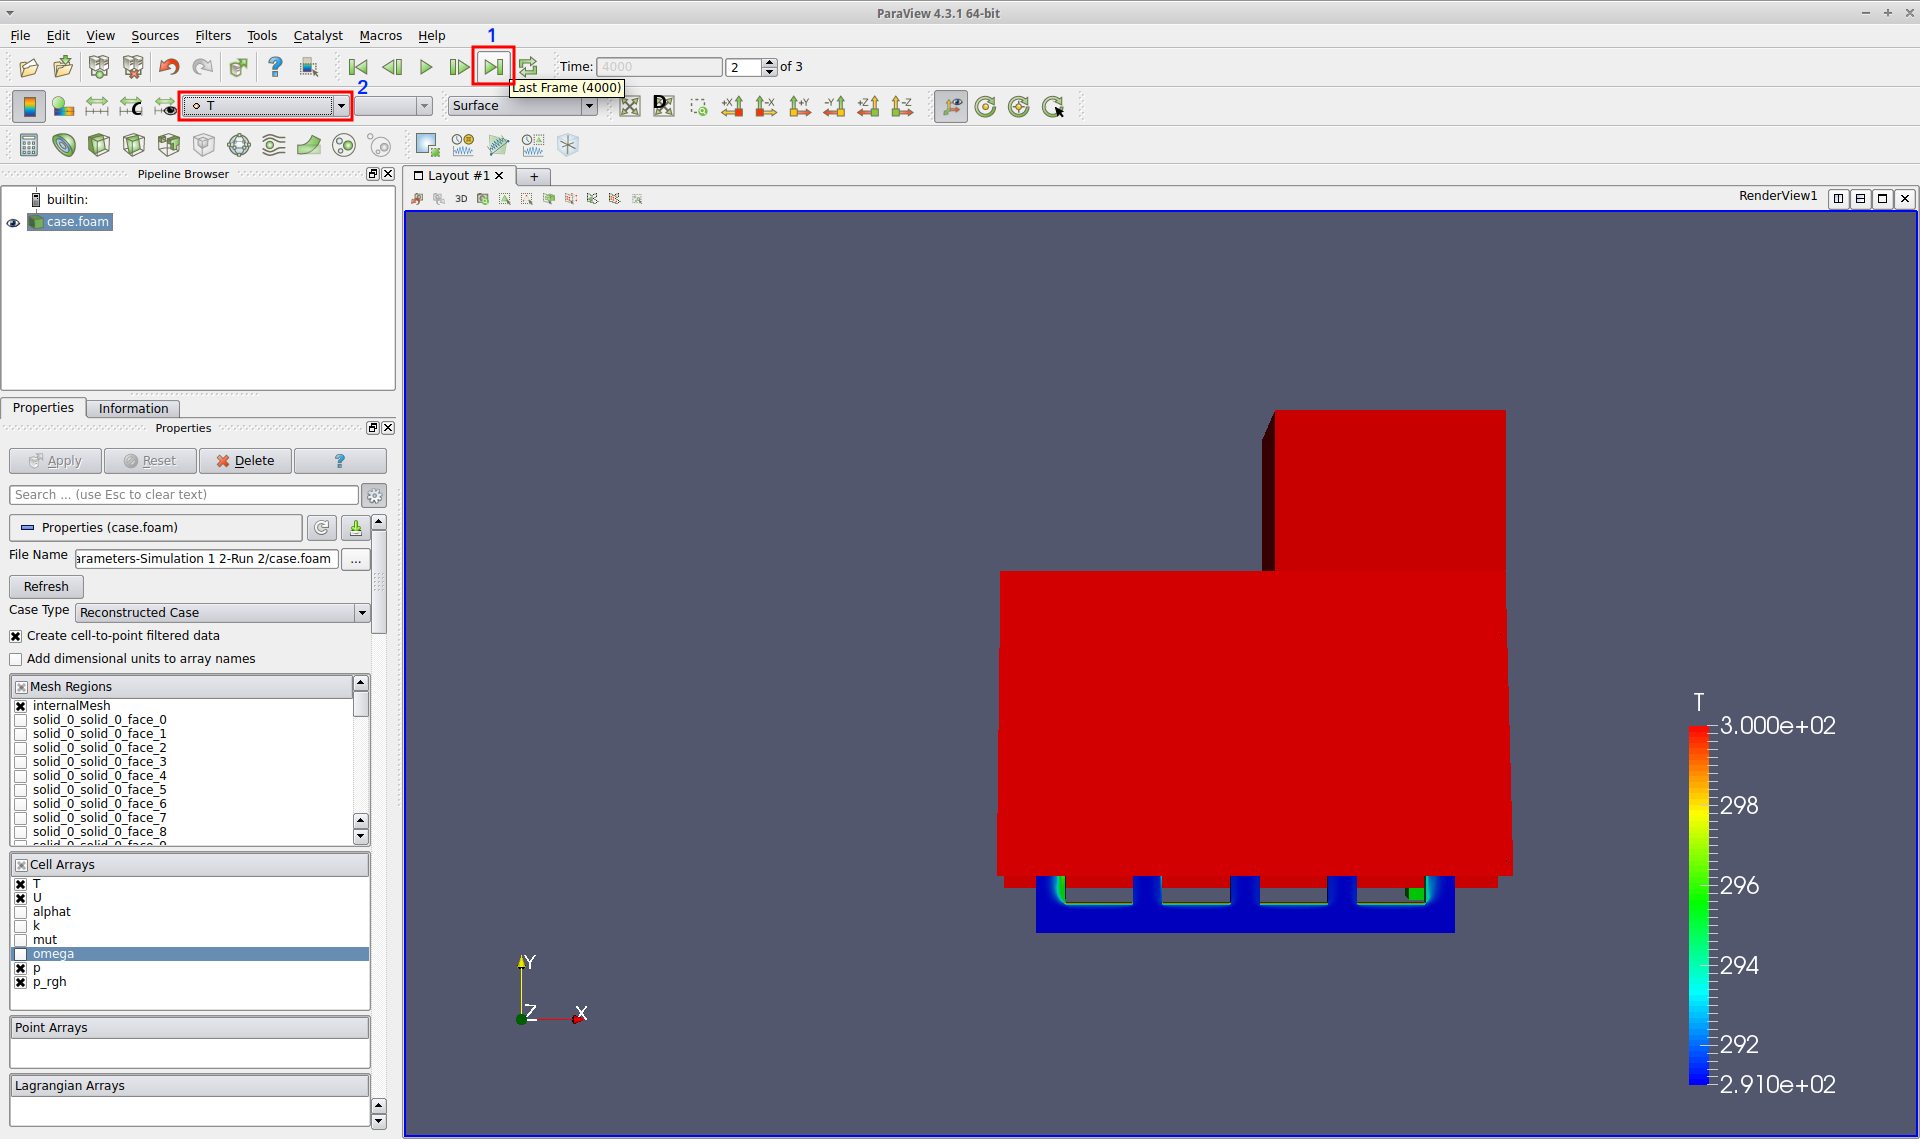
- Then to goto the last saved solution, click on the ‘Last Frame’ icon from the top tool bar (see #1 in figure)
- and change the field variable to temperature ‘T’ from the drop down list (see #2 in figure).
-
Now, we will first calculate ‘Tc: average room dry temperature’. For this we have to integrate the temperature over the domain and divide it by the room volume. In ParaView we will use ‘Filters’ to do this.
-
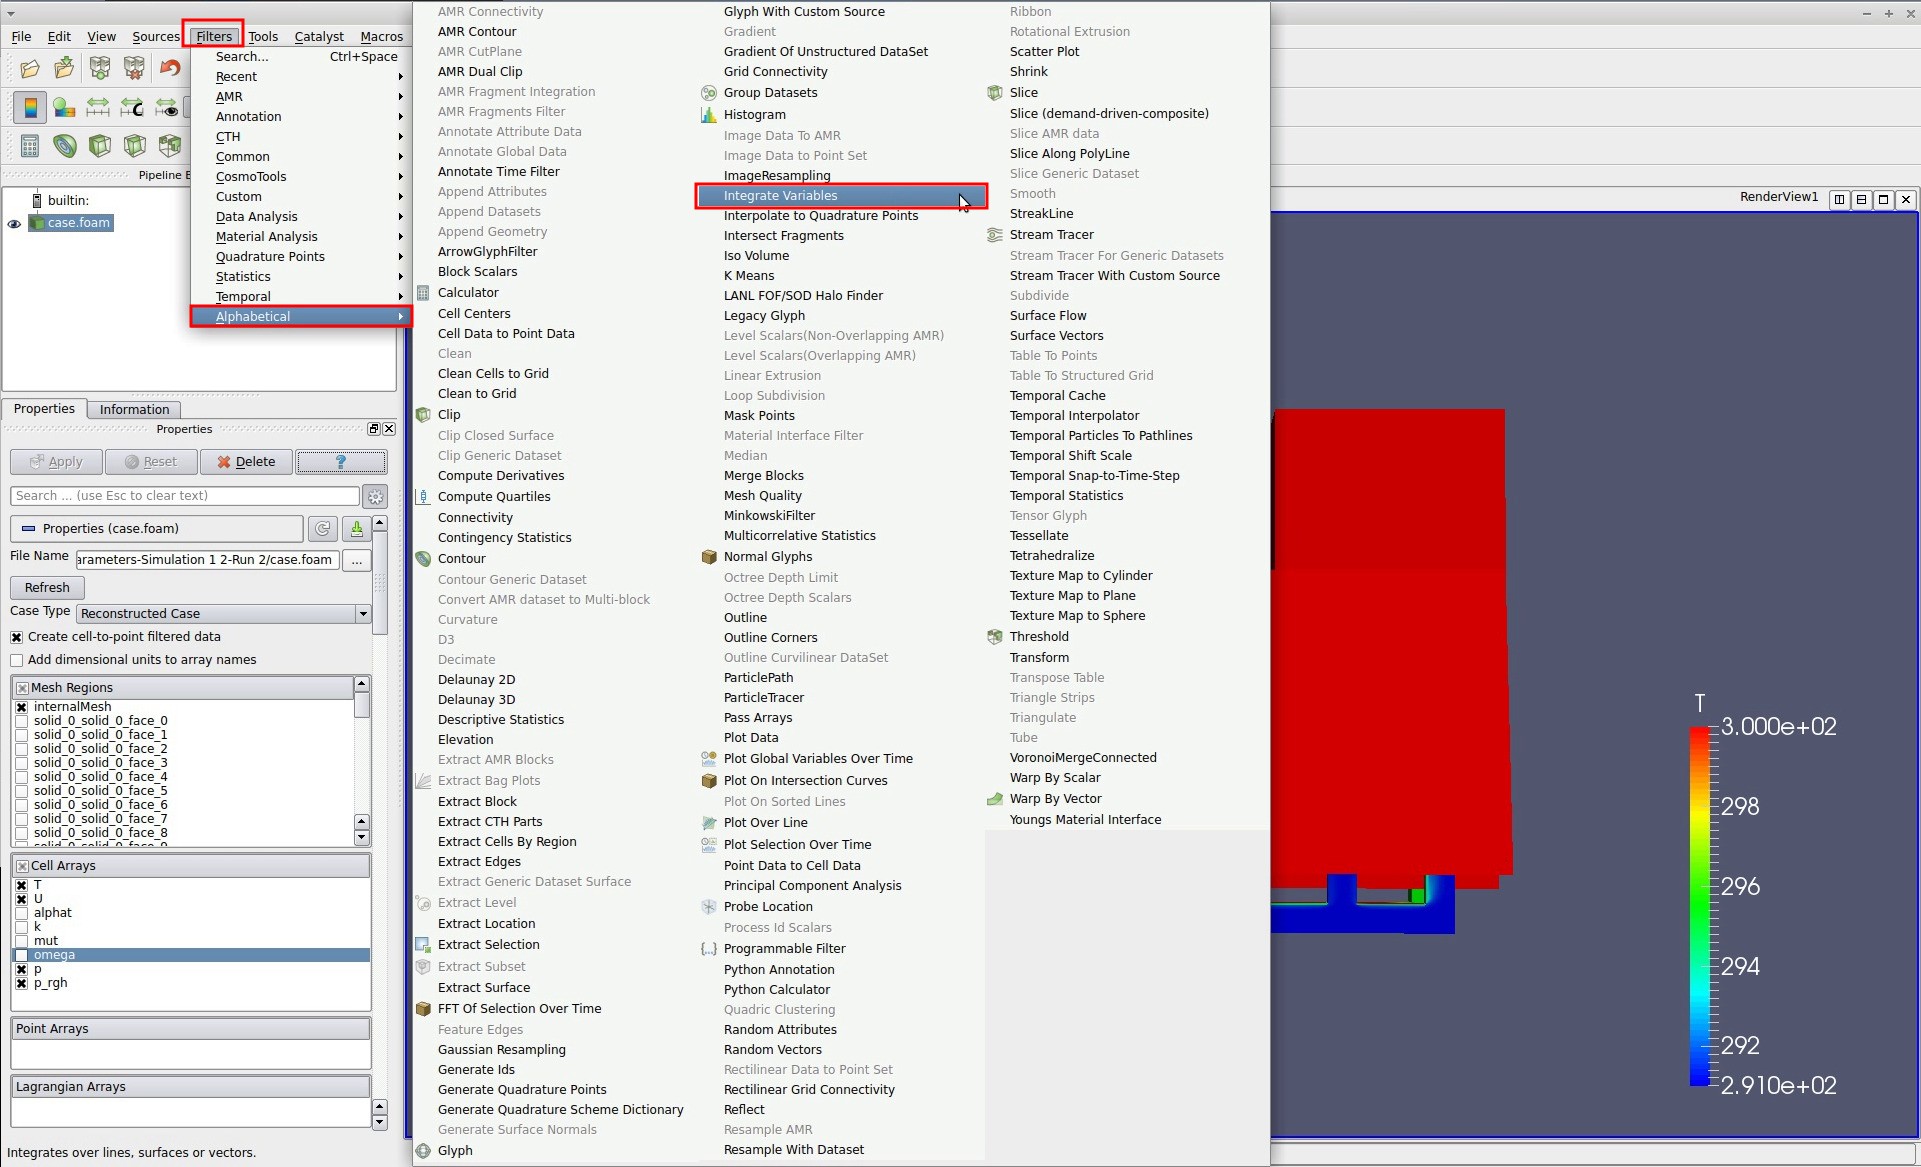
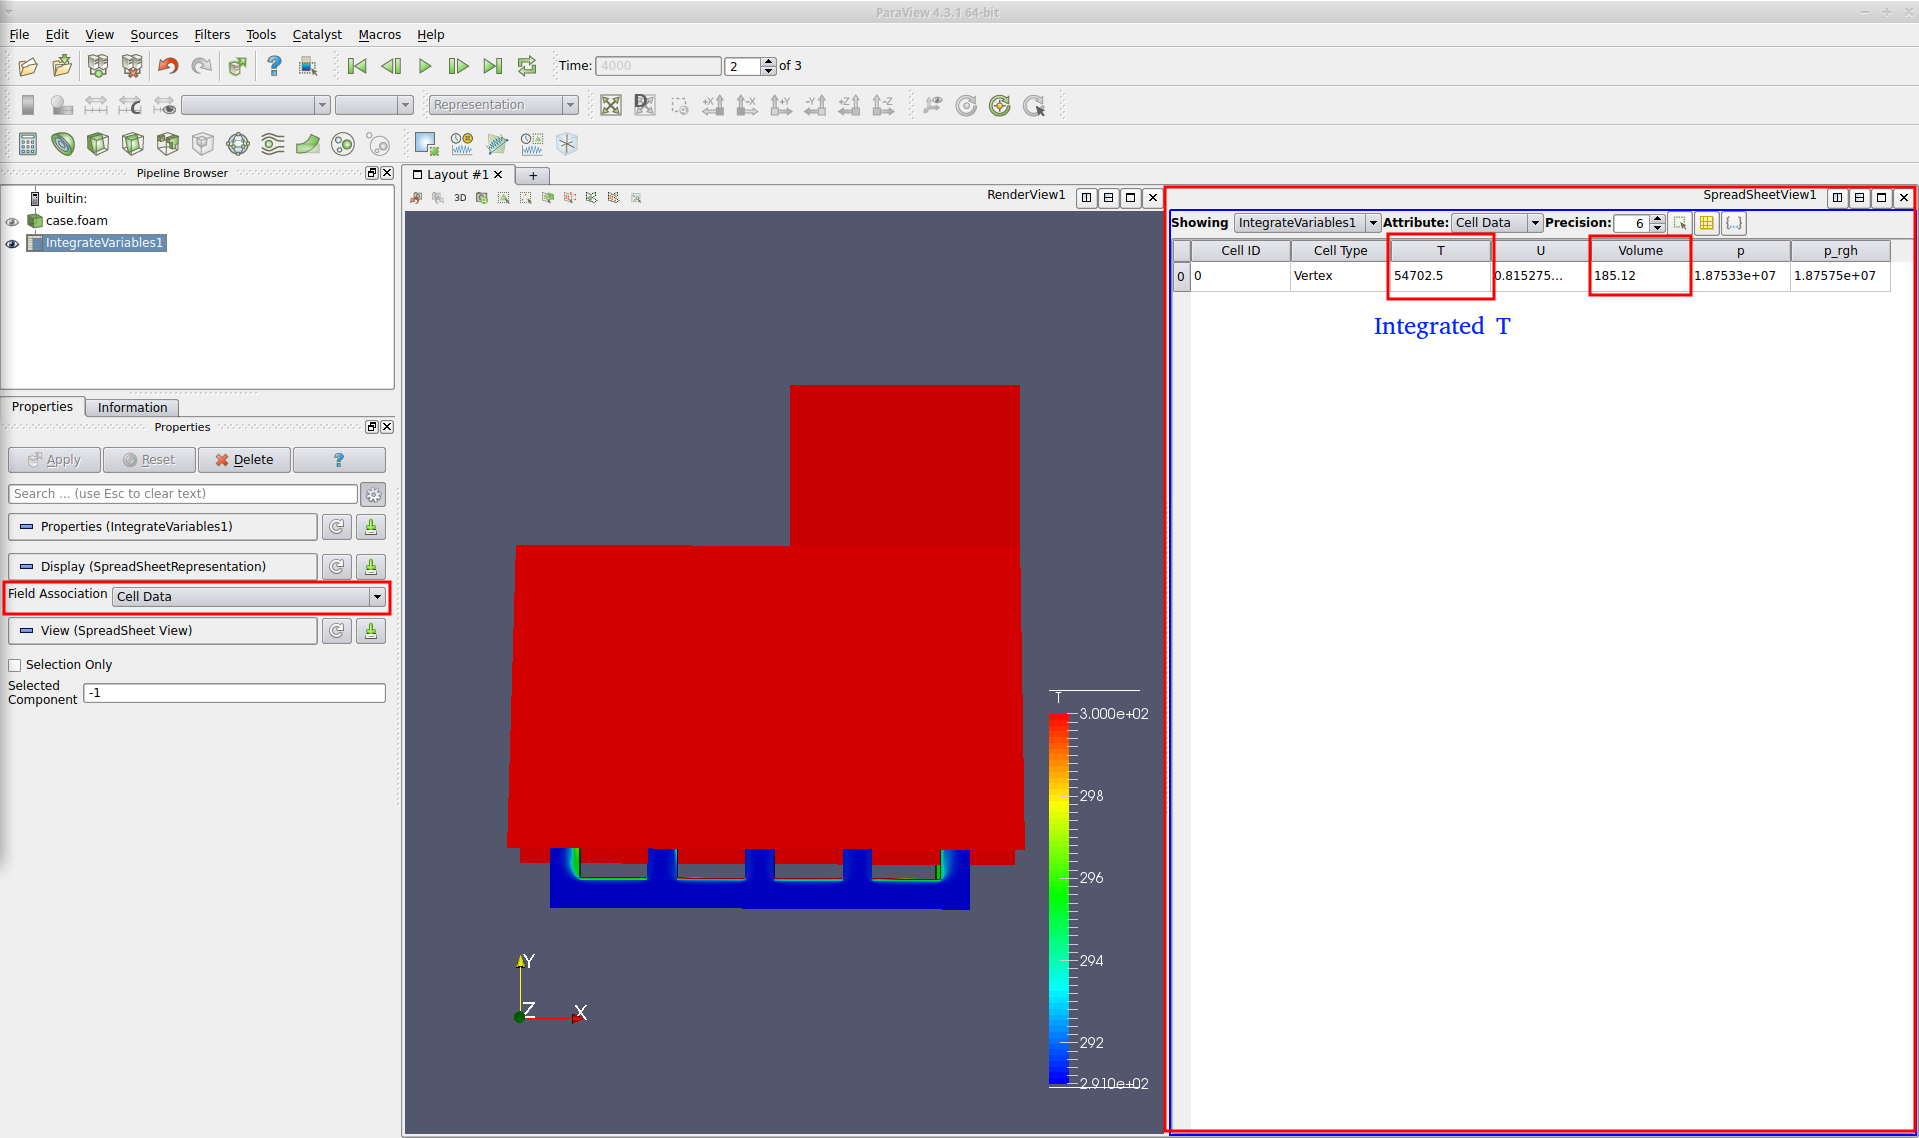
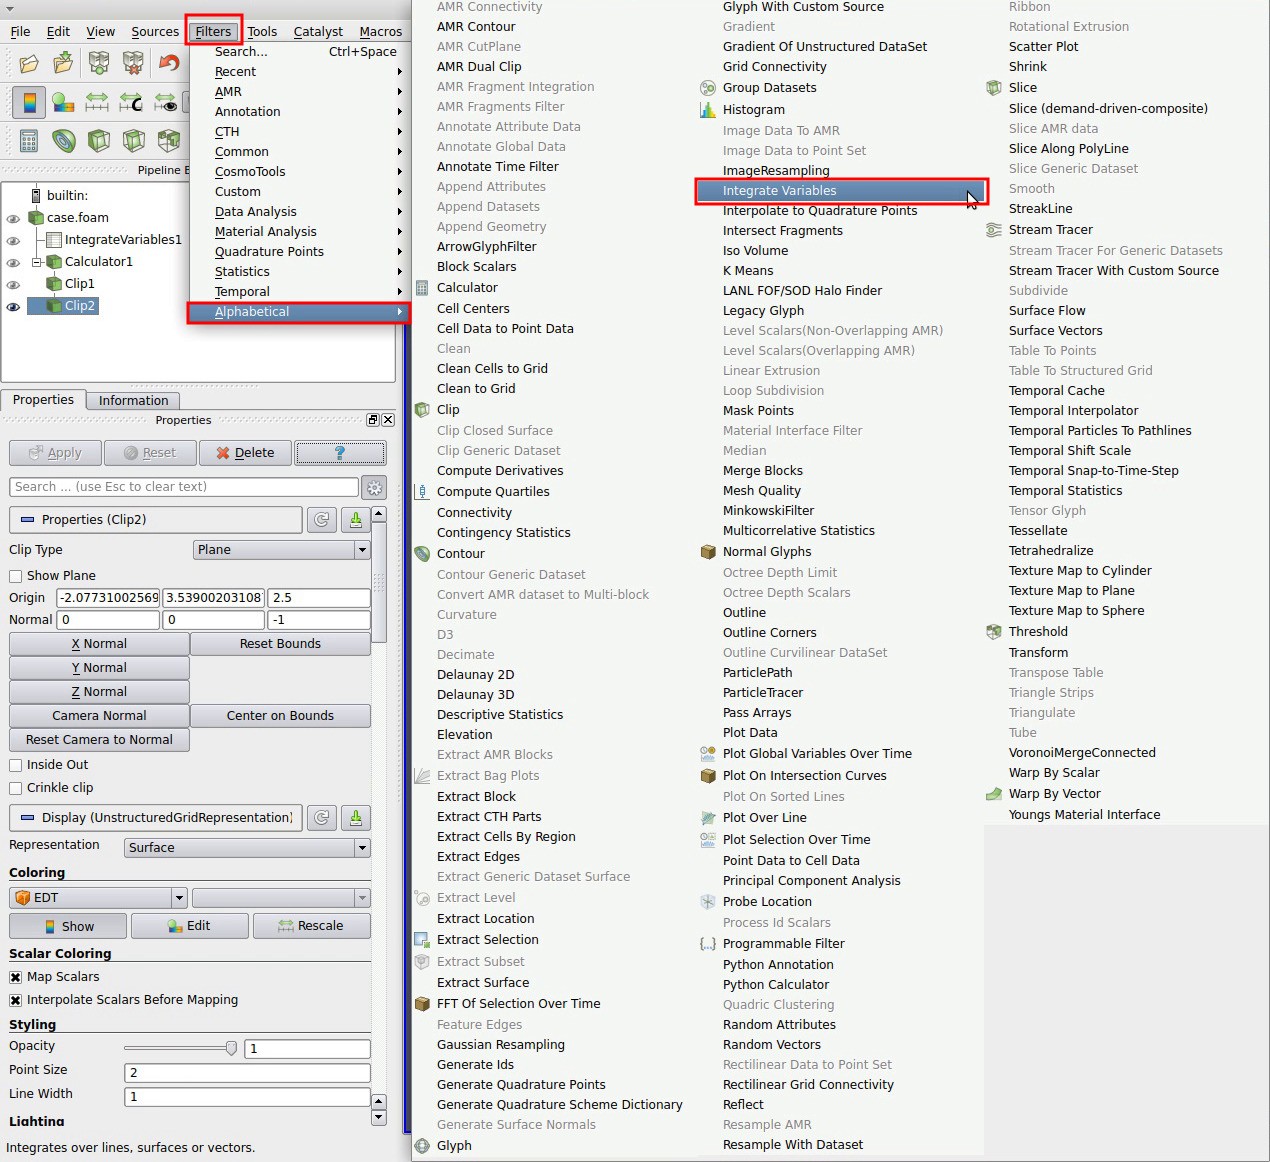
So, on the top menu bar Click on Filters > Alphabetical > Integrate Variables to add integration filter on the complete volume mesh domain.
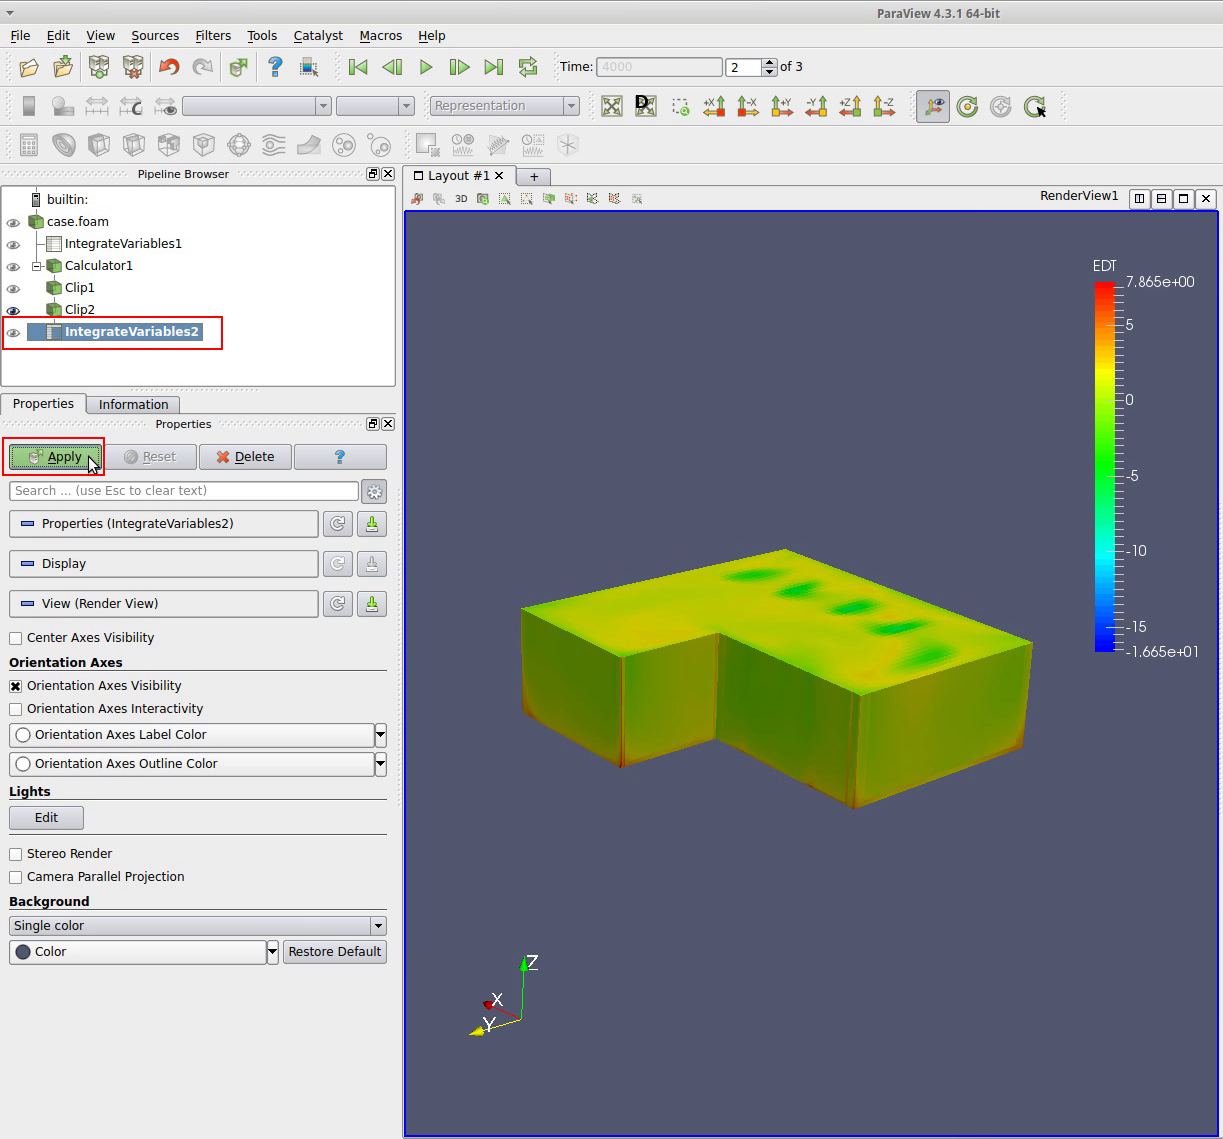
- and click the green ‘Apply’ button in the left panel.
- This will open a spreadsheet table in the viewer as shown.
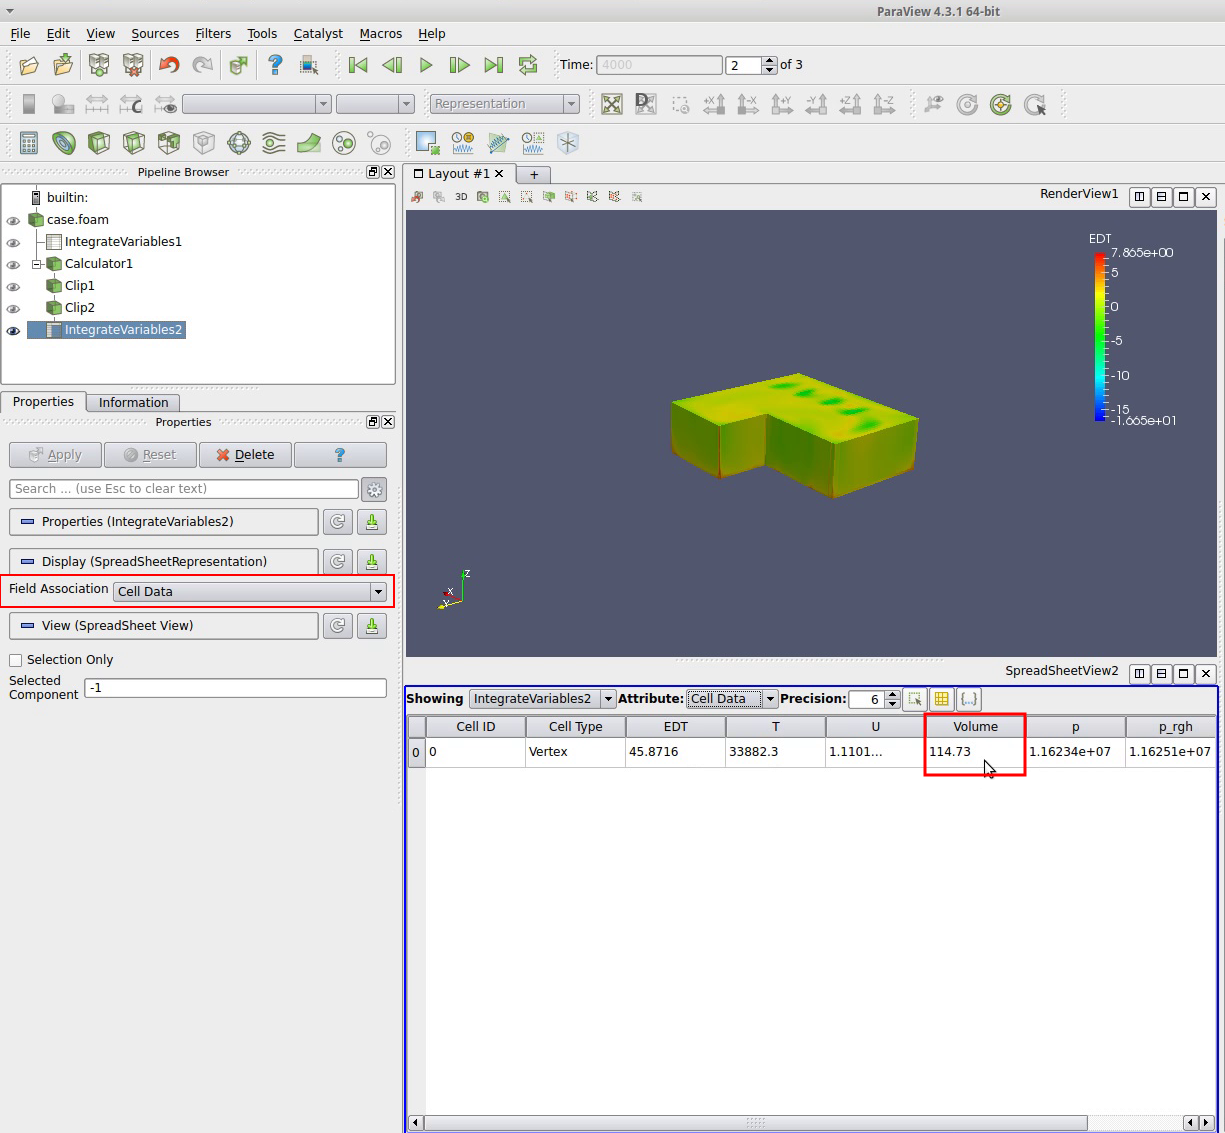
- Now, in the left panel under properties, change the ‘Field Association’ type to " Cell Data "
- The value under ‘T’ is now the integrated temperature.
- You can now calculate Tc (avg room temp) by dividing this integrated T by the volume. i.e 54702.5 / 185.12 = 295.4975 Kelvin.
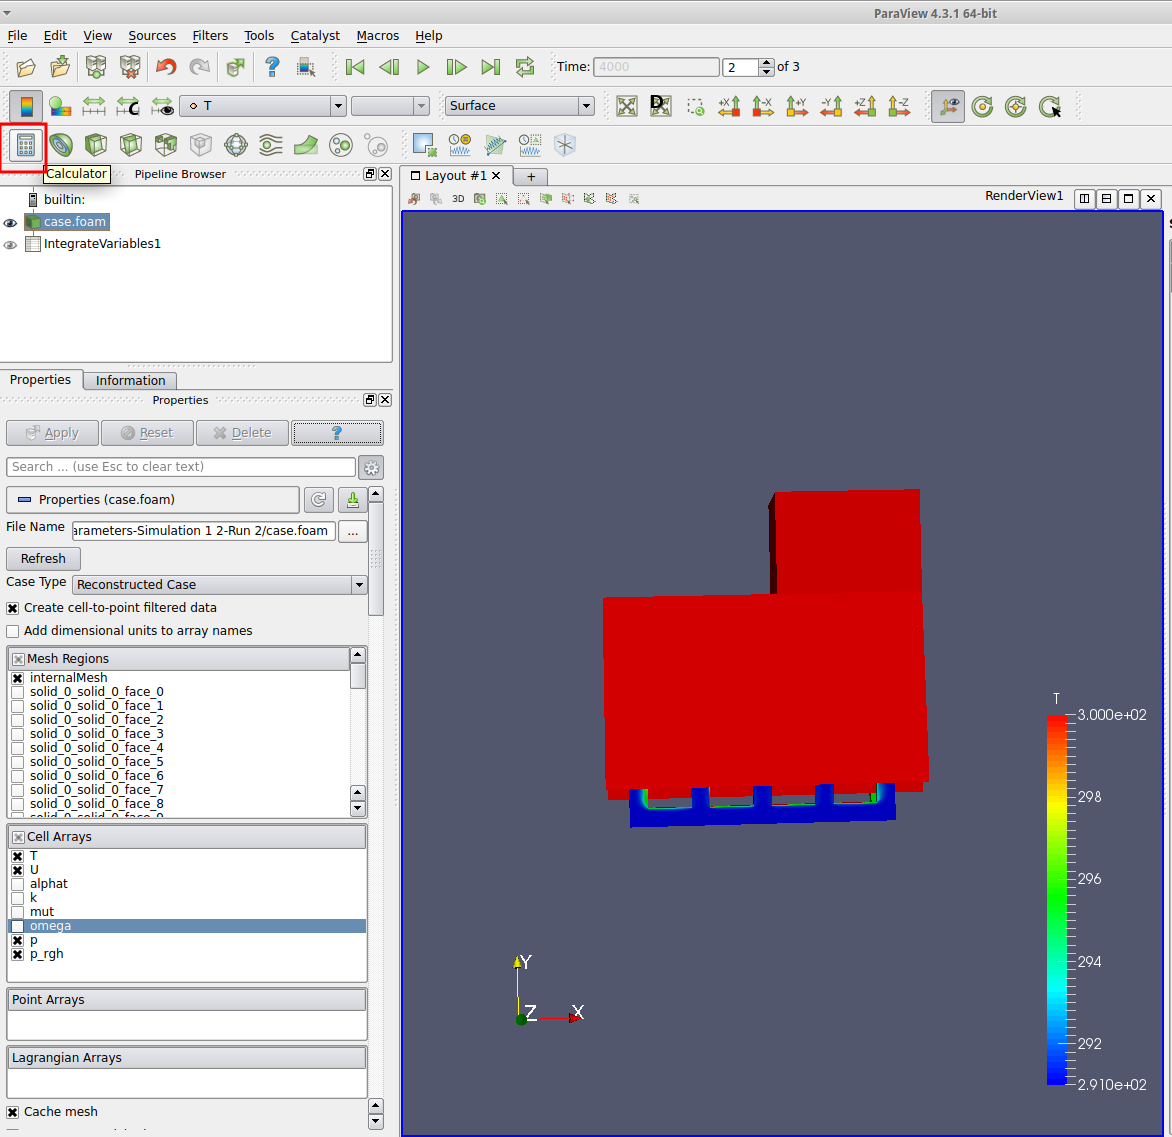
- Now click back on the ‘case.foam’ in the Pipeline Browser
- and click on the ‘calculator’ icon to add a calculation filter.
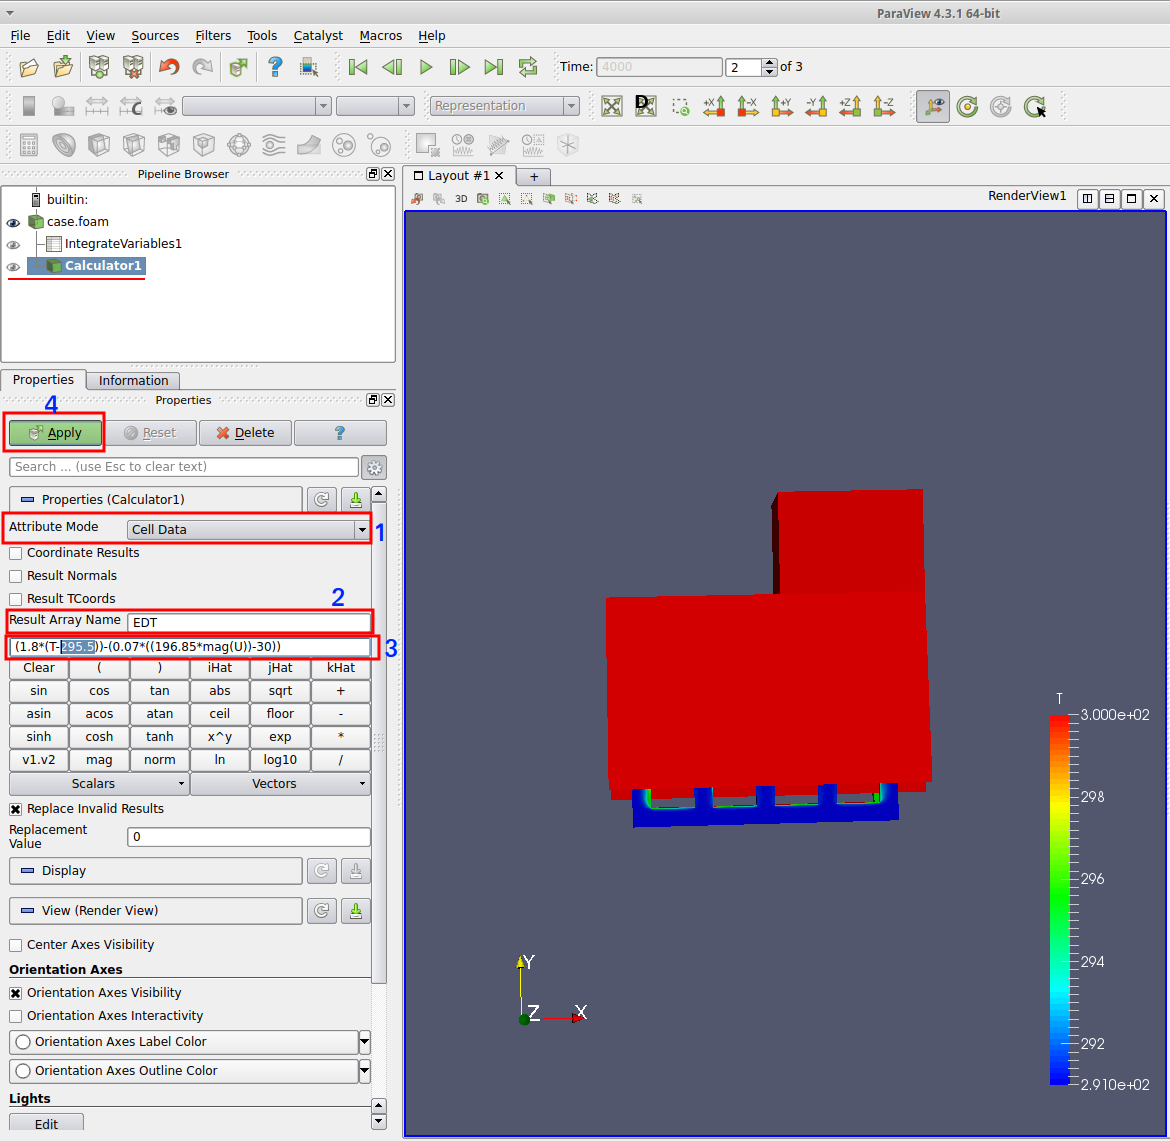
- First, under properties change the ‘Attribute mode’ to ‘CellData’.
- then, ‘result Array name’ to ‘EDT’.
- Then copy and past the EDT formulation (repeated below) as shown. Here the Tc is already replaced with the value 295.5 computed earlier.
(1.8(T-295.5))-(0.07((196.85*mag(U))-30))**
- Lastly, click on the green ‘Apply’ button.
- You can now change the field variable from the drop down list to EDT.
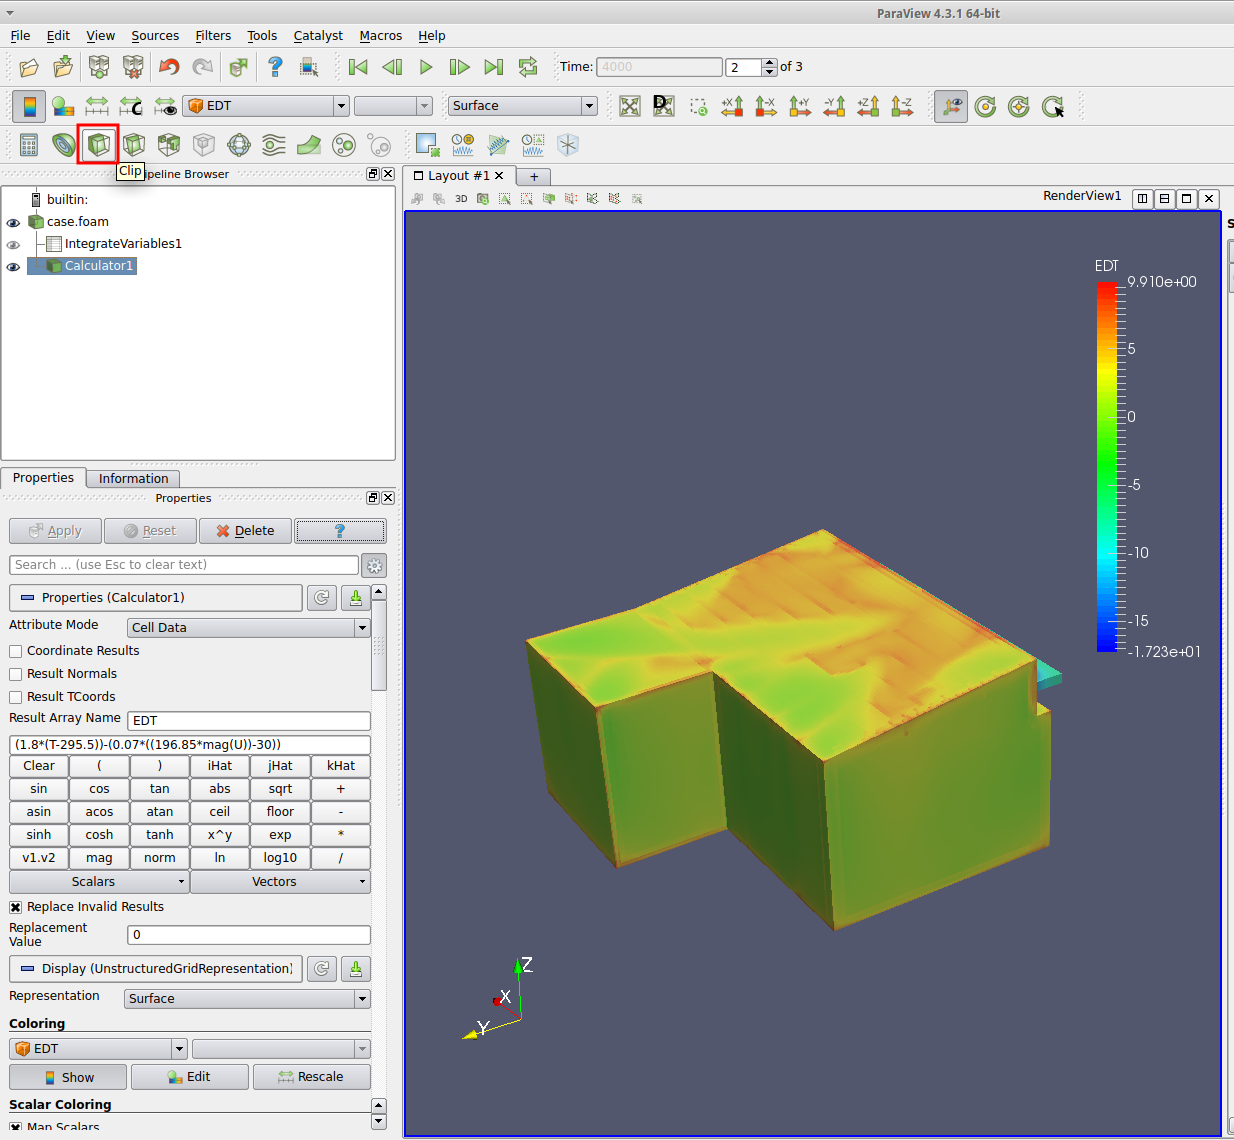
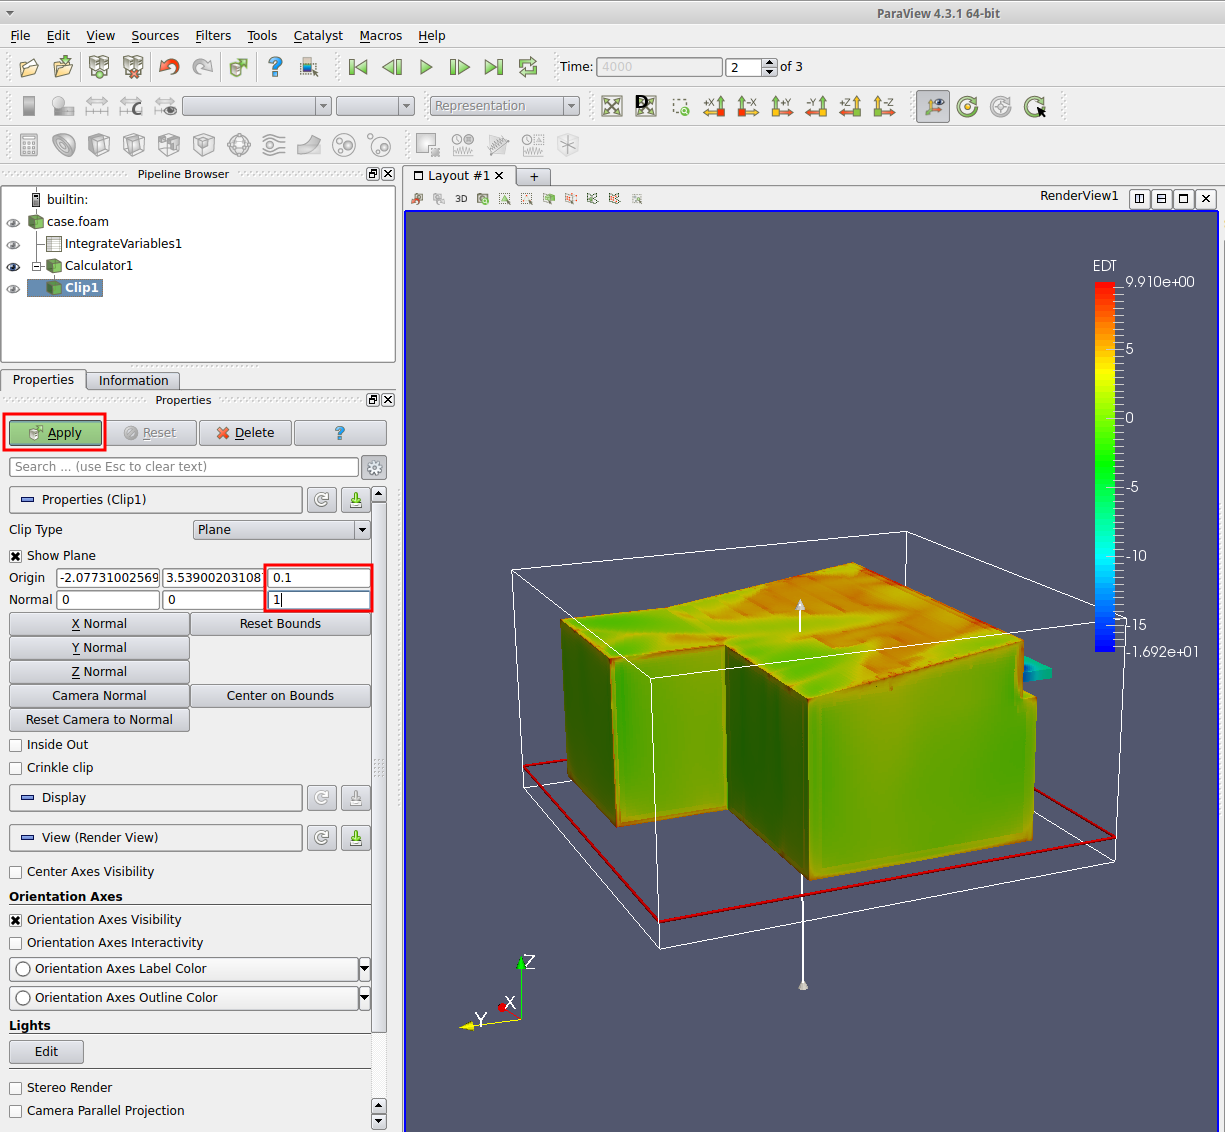
- Next, we will Clip the domain for the zone of interest (see ADPI definition) by clicking on the ‘Clip’ icon in the tool bar.
- Change the 2 values for Origin and Normal as shown and click Apply.
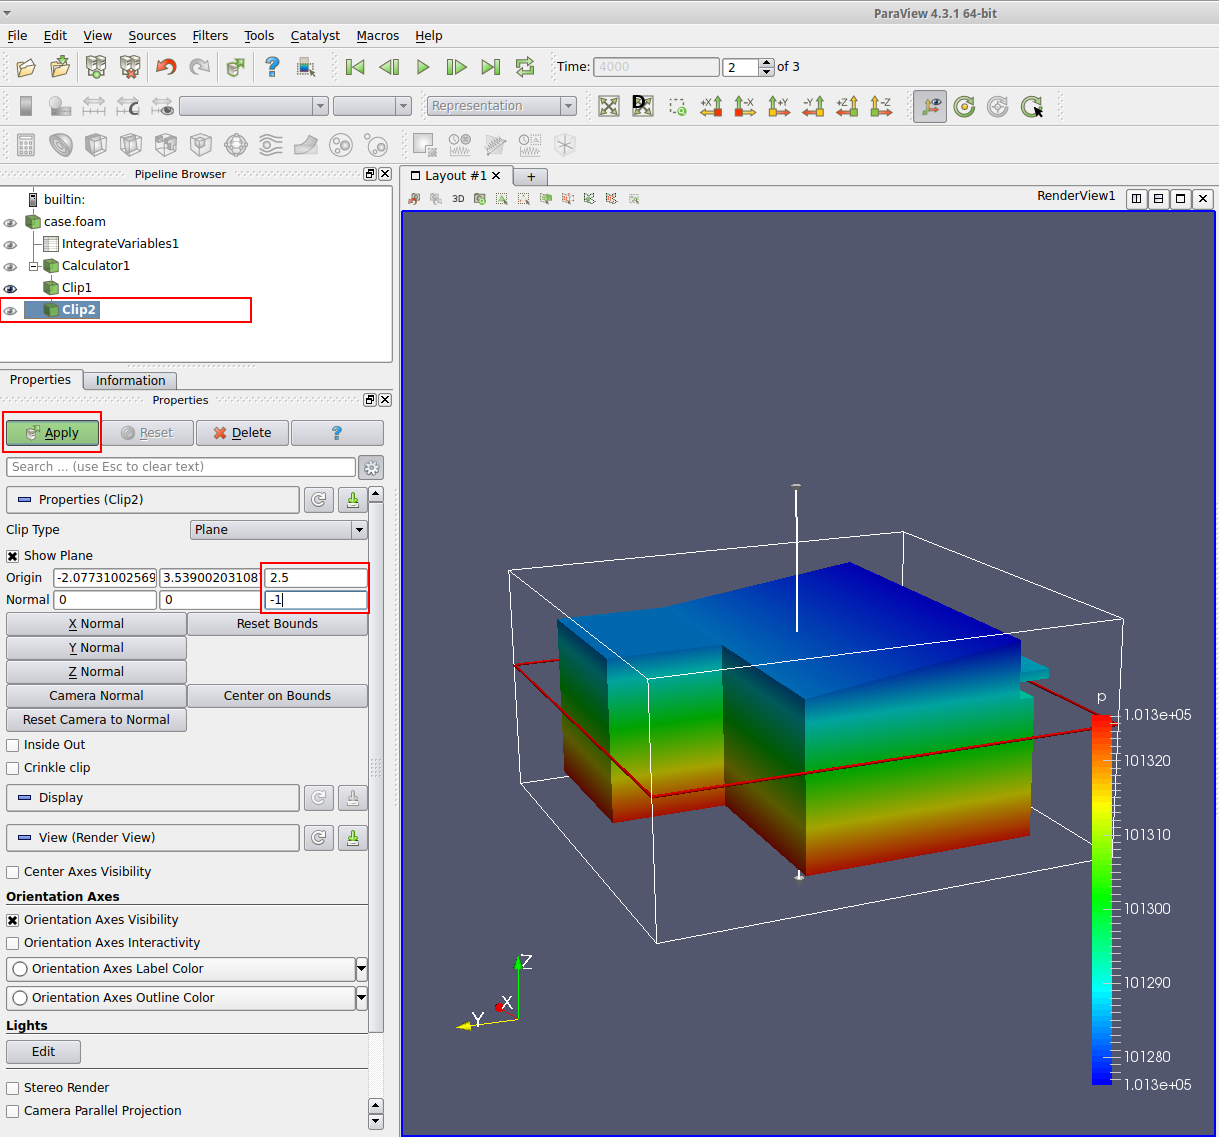
- Again apply a Clip filter by clicking Clip icon (to clip the top), enter the values as shown and click Apply.
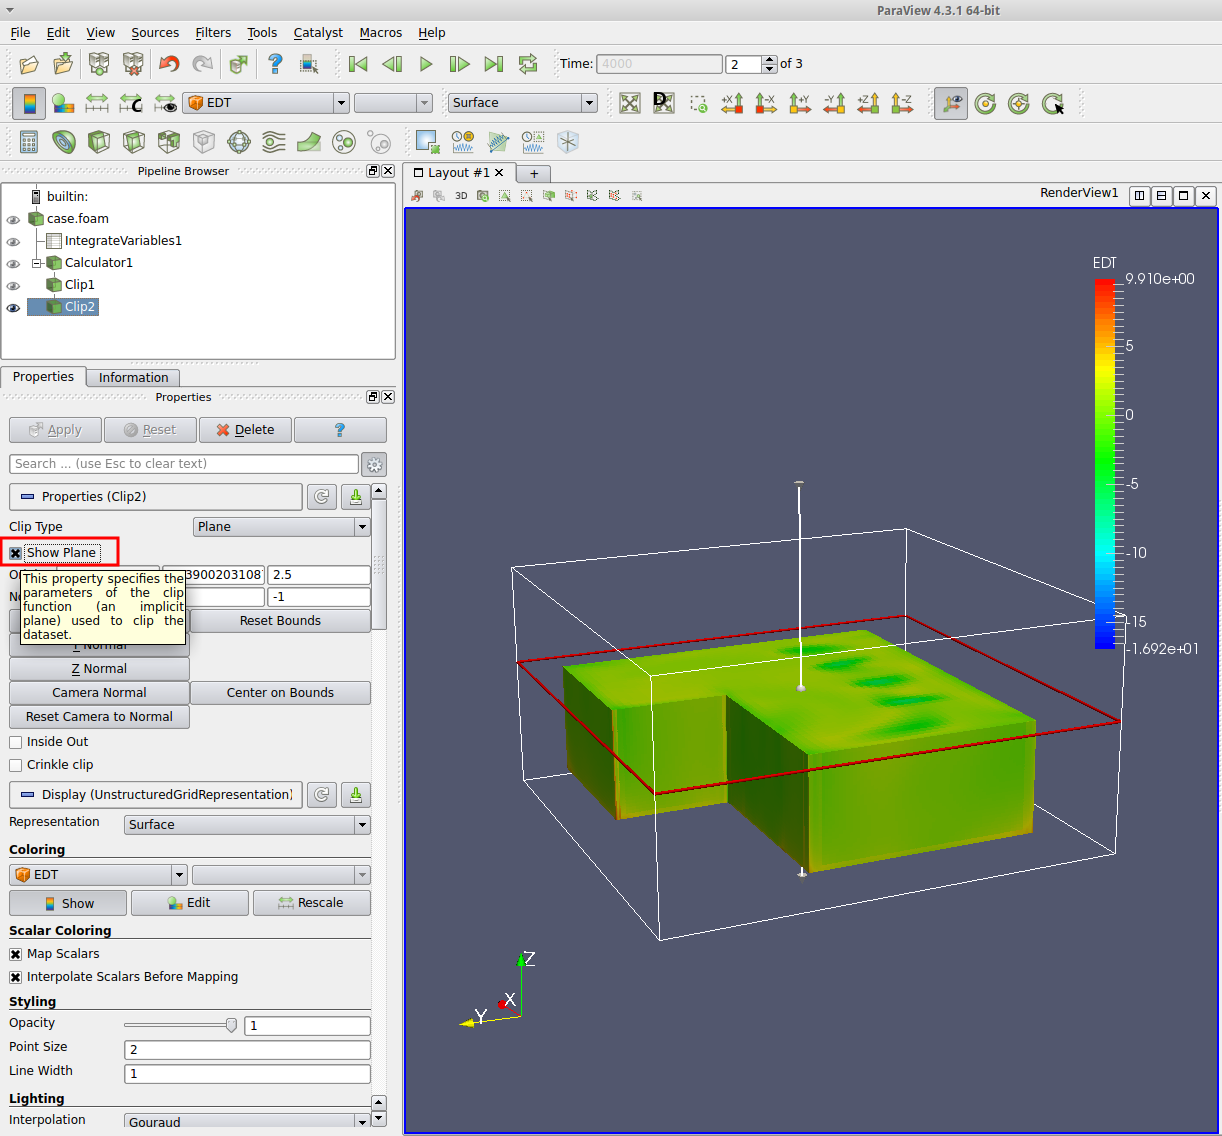
- To hide the outline, uncheck the ‘Show Plane’ under properties.
- Now we will calculate the volume of this zone of interest for ADPI. So, on the top menu bar Click on Filters > Alphabetical > Integrate Variables to add integration filter and click on Apply.
- Change the Field Association to ‘Cell Data’ and then note down the Volume of this zone from the opened spreadsheet in the viewer. The value is 114.73 and will be the denominator for the ADPI formula.
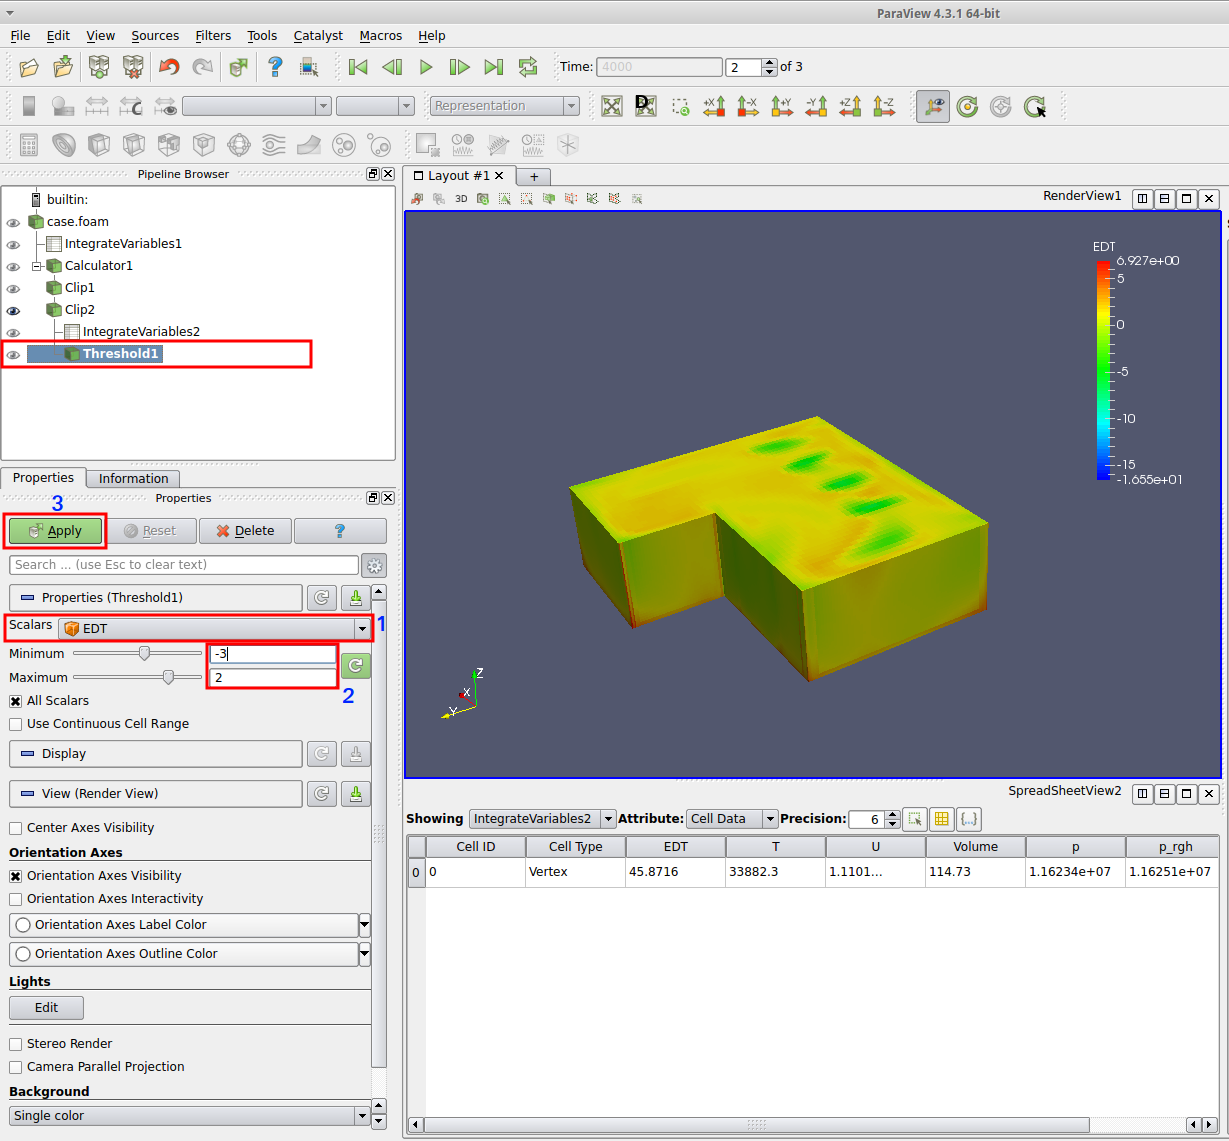
- Now to find the cells that satisfy the criteria: –3º to 2ºF for EDT we will apply a threshold.
- So goto, Filters > Alphabetical > Threshold to add the filter.
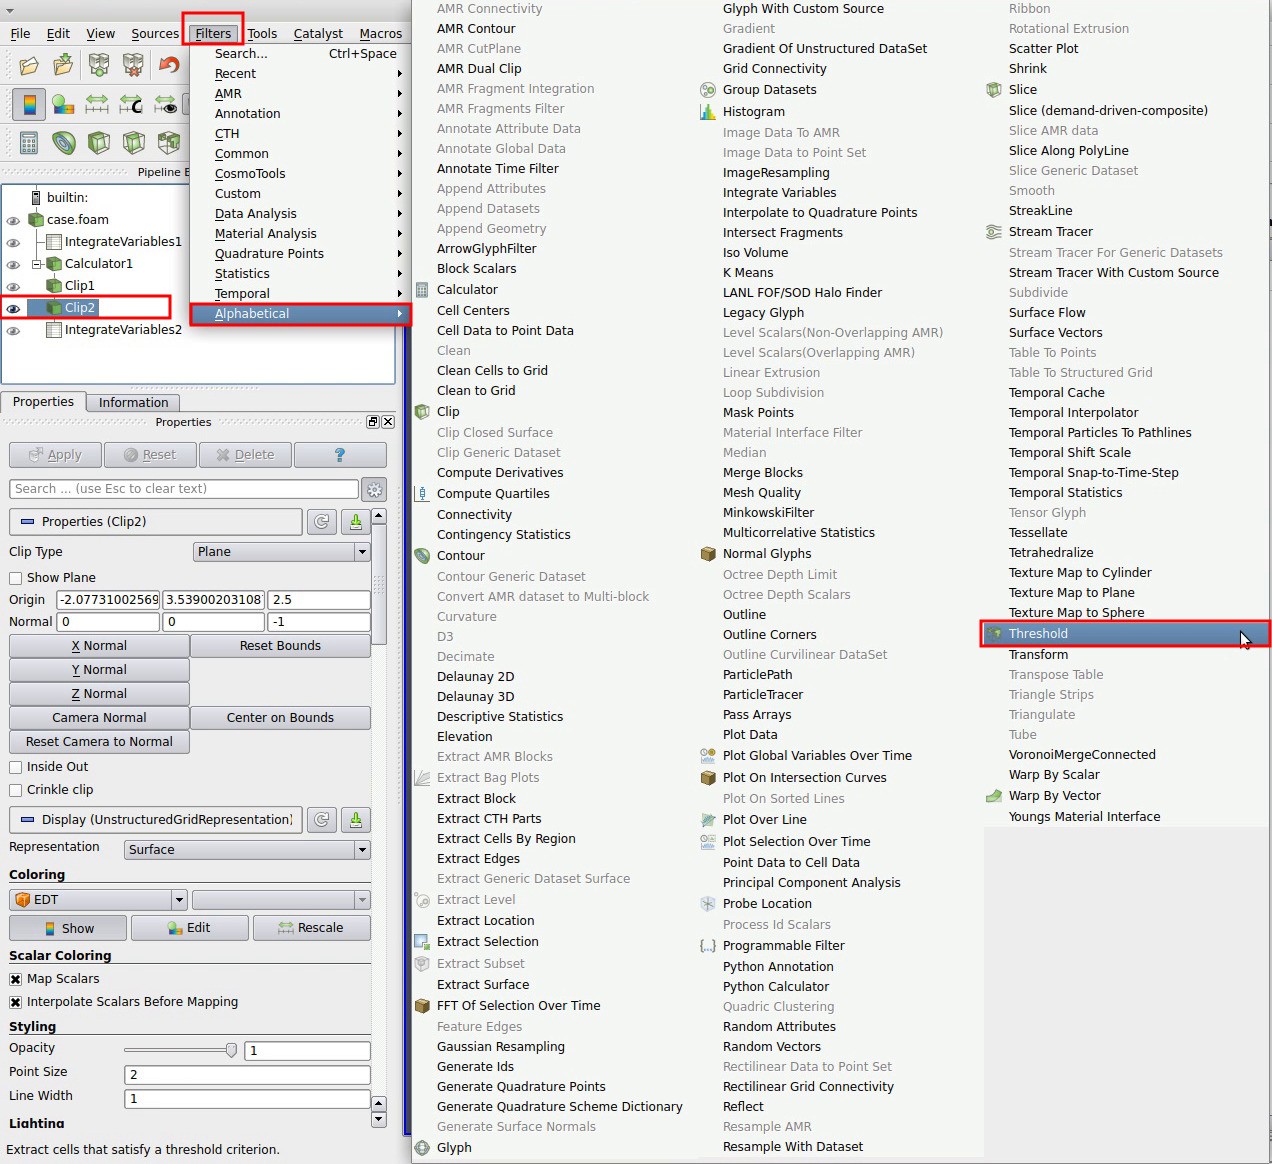
- Change the Scalar to ‘EDT’ , minimum to -3 and maximum to 2, then click on Apply.
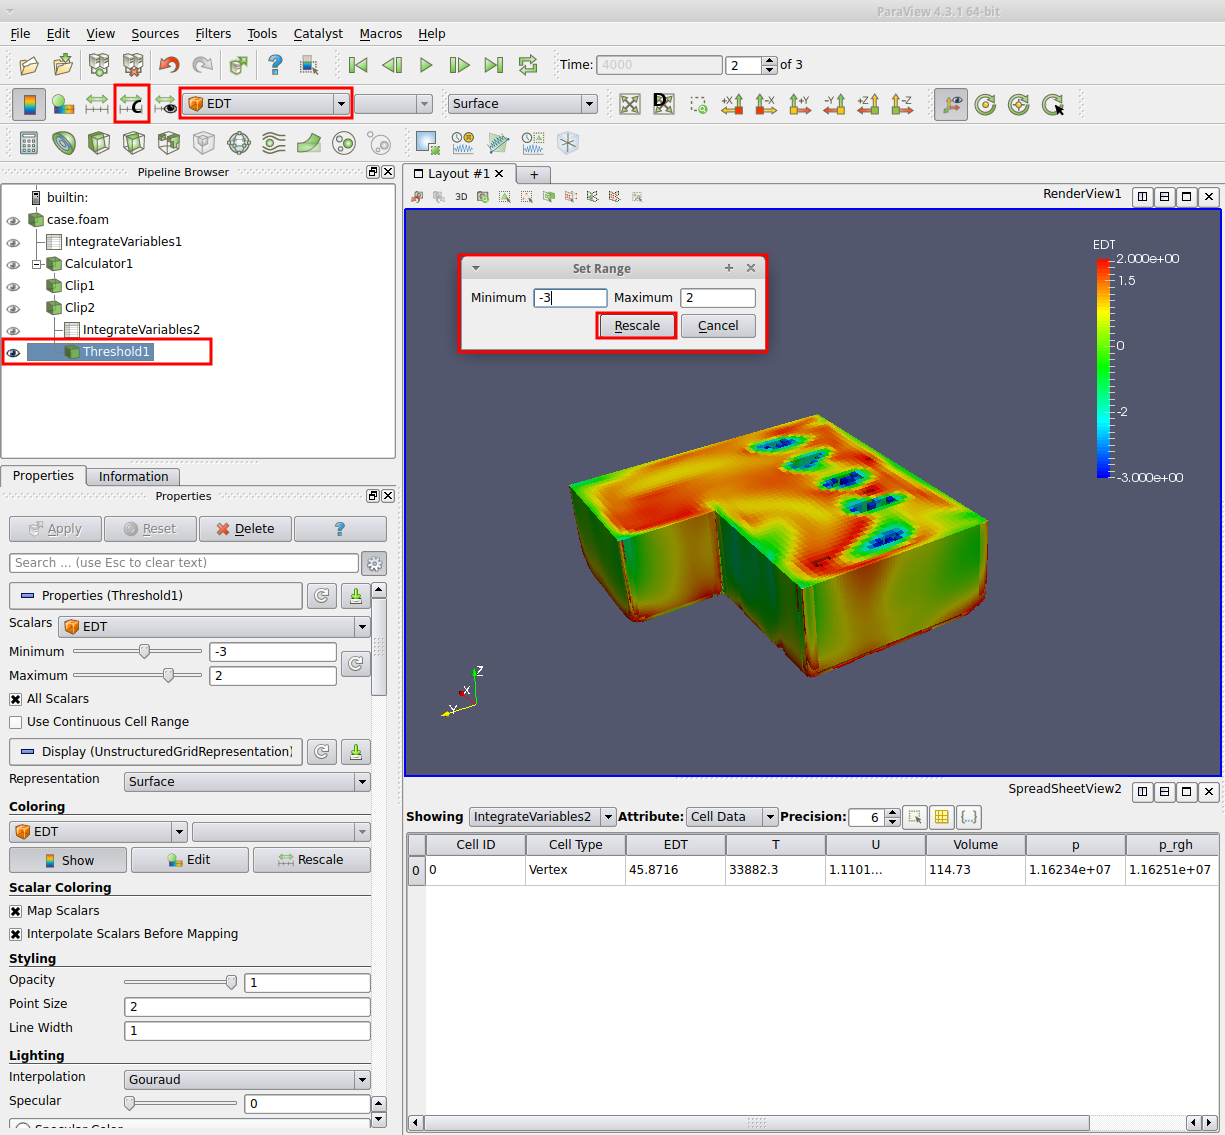
- Now make sure the field variable is selected as EDT, then click on ‘custom range icon’ as shown.
- enter range as -3 to 2. and click Rescale to update the viewer to the threshold range.
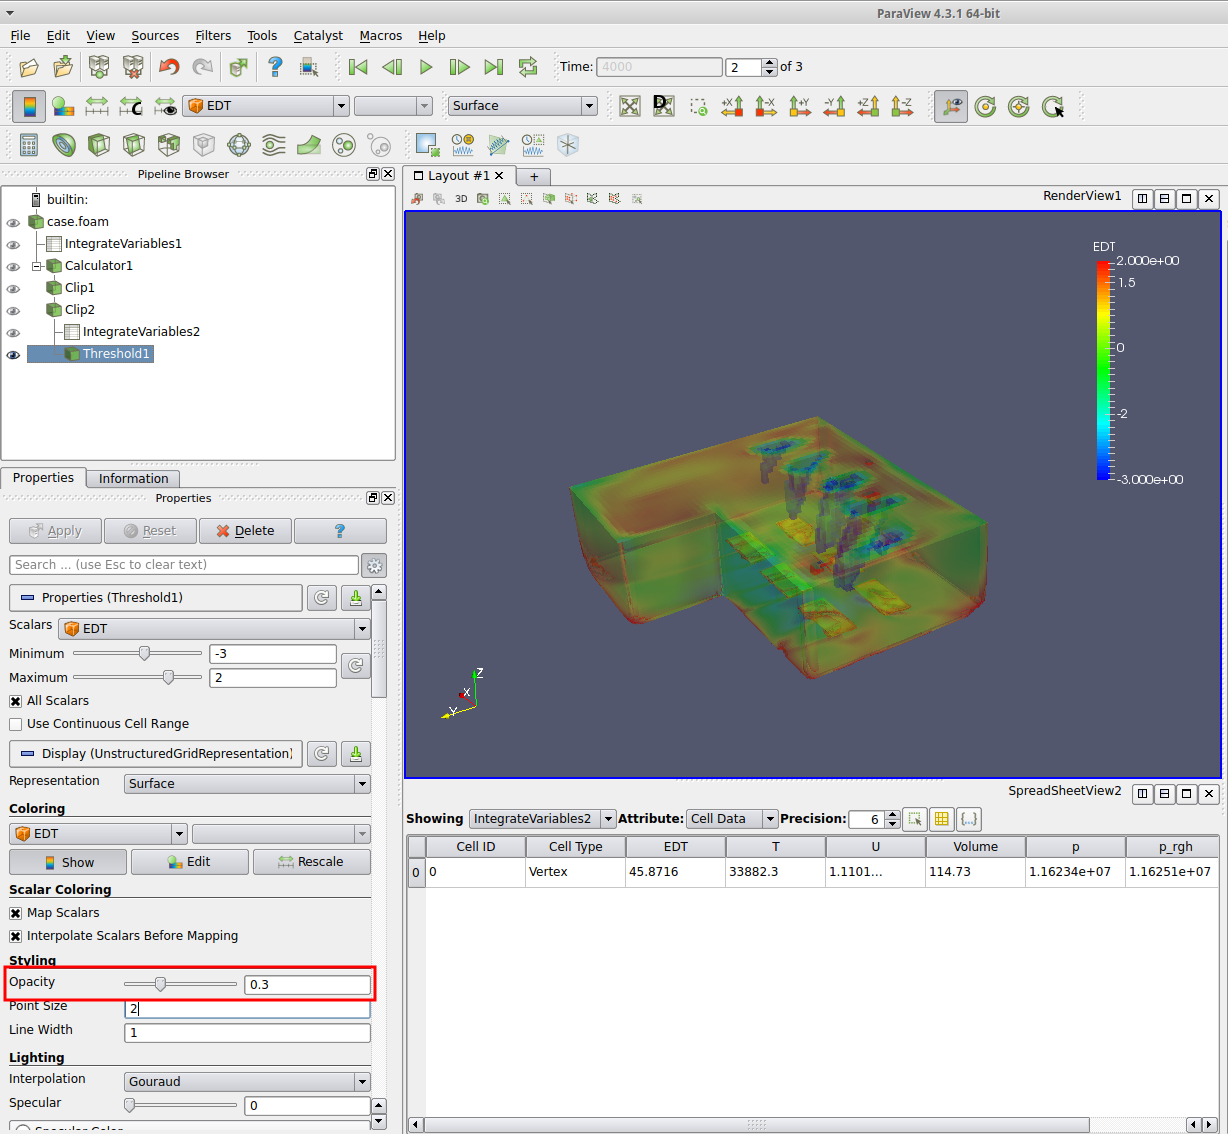
- To see the threshold domain, under properties (for threshold) change Opacity to 0.3 and press enter.
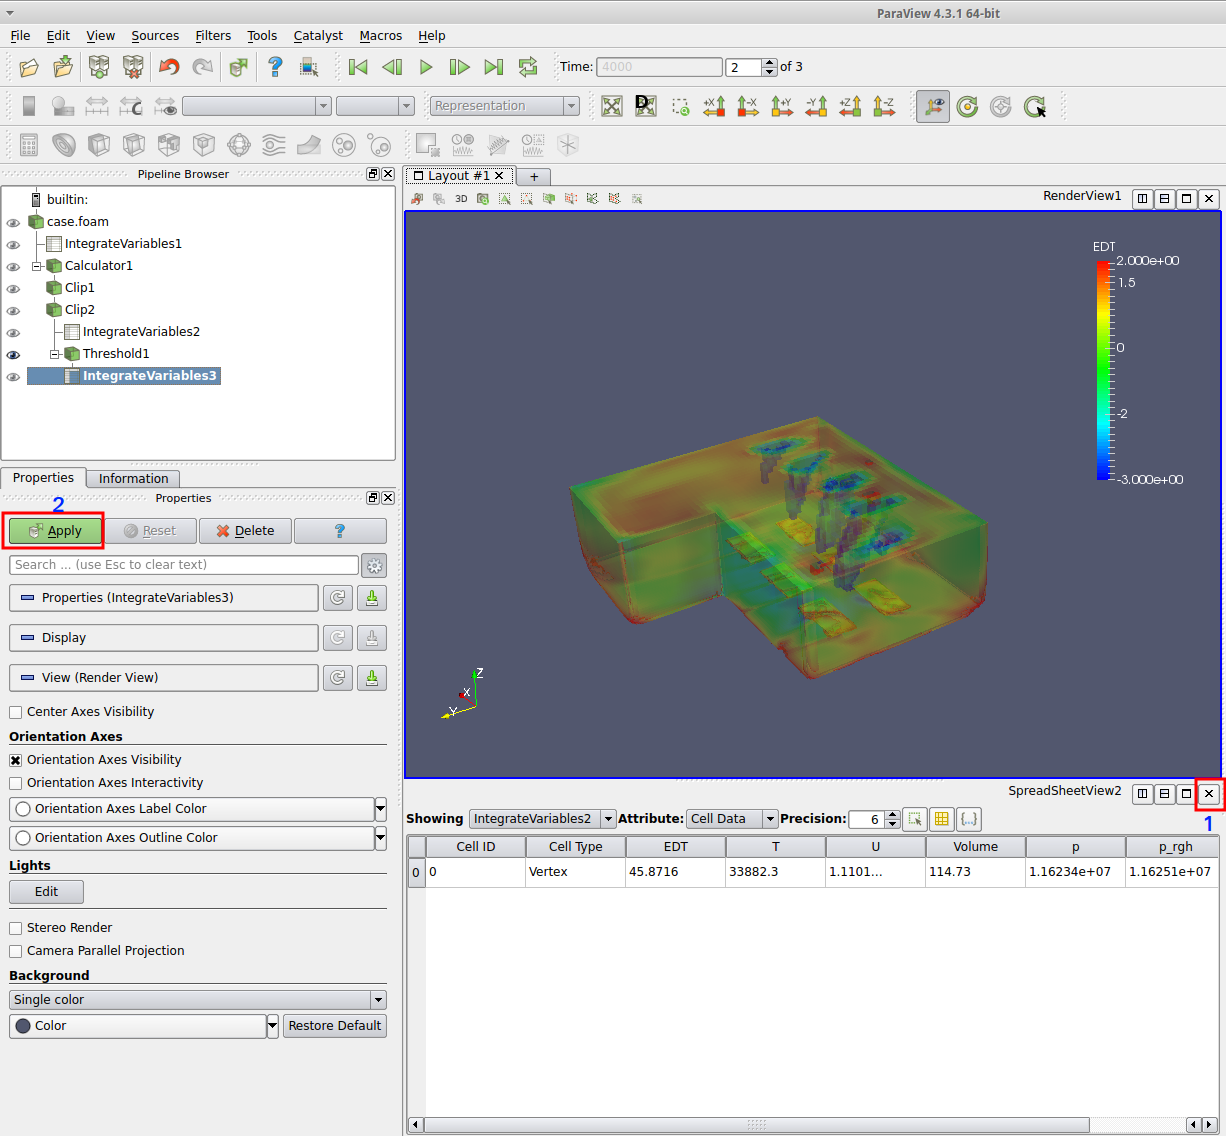
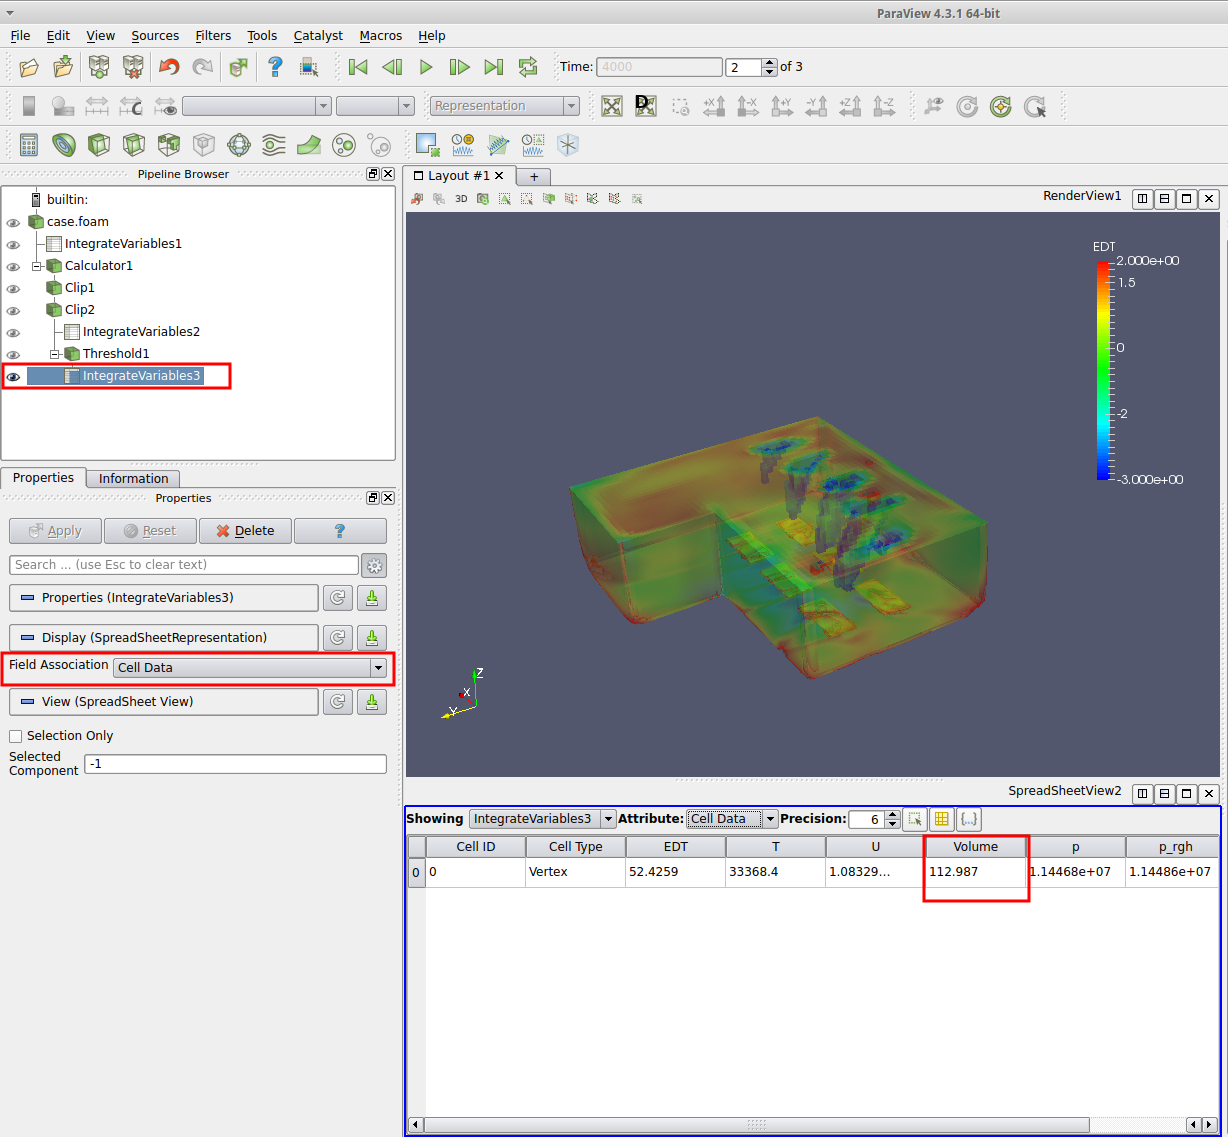
- Now to calculate the volume of this threshold zoone, we will add a Integration filter as before.
- So goto, Filters > Alphabetical > Integrate variables , to add the filter.
- Close the previous spreadsheet by clicking the cross icon ( ref #1 in figure) , then click Apply for the new filter.
-
with the Latest filter selected, change the Field Association to Cell Data and note the value of the Volume of the threshold zone. The value in this case is 112.987
-
Now to calculate ADPI: divide 112.987 by 114.73 = 0.98
- Further, to visualize EDT inside the domain, click on the ‘Calculator1’ filter in the Pipeline Browser and apply a filter as follows:
- So goto, Filters > Alphabetical > CellDatatoPointData to add the filter. Check the 2 options as shown and click Apply.
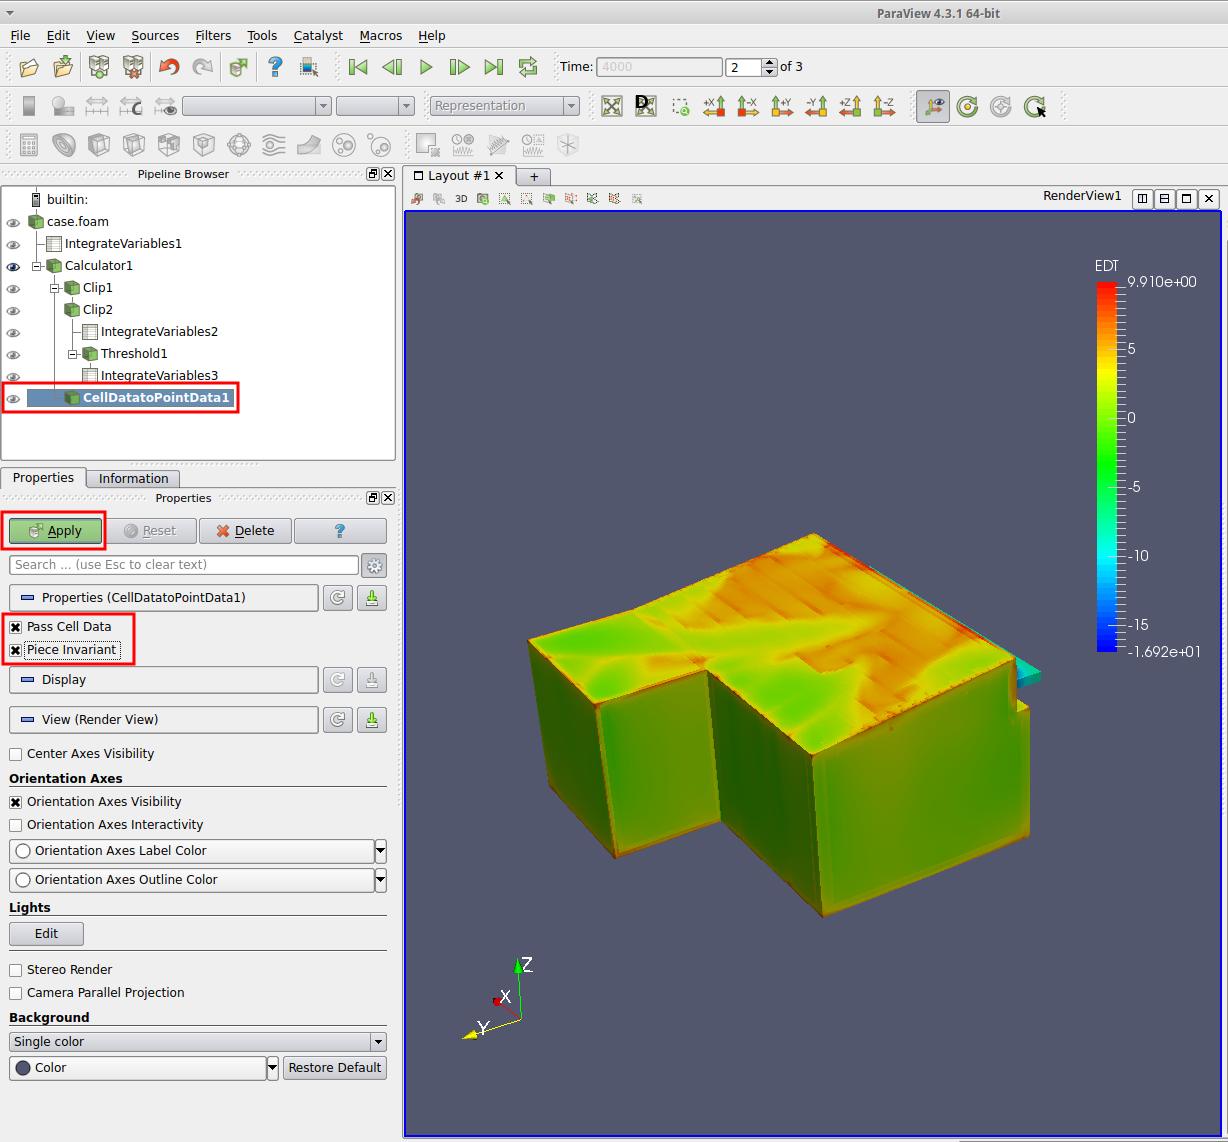
- change the field variable to EDT point data as shown.
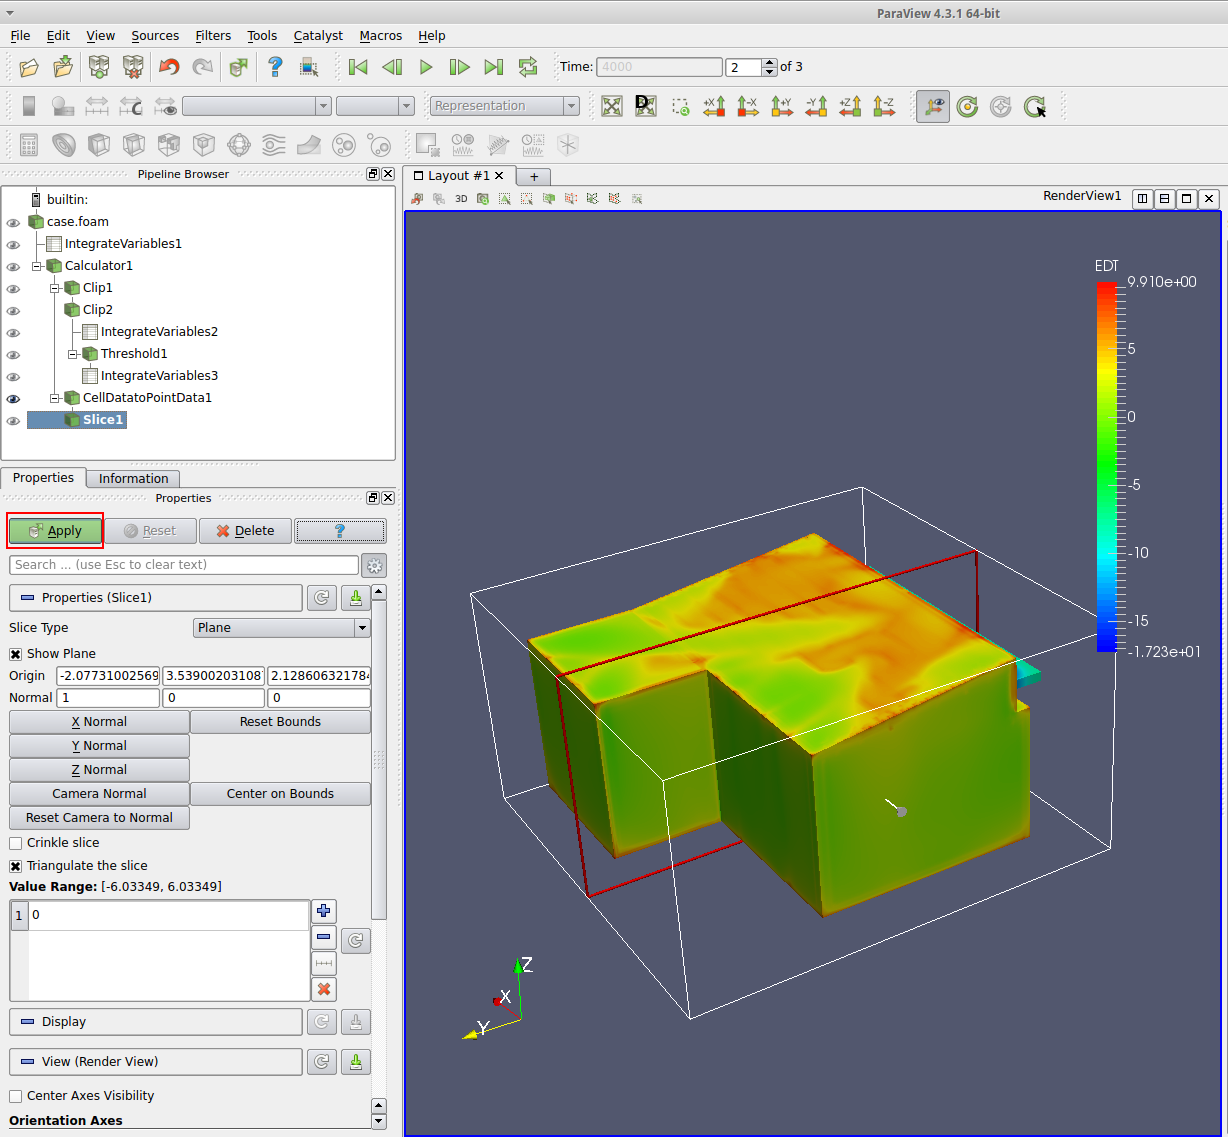
- next we create a 2D slice of the domain by clicking the Slice icon as shown .
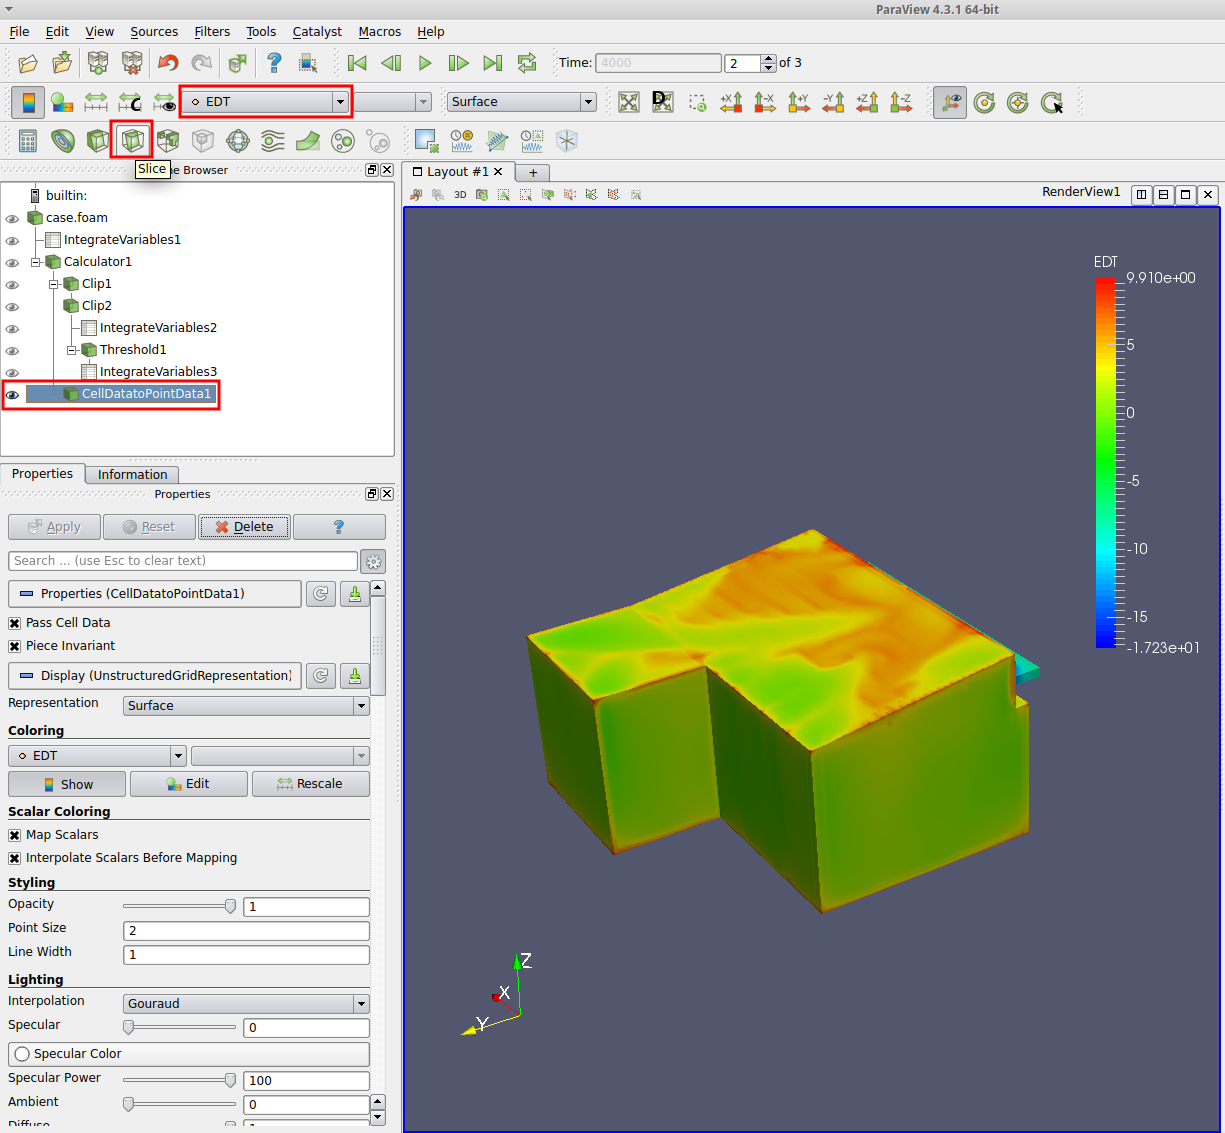
- Then click Apply with the default parameters.
- Again, change the field variable to EDT point data as shown for the slice and uncheck the ‘show plane’ option .

-
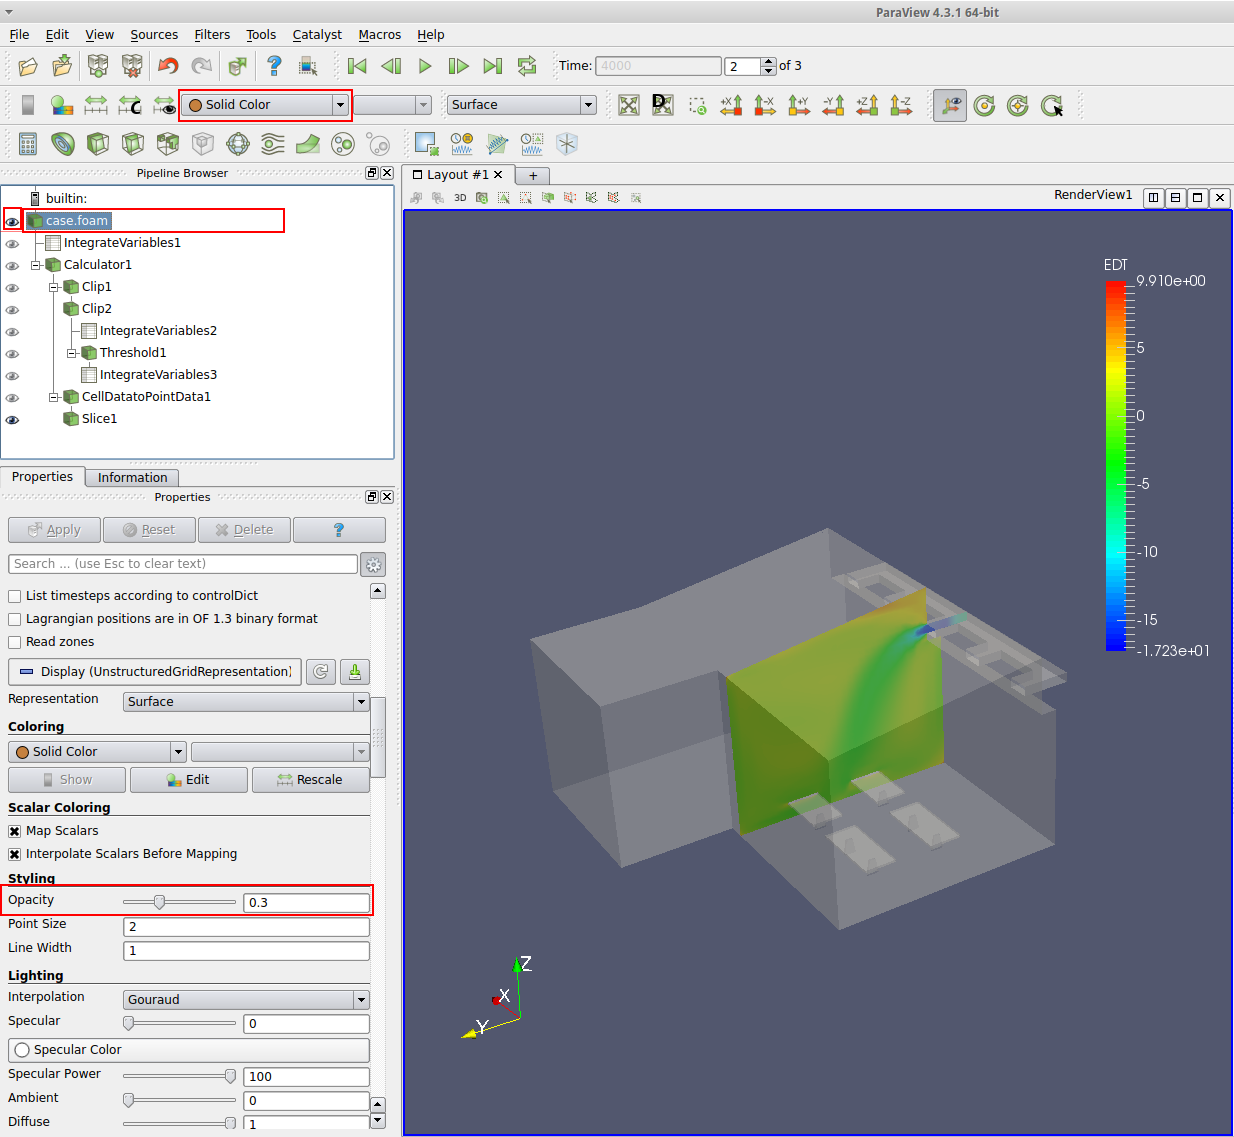
Lastly to view the room geometry outline, Click on ‘case.foam’ in the pipeline browser and click the ‘Eye’ icon to turn on the domain. ( this could take a few seconds)
-
Change the field variable to ‘Solid Color’ and then under properties, the Opacity to 0.3 and press enter.
-
You can then create further slices, by selecting the CellDatatoPointData filter entry in pipeline browser and then clicking Slice icon to see other sections.
-
That is All !