NOTE: This tutorial was updated on 08/2016 to match the updated version of the platform
Exercises
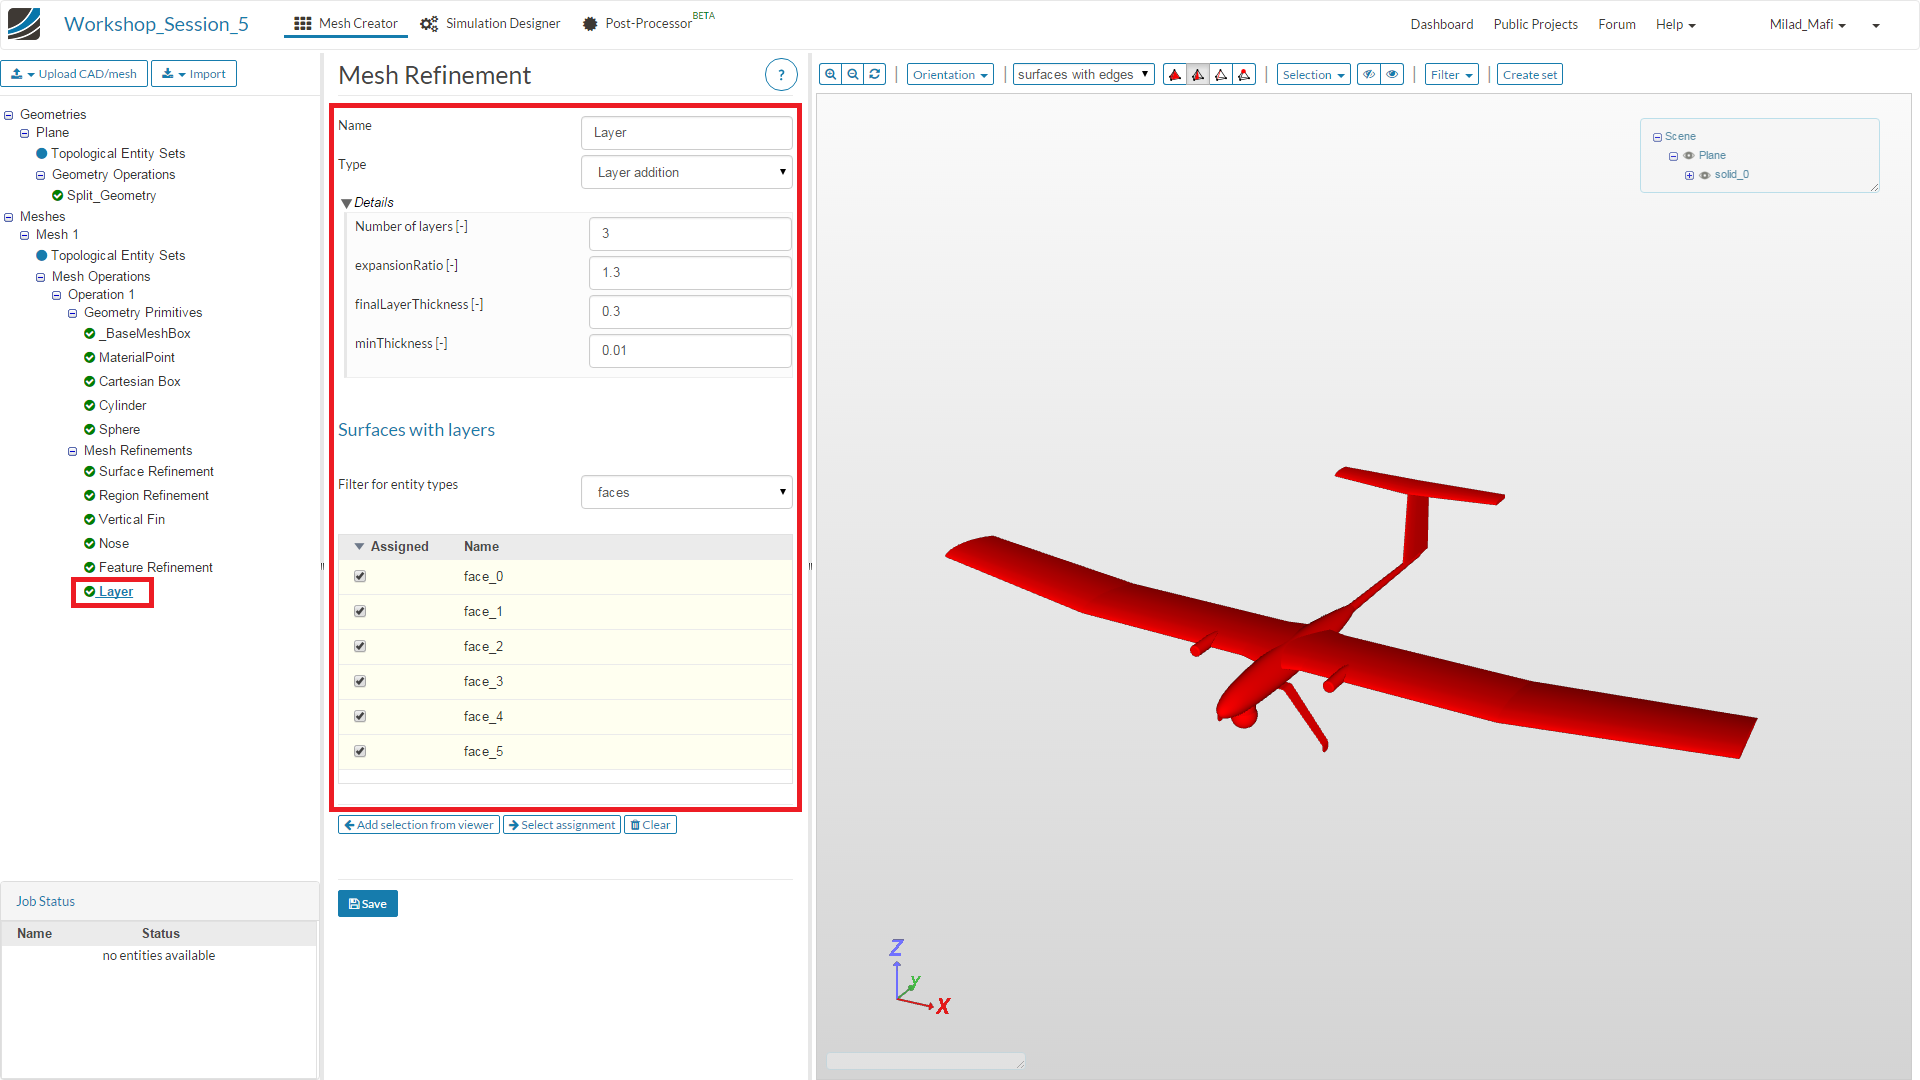
During the second level of the homework assignment we will investigate the influence of the mesh on the results. In detail, we will improve the boundary layer modelling by adding prism layer element on the surface of the plane.
Again, your task is to investigate the behaviour of drag and lift for a airflow velocity of 20m/s, 25m/s, 30m/s 35m/s and 40m/s
Step-by-Step instruction:
Please follow the instructions of Level 1. It is just necessary to create an additional refinement item with following settings:
I just completed level 2 assignment and I am curious how my results compare to others. I have summarized my lift and drag results in the linked document below. My results show that the lift and drag results for the simulation with boundary elements are slightly less.
@cjquijano - thank you for sharing! Super interesting. Will take a more detailed look later. How many layers did you use? And do you have Y+ info of the simulation?
Hi,
I completed both homework assignment and the values are similar (same!!!) to cjquijano’s. I plot the lift/drag ratio curve also,I used 3 layers and I insert the new variable y+, but I cant see it in post processing. what is the right way??
thank you
cheers
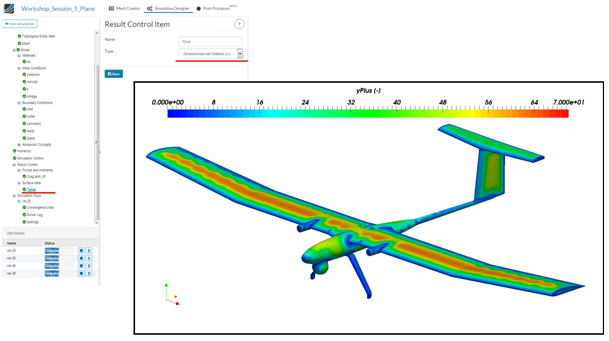
To be able to see Y+ in post-processor you need to turn it on first. It’s just a few clicks. Results Control ->Surface data ->Dimensionless wall distance
@cjquijano - I feel the results you have got are logically very correct. When you add prism layers, effectively , the boundary layer velocity calculation is made more accurate. The cell relative velocity decreases and hence the predicted drag is higher. Parallely, the lowered cell relative velocity affects the values in some cells above, hence lower lift value computation.
But yes,as @anon67859130 Milad_Mafi stated, it is very important to take note of the y plus values as most turbulence models have a numerical domain of y plus in which they work prefectly.
Hi @Maciek,
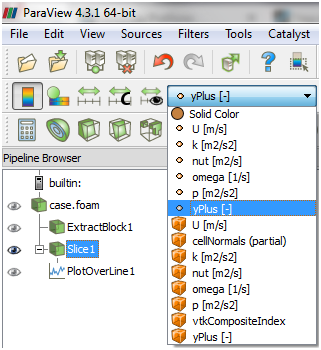
thanks for your reply; but I have some problem to plot the y+ result in post processing. I set the y+ variable in Results Control ->Surface data, but I dont know what is the right filter in PP.
Luca
Maybe try to delete Results Control → Surface data → Dimensionless wall distance and create it again. I remember there was such issue short time ago. It looked as if you had to “activate” this function each time afresh.