I think here the point is exactly to see the divergence, since we are trying to optimize the relaxation factors. If you see the residual plots, they oscillate like crazy. If you see the simulation log, the error gets very high quite early in the simulation. For example for time=82:
time step continuity errors : sum local = 3.76563610418e+82, global = 1.4748516605e+80, cumulative = -1.21876836849e+81
Even if the simulation hadn’t broken at this point, there seems to be no point in continuing. The first way to fix this is of course lowering the relaxation factor. Changing the mesh or the solver could also help, but the focus here is on the relaxation factor.
Thank you for the table, it is very nice! Just a minor note: I noticed that when I changed to the PCG solver, the absolute tolerance was automatically set to the default 1e-5. I didn’t see any instruction to change it to 1e-6 and I only found out now. However, it doesn’t matter, since we want to compare the different relaxation factors, not any of these to the first configuration.
But which tolerances should we use for the extra optimization part?
My mistake, I painted in blue the selections to be made, so if you just changed the solver without editing the tolerances I guess it’s ok.
For the additional raffle, what I can see from all the simulations (52 and counting), the default settings are the best in regards of time and convergence…
for the optimization, I noticed you can identify how to adjust the relaxation factor based on the number of iterations for that factor. If you have more than 10 iterations for a particular time step, the solver becomes unstable. If you have zero iterations for several time steps that factor is over damped.
Is it possible to come up with a solver that adjusts the tolerances and relaxation based on the number of iterations? For example at the beginning of the simulation your initial conditions are way off. A loose tolerance and wide relaxation will help “jump” closer. Then as you progress the tolerances and relaxation changes to provide stability and accuracy. Mid-way through the relaxation factors will be to 1-5 iterations for each factor. And at the end all the factors approach zero iterations (last calculation) together. instead of one factor having 6 iterations the prior time step.
I was just wondering, is the only way for me to see the actual execution times for your chart items, for me to run all the sims myself or could you just publish the results now since the homework period is now long over?
I would also like to see each items values for Force and Moment results, if that is available
Else, I will add this workshop exercise to my ever increasing ToDo list …
Do you mean with execution time in this case also the core hours to estimate if you are able to perform all the studies listed? Forces and Moments can be added straightforward inside the Processing step
I still have not been able to find out if this ‘ExecutionTime’ is core hours or is it ‘Cores Hours’/(# of cores) or whatever
Dale
Yes, I understand where Forces and Moments can be viewed, but I also consider it would be a good metric if all the tested sim runs gave us the same results.
From what I can see he has not set his sim up for Force and Moment results (I see no green check beside Result Control here):
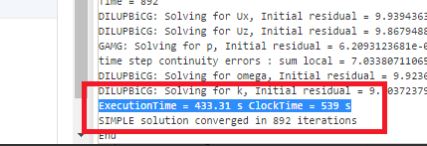
thought the intention was another one The ExecutionTime is the time spent by the processor(s) and the ClockTime is the “real life time”, if you want to call it like that Core hours are something different: With 1 core hour you can simulate for 1 hour on a 1 core machine, 30 minutes on a 2 core machine etc.
Definitely a valid point - one run should be sufficient as they won’t differ among users (neglecting round-off errors here).
So, if I ran the same simulation with both 16 and 32 cores, would they report the same (or very close to the same, off by on how much overhead time that the cores have to use to stay organised) ‘ExecutionTime’?? (I suppose I could just try that and see for myself but since I have your ear )
So, then we should likely make the assumption that execution time IS somehow a function of the # of cores used. This would then have a negative affect on the metrics for the results of this investigation of the impact of different numerical settings on the overall simulation time IF the same number of core was not used for each study sim. Maybe this would have been assumed, but I can not find a specific reference as to make sure that you use the same # of cores for each sim in this topic or video (just that 1 core is OK for 2D at video time 47:20). Maybe I am too picky about these things, sorry
using the same cores would roughly give you the same execution time (difference in time depends on many factors). I think you know the video I posted talking about the number of cores that should be used for a specific mesh, approx. 1 core per 50k CV (control volumes).