Here is my project:
Im trying to see the drag and lift difference between wing / winglet. And vorticity at the wingtips.
My stl files cant be used to create inflate boundary layer with mesh refinement , and my stl files dont have a nice smooth surface after meshing . (to late in the project to change this ).
Values used in this project are for 10000 meters altitude, velocity 60 m/s to get reynolds number → 1.2e+6 and machnumber below 0.3 CFD Online - Turbulence Properties, Conversions & Boundary Estimations is used to get k and epsilon , using eddy visc. ratio 5 and turbulence itensitive level at 0.5.
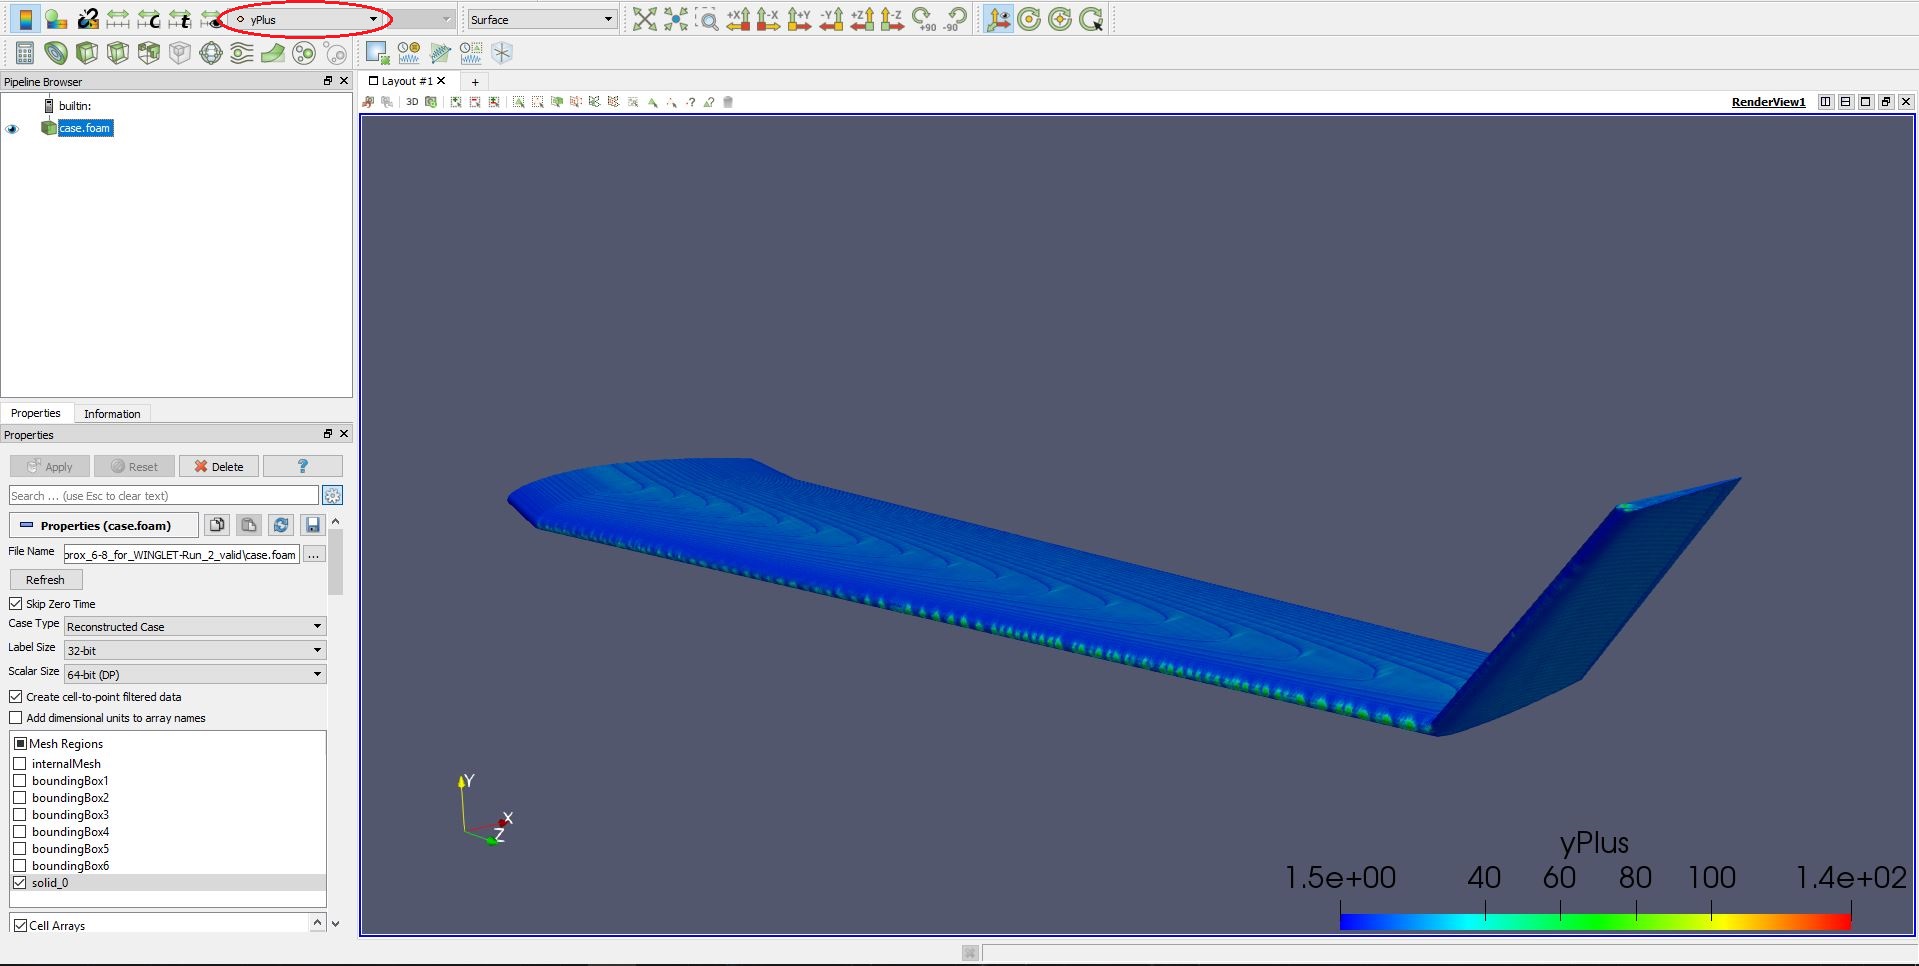
How can we read the Y + true value after simulation runs? And howto change the cells around my wings to best catch the viscous sublayer without inflate boundary layer function.
From post processing ,it seems that my y + is around 15-20 because of the surface issue.
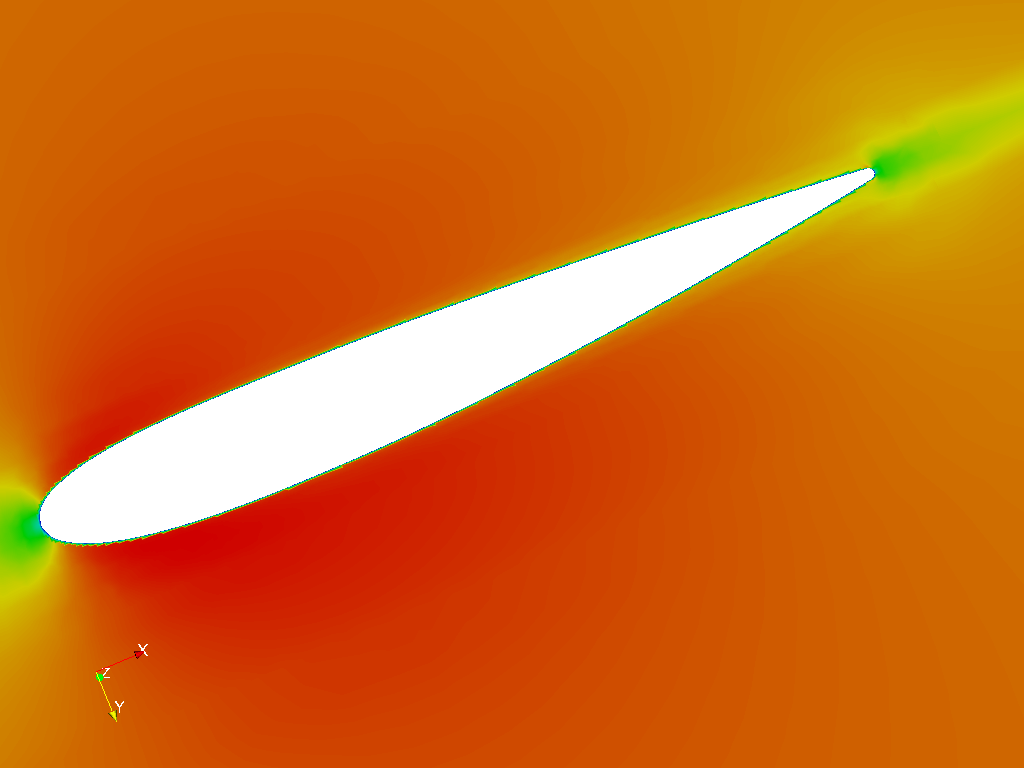
Anyone who can give some advice for my project ? How to create picture of the vorticity at the wingtips?
Since you already have set the result control to obtain y+ all you have to do is load the data into ParaView offline and click on the circled icon where there will be an option for y+. Note, this only appears if you have selected your result control to obtain y+ like mentioned.
Do extract out the y+ on an actual graph to see what the true value is rather than eyeballing it like I did here.
You are using a wall function at the surface and that dictates a y+ of 30 to 300, any less than that would be alright but you shouldn’t see significant result deviation. To improve your results I would recommend using something like a full resolution k-w SST with y+ <1 or even LES spalart allmaras if you really want accurate results. Do note the last turbulence model is extremely costly so beware. Not so sure about k-esp and full resolution with y+ <1, @1318980 any idea on the accuracy of k-esp with full resolution and low y+?
However you did say your project is pretty much in the later stages so not really much you can do without geometry clean up and further mesh refinement.
This one is little more difficult. I would simply just place a streamline (a quick google search on streamlines in ParaView should help) at the front towards the back of the tip to show the vorticies. Of course, a nice comparison picture with no winglet would help. Don’t forget to show the CL CD difference with and without winglets, that is a better data point to compare.
Thanks for a very helpful answer , I did use helyx first and editing the files. Then a used computed derivatives ,streamtracer, tube and contour. in openfoam there is a postprocess command simleFoam -postProcess -func Q
is there a way to find the max value for Q in paraview?
Thanks for your help, So if a choose wall function simscale dictates a y+ 30 to 300. But how is y+ when using full resolution? How to controll y+ ? Around 1 is my goal,but is it possible with no use of the inflate boundary layer refinement function?
Do you mean wing loading? You will have to calculate it out using the calculator function as natively there is not result obtainment for wing loading.
Ideally y+ is less than 1. However refer to what Darren has mentioned, there is likely instability when having a y+ of less than 1 and full resolution for the k-esp model. K-w sst would be better. I do not think it is necessary to go further with the mesh fineness so do check your results and see if you need further accuracy.
With a wall function there is likely no need to have such a low y+. As mentioned your result deviation will be minimal for a significant increase in computational cost due the usage of a wall function.
It is possible to obtain a low y+ with say a very high region refinement, but it is computationally very inefficient.