A common output from the pedestrian wind comfort simulation that is of interest is of course the wind comfort plot.
Let’s take an example of a wind comfort plot that is based on the Lawson Comfort Criteria:
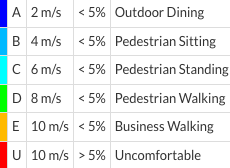
On any area of model, if you see an area with a blue color, it means that this area is suitable for outdoor dining, quite simple so far.
Now at the same time that particular area of outdoor dining mean:
That a velocity of less than 2m/s is not exceeded more than 5% of each hour in a year.
You should be aware that the way you read the comfort plot depends on the wind file you used for your simulation.
Meaning, it doesn’t always have to be like it is mentioned above.
What helps in understanding this is knowing what does the wind file (wind rose) you are using actually represents.
Usually the wind data is recorded at each hour for a full year. In the analysis it is common to make use of historic wind data, meaning wind data that spans over a long period of time.
Now, in the simulation context, this means that there are two scenarios to what sort of wind data file you might want to upload:
1. Full yearly period:
-
You upload a wind file that is between a range of years where roughly all the hours of the day had been recorded, this is a common practice in general.
-
In SimScale, you have the option to import wind data files either manually in a .STAT format or via our wind data provider Meteoblue.
-
The data from Meteoblue corresponds to 30 years of simulated wind data. This data has an hourly base. So the data contains all the hours of 365 days, which is 8670 hours.
-
This way, the comfort plot tells you the average expected hourly wind speed over a full year period.
2. Specific times of the year:
-
Sometimes you would like to assess only a season or a full year but for only over a specific hour range. For example, working hours from 9 am - 5 pm.
-
Then, your wind data file would include wind speed measurements only over 8 hours of each day of the whole year. That is, 8 hours * 365 = 2920 hours.
Finally, coming back to how we read the comfort plot of the “outdoor dining activity” based on those two scenarios:
Full year period → a velocity of less than 2m/s is not exceeded more than 5% of each hour in a year. That is, a velocity of less than 2 m/s is not exceeded for more than 438 hours (5% x 8760h) of the year.
Specific times of the year → a velocity of less than 2 m/s is not exceeded more than 146 hours (5% x 2920hours) of the year.