Project description:
I am running an external aerodynamics simulation using the Incompressible (LBM) solver. The simulation models wind flow over an urban area and I have set up 5 probe point sets at different locations to measure flow variables across the domain at various heights and positions.
What I am trying to achieve:
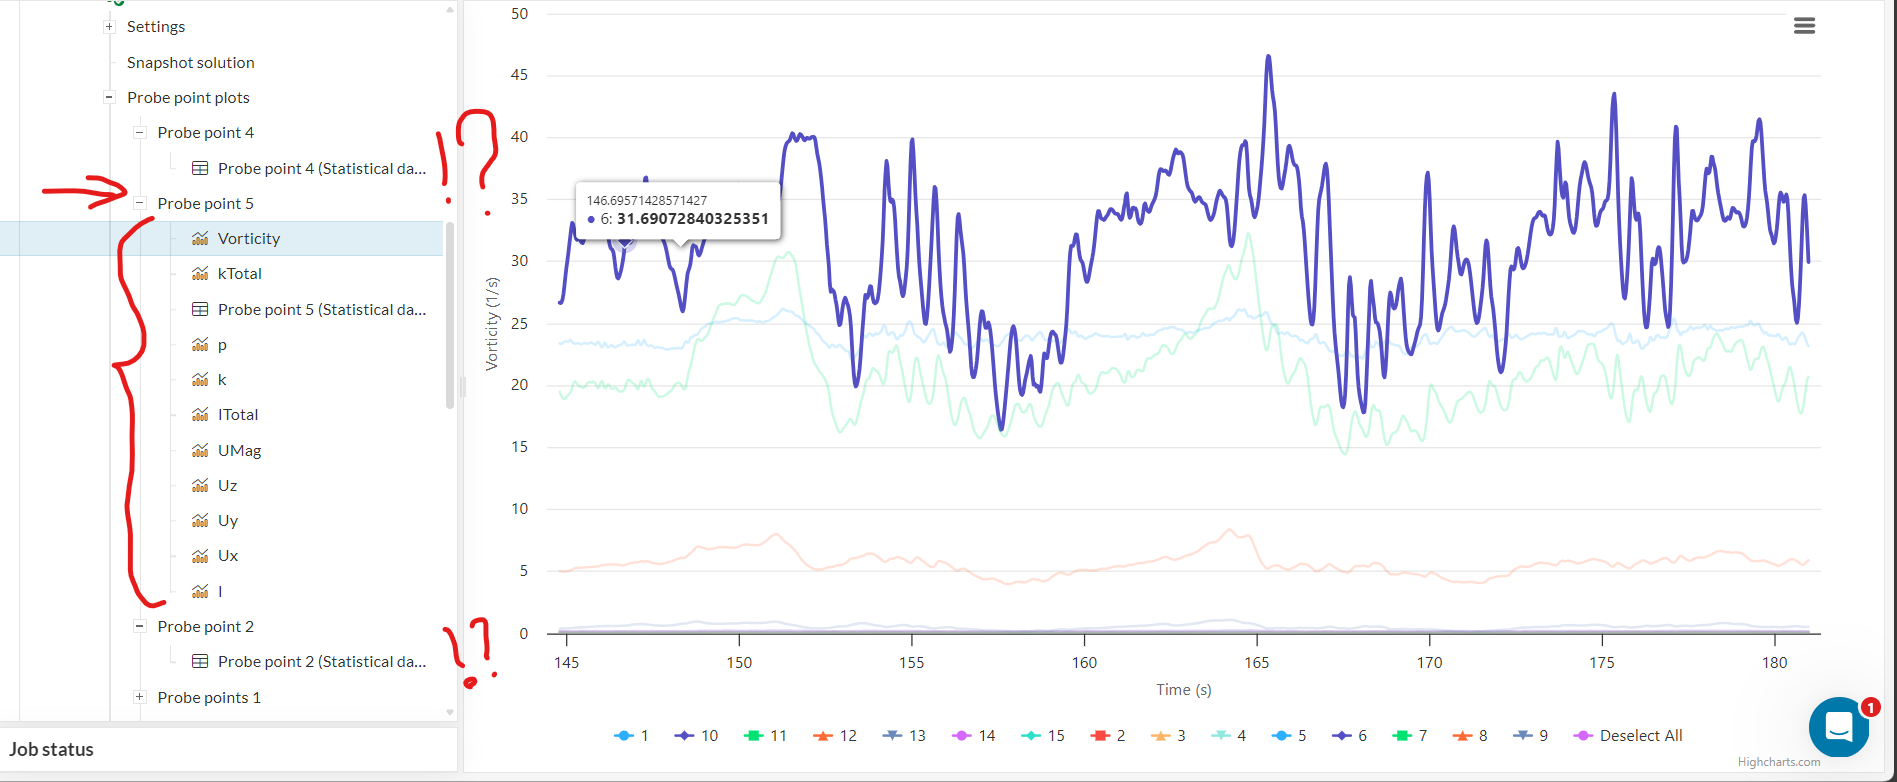
I want to obtain full transient time-series charts (Ux, Uy, Uz, UMag, p, k, kTotal, ITotal, Vorticity, I) for all 5 probe point sets so I can compare flow conditions across different locations in the domain.
What is happening:
Only one probe point set (the last one created) generates the full individual time-series charts for all variables. The other four sets only produce the statistical summary table (MIN, MAX, AVG, RMS, STDDEV) with no time-series charts at all.
I have verified the following:
- All 5 probe point sets have completely identical settings: Write control = Moderate resolution, Fraction from end = 0.2, Export statistical data = ON
- There is no variable selection option anywhere in the settings panel that could explain the difference
- All probe point coordinates are located within the fluid domain and not inside any solid geometry
Questions:
- Why does only the last probe point set generate full time-series charts while the other four only show the statistical table, despite identical settings?
- Is there a known limitation on how many probe point sets can generate full chart outputs in a single LBM run?
- Is this a known bug and is there a workaround without having to re-run the simulation?