This project is simulating a very slow flow through a micro-fludic channel. I am mainly interested in understanding the wall shear stresses at different points in the channel. I would like to have a plot of wall shear stress vs length but I am unsure how to achieve this. I have made cutting planes at different cross sections and i see the desired behavior but it isn’t exactly what I need.
Hi,
Thank you for posting on the forum!
Can you please share your workbench link?
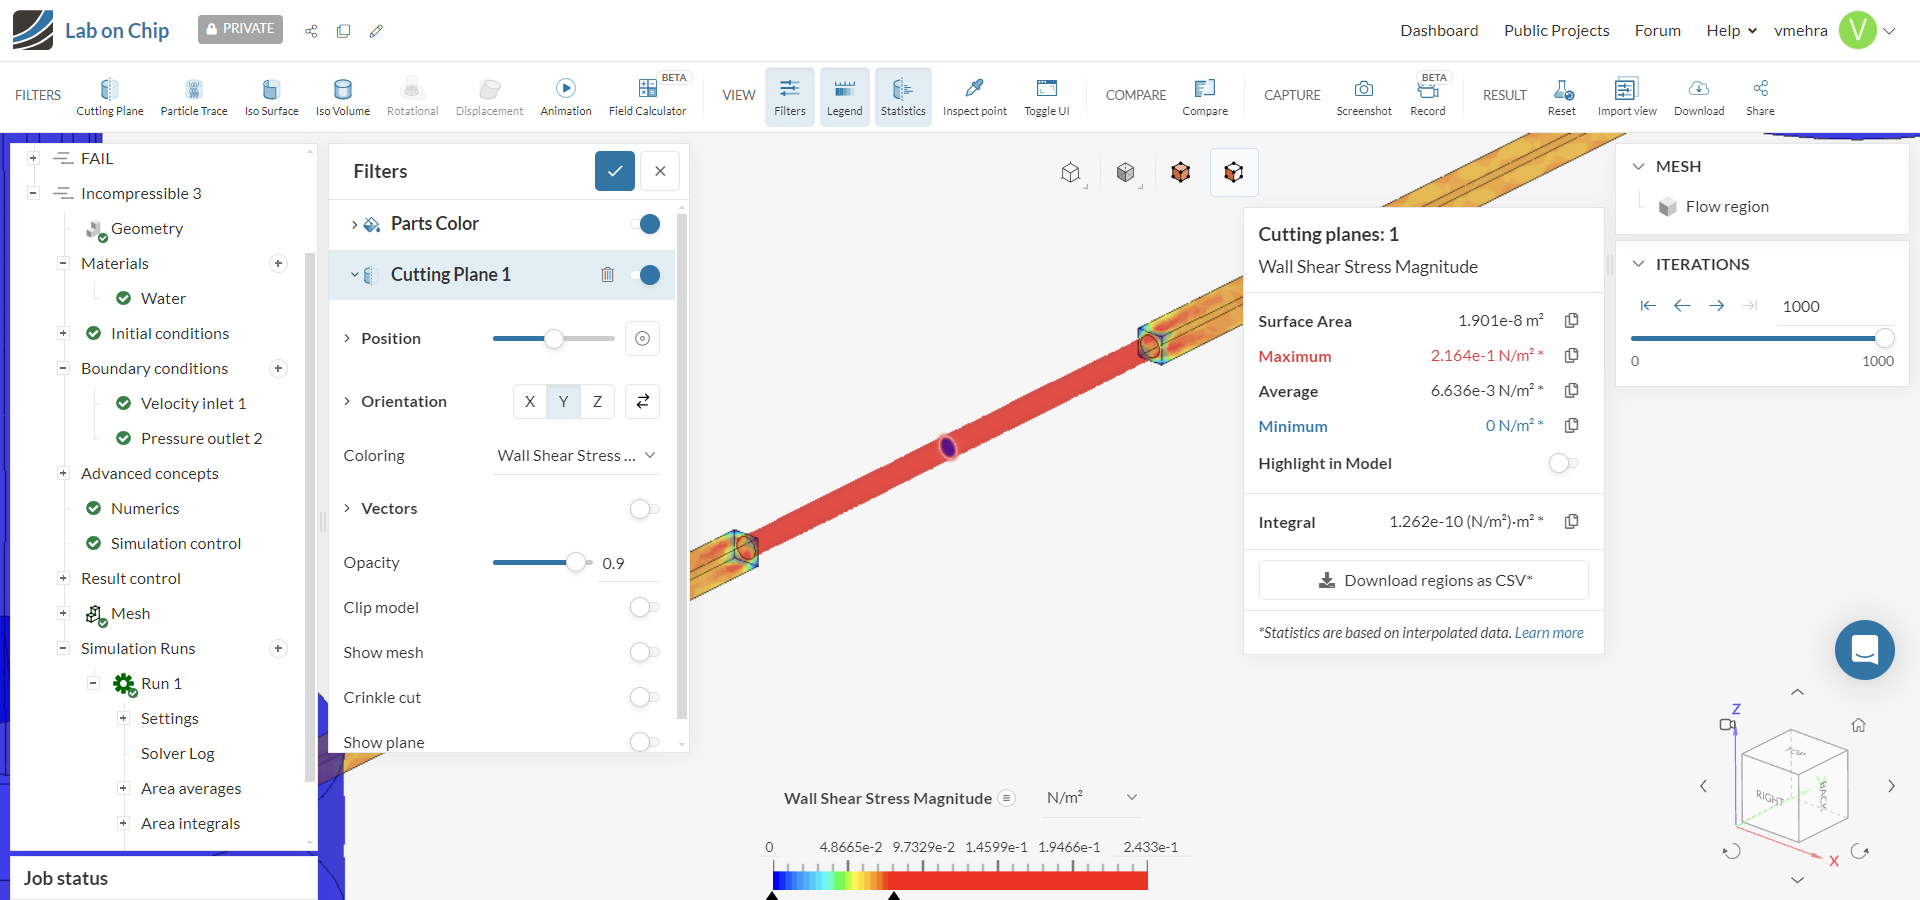
In the meantime, since you have already added shear stress as a result control item, then as an output, you can obtain wall shear stress components in the x, y, and z-directions. Furthermore, the resultant vector for wall shear stress is also available.
However I am not certain if you can plot wall shear stress vs length. Did you know you can also download the results offline to view in a 3rd party post-processing app?
Thank you for your reply. I know how to get the WSS components from the cutting plane and probe etc but was struggling to plot it in any way. I also downloaded the data and exported it into paraview but was struggling there also to get any meaningful result, was a bit complex for me. I am not sure how to share my workbench but my project is public and shared- “Lab on chip”