Hi everyone,
I am currently trying to post-process in ParaView for a project I did here in SimScale.
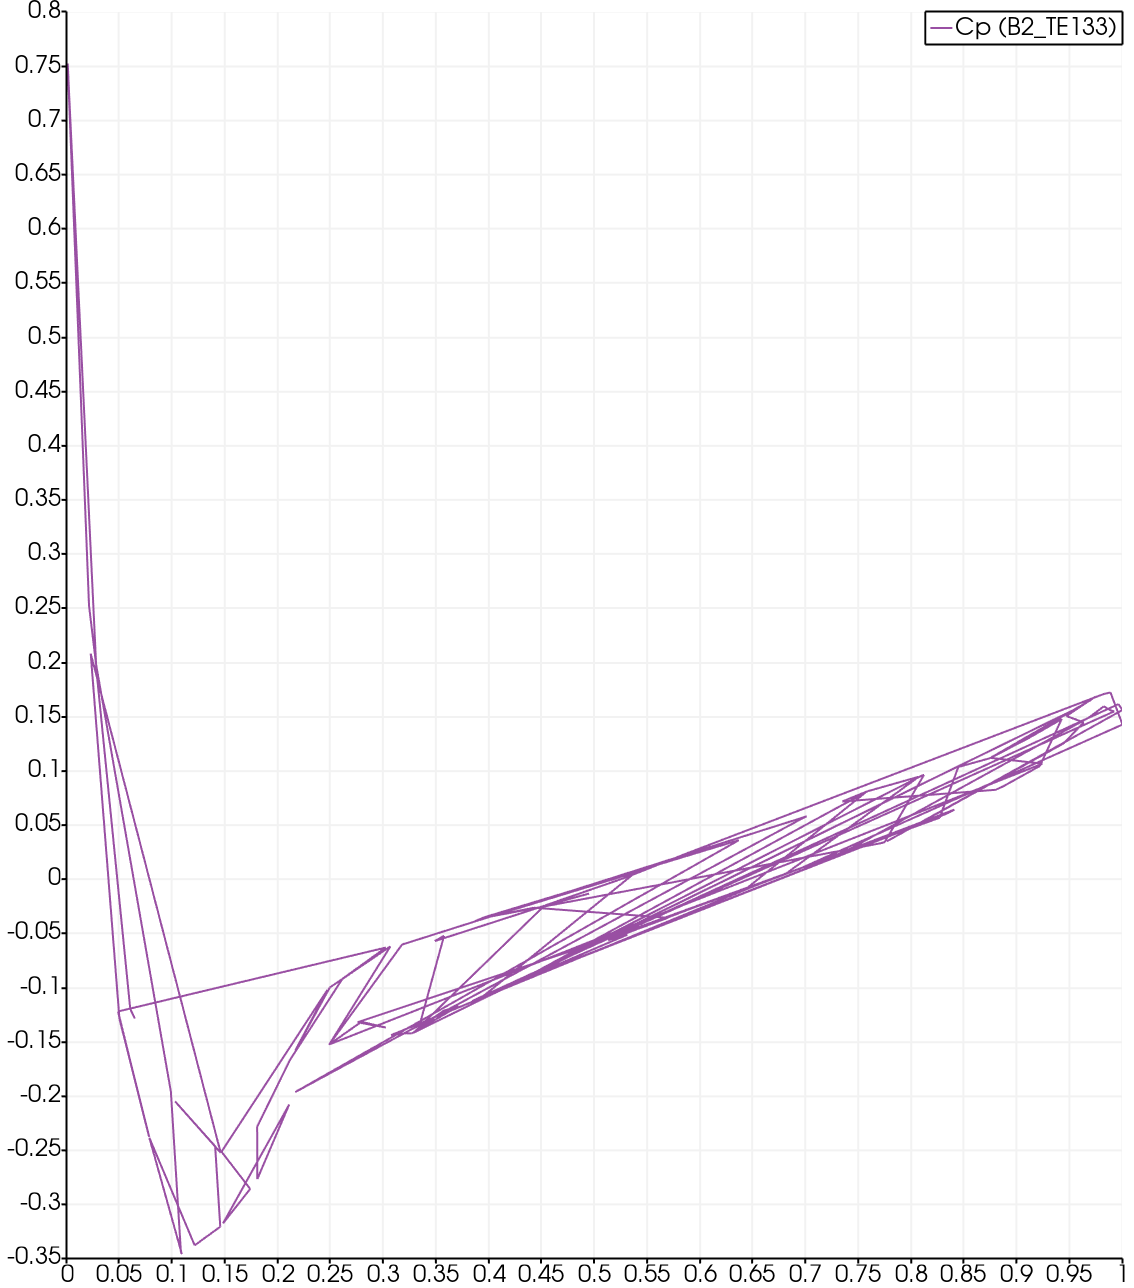
When I go to plot Cp vs the distance along the chord length of my airfoil. I get this …
What could be the possible cause of this?
I know I am being quite vague but I don’t know exact information may be relevant.
Thanks,
Pamela
Hey @pamelatreacy11,
can you post a link to your simulation, and further information which simulation is your plot about ?
Best regards
Kai
Hi Kai,
Have you had any insight into what has gone wrong?
Thanks,
Pamela
Hey Pamela,
not till now, sorry.
Which Surface do you extract and how do you use the calculator ? Sorry, when i first looked at it, i missed the paraview filters.
If you can save the state, and upload it, we can directly open it up in paraview.
Best regards
Kai
Hi Kai,
No problem.
I tried uploading but I am unable to as it says that the extension type is not aloud only jpeg,png etc are authorised.
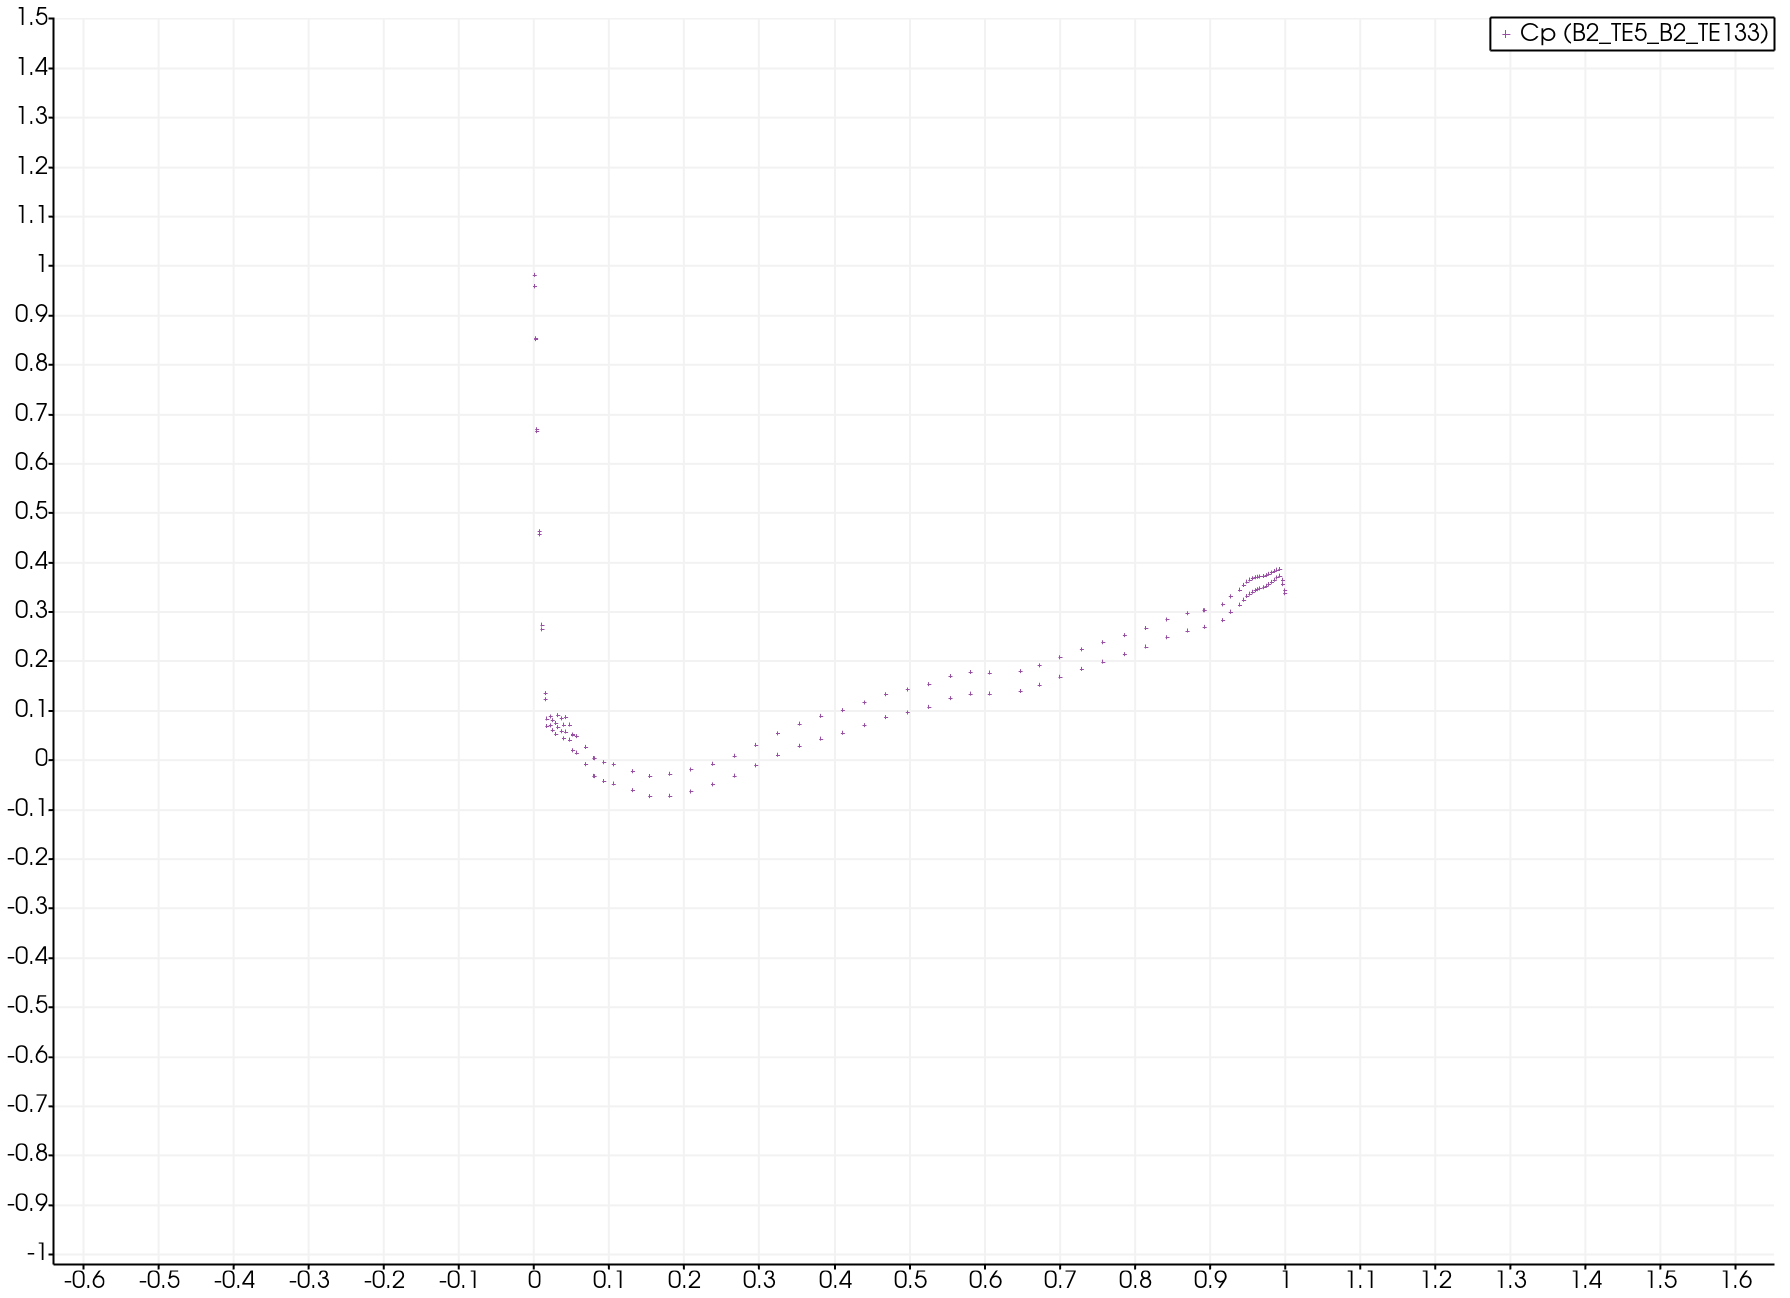
I got it into data points and it looks better but I’m not sure why the coefficient of pressures are so low. Its a NACA0012 airfoil at 6.22 AOA.
Could you suggest where in my data that I could be making the mistake?
Thank you for taking the time,
Pamela
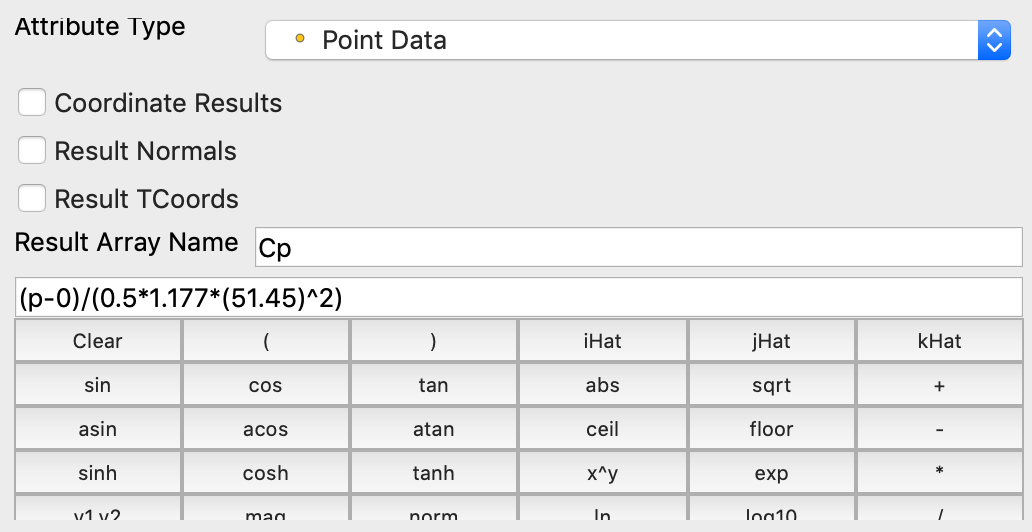
My calculator is as above.
Hey @pamelatreacy11,
so i tried to recreat it. Here is my state file WeTransfer.
Is the slice position correct ?
Best regards
Kai
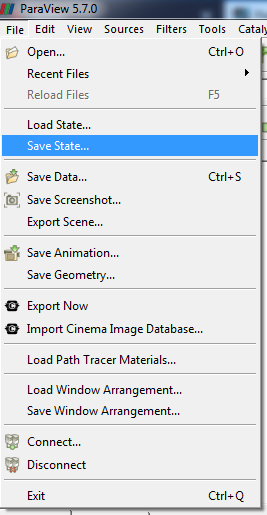
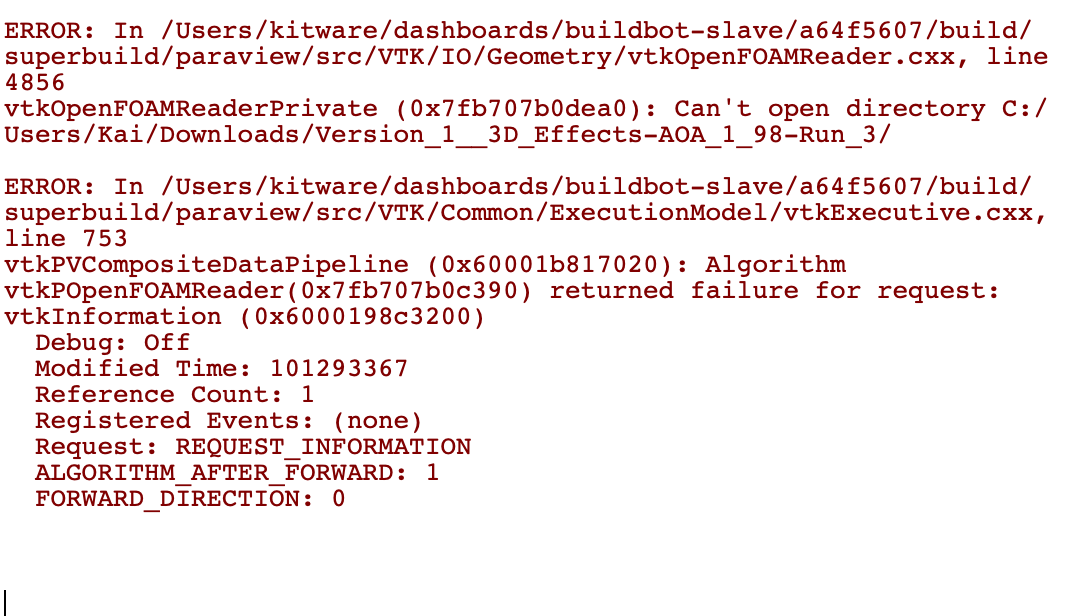
Unfortunately this is the message I got when trying to load the state…
In term of the placement of the slice, either at the symmetry boundary or the open ended side of the airfoil is where I’m trying to extract data from.
Thanks,
Pamela
oh, ok.
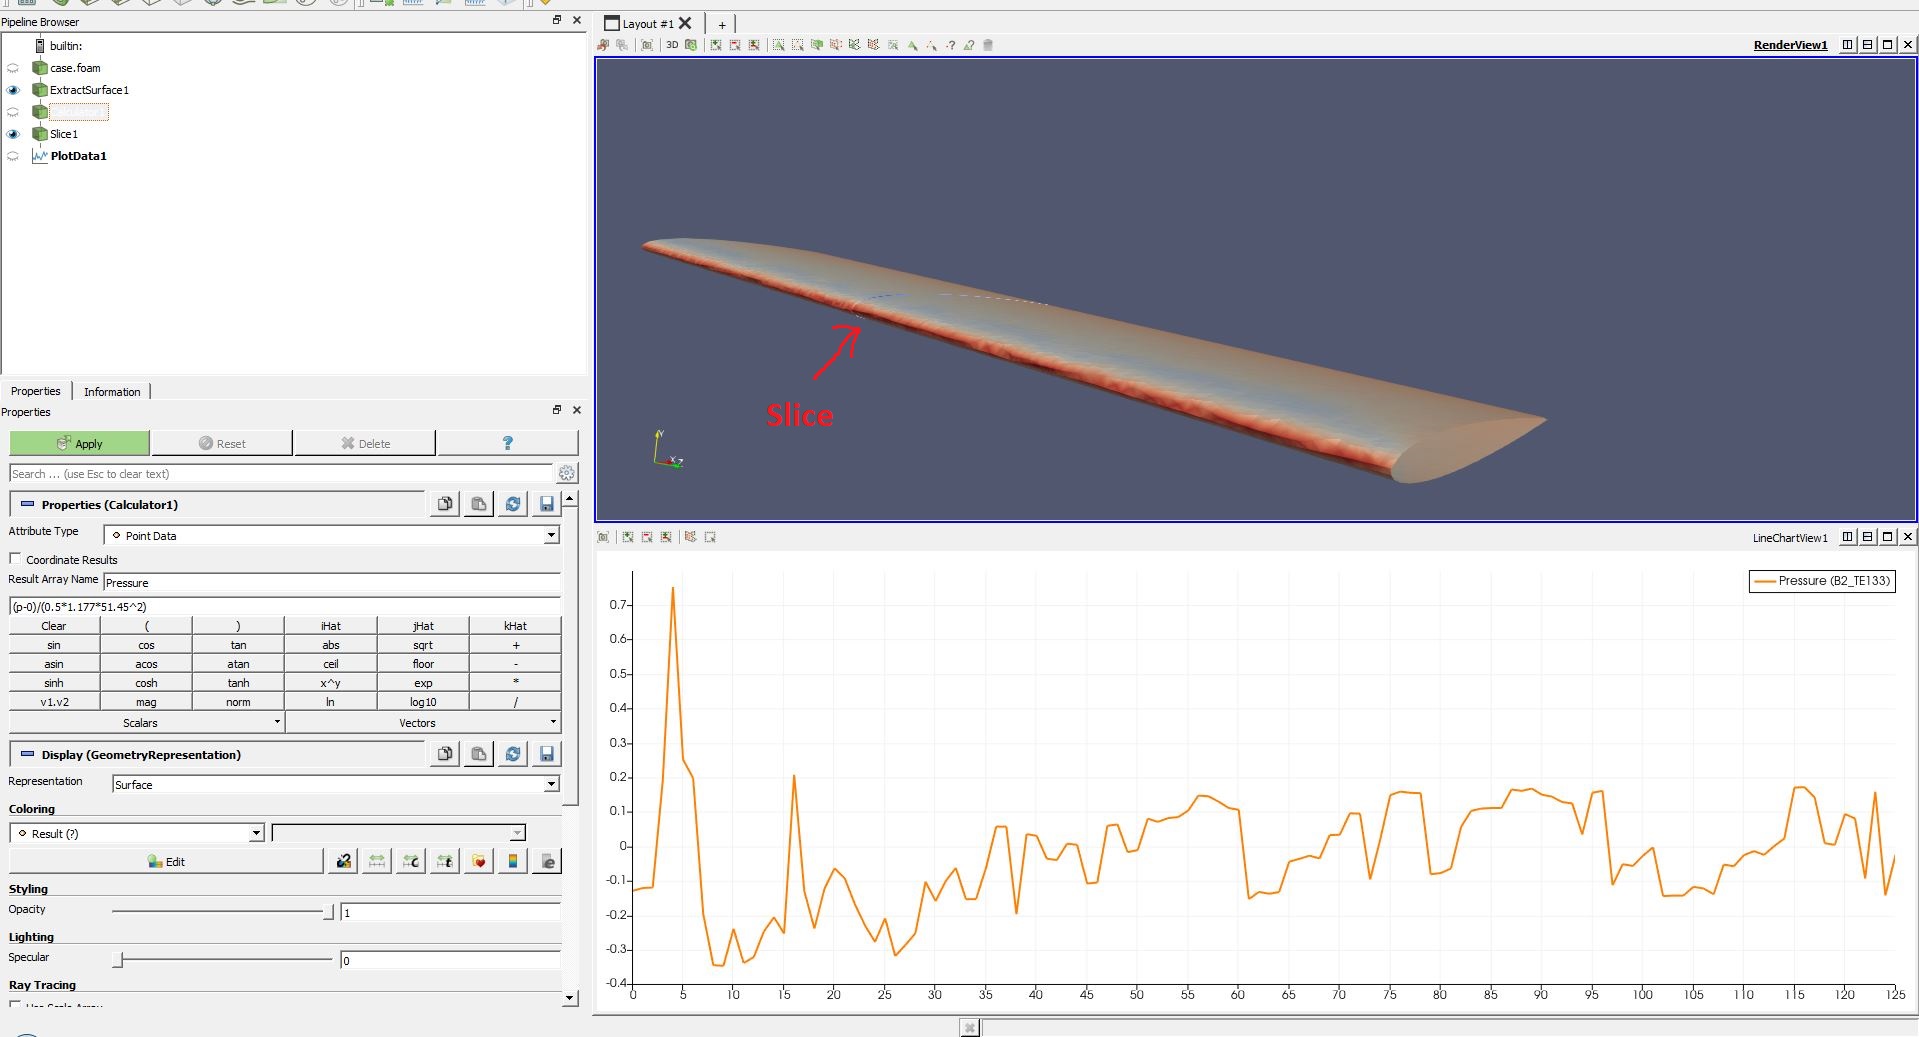
So i made it, like in the screenshot.
How you plot the data, in my case, it plots the spreadsheet without an location reference… ?
Best regards
Kai
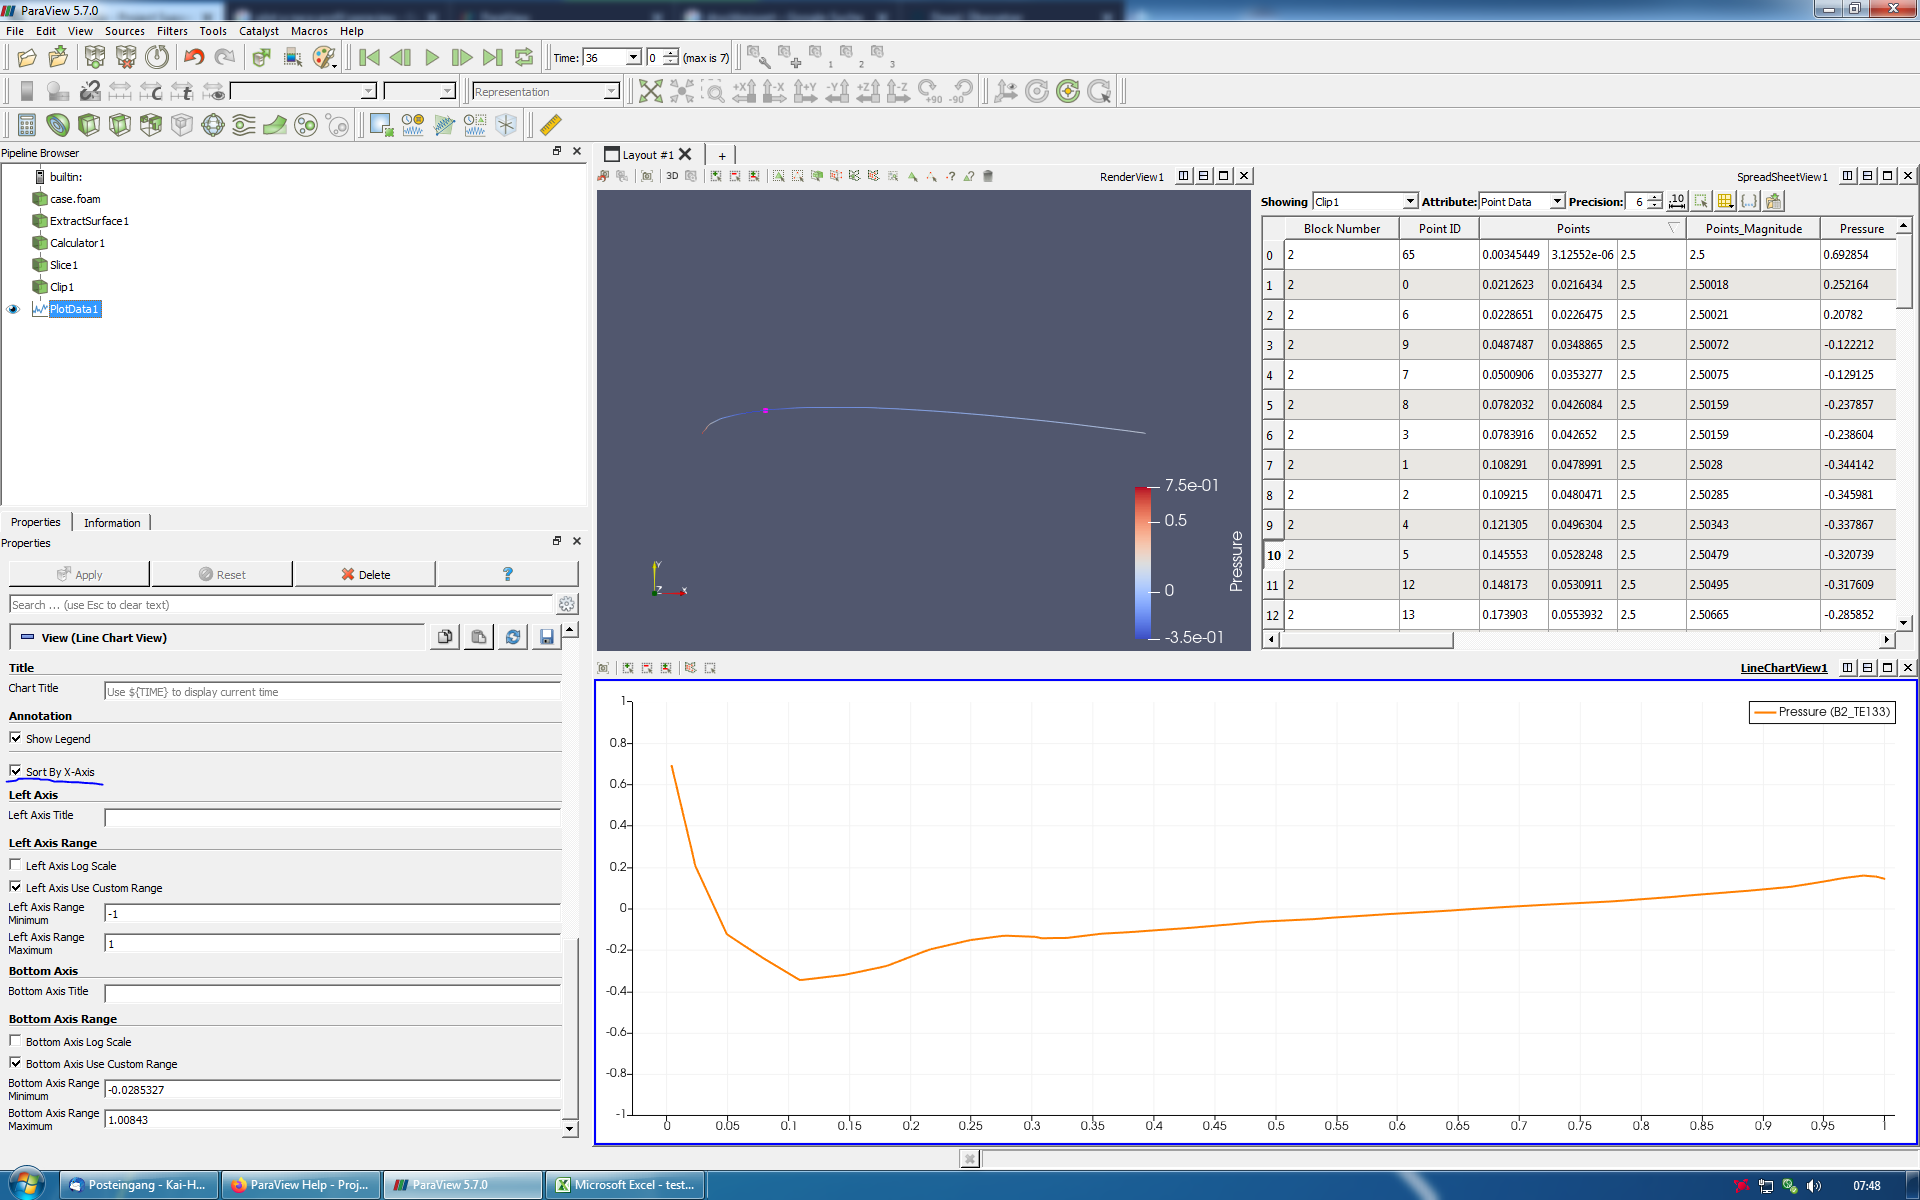
The distance along the chord can be put in place using x array name : points_x
Relearned something new 
Yes, now the Plot looks like the same …
Its looks like the Points_x are not sort in ascending direction, or something like this …?
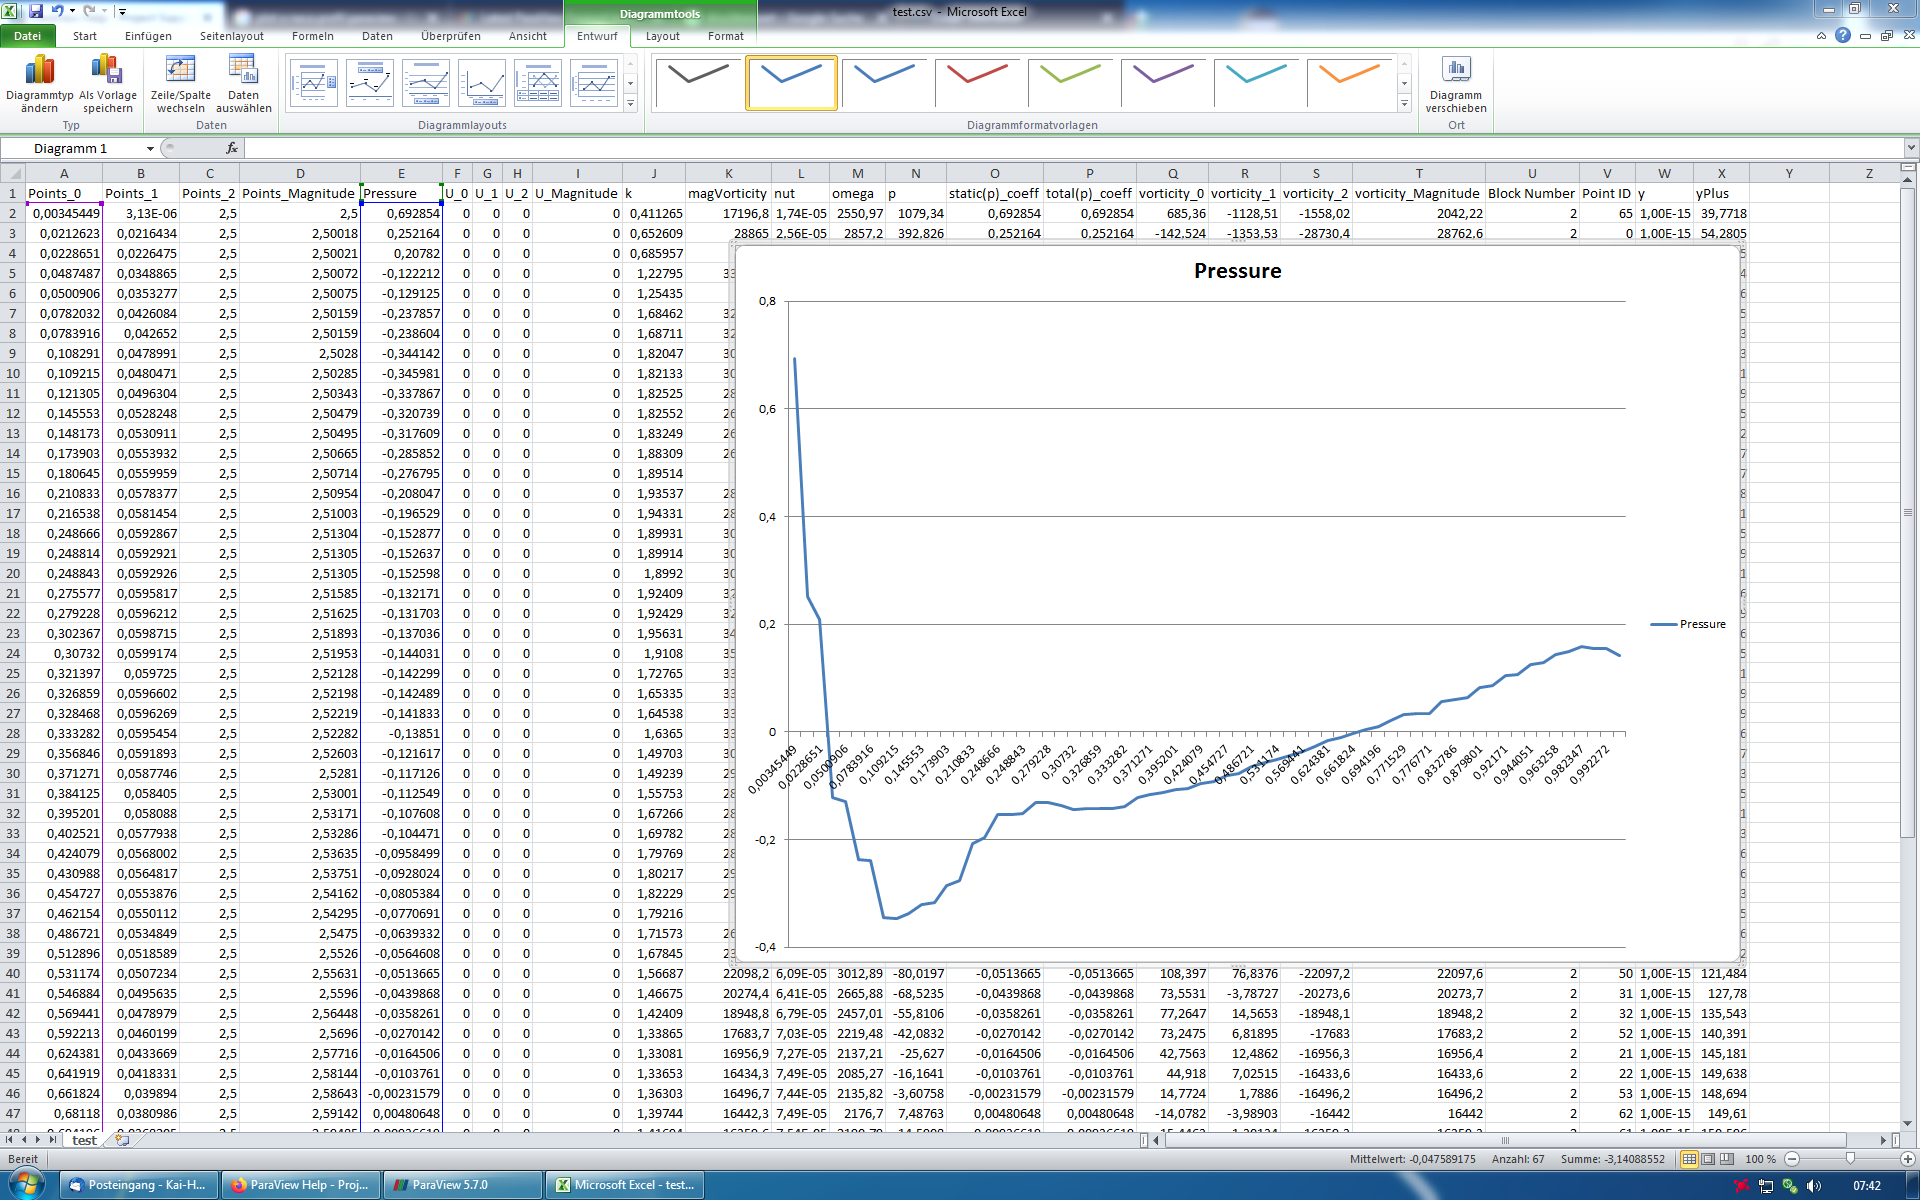
I export the plot data spreadsheet and imported in excel.
But I would also like to know why paraview does not show this sorted.
Best regards
Kai
edit:
sometimes can’t see the forest for the trees